Journals
“They Find Ways to Make the Vegetables Taste Nicer” – Increased Fruit and Vegetable Consumption with the Garden to Table Programme in Four New Zealand Schools
A B S T R A C T
Aim: This project aims to evaluate the Garden to Table programme in low decile Wellington schools.
Methods: In a non-randomized evaluation over three years, schools that enrolled in Garden to Table in Wellington, New Zealand, were invited to participate. Eligible students attended two measurement days per year, for anthropometric measurements and a focus group. Dietary questionnaires were completed by a guardian.
Results: Four schools and 124 children participated in the evaluation. Fruit and vegetable consumption significantly increased with exposure to the program. After at least one year children were able to name more vegetables and had tried more vegetables than at baseline. Children were more willing to try new foods, but this did not reach significance. BMI was not affected.
Conclusion: The Garden to Table programme is well received by children and schools. The programme increased children’s knowledge about and exposure to different vegetables and increased fruit and vegetable consumption.
Keywords
School gardening, fruit and vegetable consumption, child obesity
What This Gap Fills
What is Already Known: Gardening interventions internationally can increase fruit and vegetable consumption and acceptability. There may be an association between a school garden and positive health behaviours.
What this Research Adds: A nationally available school gardening and cooking programme can result in an increase in fruit and vegetable intake in NZ children. This programme is well accepted by children and schools. A cohort of children from low decile schools showed higher levels of obesity than previous cohorts.
Introduction
New Zealand has a significant health problem in childhood obesity. The 2016/17 New Zealand Health Survey reported that 12% of New Zealand children are obese and 21% overweight [1]. However, New Zealand research, the APPLE project in Otago, and Project Energise in the Waikato region, also reported that school-based interventions can prevent childhood obesity [2, 3]. These two studies used interventions with a combined nutrition and physical activity approach to reduce weight gain in intervention schools. In particular, in the intervention arms, the main outcome variable, BMI z-score, held steady but increased in the control arms.
The success of nutrition interventions is less clear. Nutrition education for children increases knowledge around fruit and vegetable intake but as children do not generally purchase or prepare food in the home, this knowledge may not translate into changed behaviour. Education intervention studies report both behaviour change and no behaviour change in regards to vegetable consumption [4, 5]. Gardening interventions may increase positive nutrition behaviours by creating a personal connection between children and the food they have grown, thus increasing willingness to try vegetables. Taste preferences, and therefore acceptance of vegetables, can take between 10 and 15 exposures to develop so that vegetable intake may eventually increase after interventions that increase exposure to vegetables in general. Other predictors of increased vegetable intake include that children ask for fruit and vegetables, children have food preparation skills, and greater self-efficacy [6, 7].
A New Zealand health survey of secondary school students assessed the association between school garden and health indicators [8]. The survey was completed by 8500 students in Auckland and measured nutrition behaviours, physical activity and BMI. Approximately half of the schools attended by study participants had a vegetable garden, although the survey did not specifically identify if respondents actually participated in gardening. The survey reported an association between respondents attending a school with a garden and lower student BMI and takeaway consumption. There was a positive association between fruit and vegetable consumption.
The Garden to Table programme is a New Zealand organisation dedicated to the introduction of regular vegetable gardening in primary schools, and subsequent use of the produce to cook in a home-style kitchen at school. The philosophy of Garden to Table (GTT) is to encourage children to learn to grow, harvest and cook their own fresh, seasonal vegetables, thus encouraging higher vegetable consumption.
This project evaluated the programme in low decile Wellington schools for evidence of an association between participating in a school garden and BMI, the nutritional quality of children's diets, nutrition knowledge, and willingness to try new foods.
Methods
This was a three-year prospective cohort study. The study design followed the TREND statement for the design and reporting of non-randomized evaluations [9]. The student participants were from a convenience sample from schools that chose to participate in the GTT Programme (Link). All schools that enrolled in GTT in Wellington, New Zealand, during 2014 and 2015 were invited to participate in the evaluation. Five schools were eligible and approached, four schools took part. Although we attempted to have a control school willing to delay their participation in GTT for one year, this was unsuccessful as all schools wished to begin straight away. All the schools were in low socioeconomic areas (decile 5 or below). This evaluation was approved by the New Zealand Health and Disability Ethics Committee, approval number 14/CEN/180/AM04.
A typical weekly GTT session involved students split into two groups, one in the garden and one in the kitchen. The gardening students would be involved in jobs appropriate to the season. The kitchen students would be cooking what was harvested that day with the allocated recipe then cleaning up. The students then all eat together. The programme was run under the guidance of a garden and kitchen specialist and other volunteers. The next week the groups would swap. All students are required to participate in class groups; it is not an optional activity. GTT as an organisation provides support to the schools signed up to their programme with recipes, gardening plans and a coordinator in the region or online.
An information sheet, consent form for guardians and assent form for students, was sent home with all students in participating GTT classes (approximately 270 children). The evaluation team also attended parent-teacher interviews to answer questions people may have had about the evaluation. Baseline visits were conducted before the GTT classes started for the year and end of year visits were set for the second to last week of GTT for each year. At each visit, students with valid consent and assent, forms had anthropometric measurements taken and participated in a focus group. Height was measured twice using a portable stadiometer (Seca). Weight and body composition were measured using Tanita scales (Tanita TBF-300). Waist circumference was measured twice using a standard tape measure.
Evaluation of children’s attitude towards eating vegetables and trying new foods used focus groups. A semi-structured interview schedule with open-ended prompt questions was used to generate discussion and data was analysed using thematic analysis. In the focus group, 10 students were asked to identify 5 common (tomato, lettuce, potato, carrot and peas) and 5 less common (beetroot, zucchini, silverbeet, capsicum and beans) vegetables and to state whether they had tried them or not. Other questions asked included what their favourite fruit and vegetables were and whether they liked to try new foods. At the end of each year, a process evaluation of the GTT programme was added, asking questions about their experiences, both positive and negative, that year.
The children’s dietary questionnaire (CDQ, Flinders University Australia) was sent home to the parent/caregiver [10]. This questionnaire gathers data on fruit and vegetables, sugary drinks and non-core food consumption. For fruit and vegetable intake, this score sums categories of variety, quantity and frequency and a good intake is recommended as a score of 14 or higher. In two of the schools, this questionnaire was also administered to the students on the evaluation day. A $50 grocery voucher was offered as a prize draw at each time point for returning the CDQ. The students got a certificate each for participating in the evaluation.
Statistical Methods
The primary outcome was BMI z-score and secondary outcomes waist circumference, CDQ data and qualitative measures from the focus groups. Simple data summaries are shown by Visit and Exposure years to gardening. Joined line plots of individual response variables are shown against Exposure years to gardening with a Locally Weighted Scatter Plot Smoother (LOESS) line and 90% confidence limits to informally examine for any trend in these response variables with time. The LOESS smoother in this instance may be influenced by the few participants that had three years of gardening exposure.
The evidence for a linear change in response variables with Exposure years to gardening used a mixed linear model with random intercept and slope terms by participants and an unstructured covariance matrix for these to take account of the repeated measurements on the same participants. SAS version 9.4 was used.
Results
The four schools that participated in the evaluation were geographically separated. Of the 270 consent forms sent home, we had permission to measure 124 children (46%). As ethnicity was not asked of the children, the ethnic makeup for each school is shown in (Table 1). The cohort represented a large range of ethnic groups and reflected the ethnic make-up of lower decile New Zealand Schools. The summary baseline continuous variable data is shown in (Table 2) and 67/124 (54%) participants were female.
Table 1: Ethnicities of children at participating schools.
|
|
School 1: Decile 1 |
School 2: Decile 3 |
School 3: Decile 4 |
School 4: Decile 5 |
|
|
Percentage |
|||
|
Māori |
16 |
61 |
9 |
12 |
|
NZ European |
|
22 |
3 |
18 |
|
Pacific |
79 |
17 |
47 |
27 |
|
African |
|
|
13 |
3 |
|
Asian/Indian |
|
|
24 |
19 |
|
Middle East |
|
|
4 |
17 |
|
Other |
5 |
|
|
4 |
Table 2: Baseline characteristics of participating children.
|
Combined Schools N = 124 |
Mean (SD) |
|
Age (years) |
9.4 (1.4) |
|
Weight (kg) |
42.9 (15.3) |
|
Height (cm) |
142.1 (11.6) |
|
BMI (kg/m2) |
20.7 (4.8) |
|
Waist circumference (cm) |
70.2 (11.3) |
|
Waist to Height Ratio |
0.49 (0.06) |
|
BMI z-score |
1.59 (6.1) |
|
BMI z-score Percentile |
77.3 (25.5) |
|
Body Fat (%) |
25.2 (9.7) |
I Anthropometric and Dietary Questionnaire Results
All variables are presented by the visit in (Table 3). Variables reported from the children’s dietary questionnaire are the summary variables – fruit and vegetable intake, full-fat dairy product intake and non-core foods (takeaways and “junk food”). For fruit and vegetable intake, this score sums categories of variety, quantity and frequency and a good intake is recommended as a score of 14 or higher. The BMI z-score and Fruit and Vegetable Score are also presented as LOESS smoothed plots in (Figures 1 & 2). For all the plots, individual participants are in grey and the fitted smoothed LOESS in dark red with 90% CI in lighter red. Fitted regression lines by Exposure year (number of units change in response variable per year of gardening exposure) from the mixed linear models (Table 4) found a statistically significant association between fruit and vegetable consumption and increasing GTT exposure. There were no other statistically significant associations.
Table 3: Body composition and food intake by visit.
|
Visit 1 |
Visit 2 |
Visit 3 |
Visit 4 |
|
|
Variable (N) |
Mean (SD) |
Mean (SD) |
Mean (SD) |
Mean (SD) |
|
Age (years) N=124 |
9.4 (1.4) |
10.2 (1.4) |
10.2 (1.0) |
10.8 (0.5) |
|
BMI (kg/m2) N=124 |
20.7 (4.8) |
21.3 (5.2) |
20.3 (4.2) |
20.1 (6.1) |
|
BMI Z score N=124 |
1.1 (1.0) |
1.0 (1.0) |
0.8 (1.1) |
0.4 (1.6) |
|
BMI percentile N=124 |
77.4 (25.5) |
77.3 (25.4) |
71.7 (29.9) |
61.3 (40.5) |
|
Exposure years N=124 |
0.1 (0.3) |
1.1 (0.4) |
2.0 (0.0) |
3 (0) |
|
Fat Free Mass (kg) N=124 |
30.9 (7.8) |
33.2 (8.9) |
33.6 (7.7) |
33.7 (4.2) |
|
Fat mass (kg) N=124 |
12 (8.7) |
13.7 (9.7) |
10.5 (6.2) |
10.5 (7.9) |
|
Fat percentage (%) N=124 |
25.2 (9.7) |
26.6 (10.1) |
22.2 (8.8) |
21.4 (11.2) |
|
Waist to Height Ratio N=124 |
0.5 (0.1) |
0.5 (0.1) |
0.4 (0.1) |
0.4 (0.1) |
|
Waist circumference (cm) N=124 |
70.2 (11.3) |
68.9 (12.3) |
65 (11.1) |
60.1 (11.2) |
|
Weight (kg) N=124 |
42.9 (15.3) |
46.9 (16.9) |
44.1 (12.5) |
44.1 (11.9) |
|
Height (cm) N=124 |
142.1 (11.6) |
146.4 (11.7) |
146.5 (9.2) |
148.7 (4.1) |
|
Fruit Veg Parent report N=70 |
19.8 (8.1) |
23.9 (6.9) |
21.9 (6.8) |
34.1 (NA) |
|
Fruit Veg Child report N=75 |
14.4 (8.2) |
20.9 (7.4) |
20.3 (7.8) |
26 (5.1) |
|
Full fat dairy Parent report N=70 |
4.4 (3.2) |
3.3 (2.4) |
3.8 (3.3) |
7 (NA) |
|
Full fat dairy Child report N=75 |
2.5 (2.7) |
2.5 (2.6) |
4.2 (3.4) |
4.5 (3.1) |
|
Non-core food Parent report N=70 |
2.8 (1.4) |
2.0 (1.2) |
2.6 (1.9) |
1.9 (.) |
|
Non-core food Child report N=75 |
2.9 (2.2) |
2.4 (1.5) |
2.4 (1.5) |
2.5 (1.4) |
|
Sweet beverage Parent report N=70 |
1.5 (1.5) |
1.3 (1.2) |
1.2 (1.1) |
1 (NA) |
|
Sweet beverage Child report N=75 |
1.3 (1.5) |
1.3 (1.2) |
1.4 (1.5) |
2 (1.8) |
Table 4: Fitted regression lines by exposure year (number of units change in response variable per year of gardening exposure) from the mixed linear models.
|
Response variable |
Regression coefficient (95% CI) |
P |
|
BMI Z score |
0.001 (-0.05 to 0.05) |
0.96 |
|
BMI percentile |
0.72 (-0.7 to 2.1) |
0.32 |
|
Fruit-vegetable Parent report |
0.9 (0.3 to 3.7) |
0.024 |
|
Fruit-vegetable Child report |
3.2 (1.9 to 4.4) |
<0.001 |
|
Full fat dairy Parent report |
-0.2 (-0.9 to 0.5) |
0.50 |
|
Full fat dairy Child report |
0.4 (-0.1 to 1.0) |
0.13 |
|
Noncore foods Parent report |
-0.2 (-0.5 to 0.04) |
0.09 |
|
Noncore foods Child report |
-0.2 (-0.6 to 0.1) |
0.20 |
|
Sweet beverage Parent report |
-0.2 (-0.4 to 0.1) |
0.24 |
|
Sweet beverage Child report |
0.03 (-0.2 to 0.3) |
0.82 |
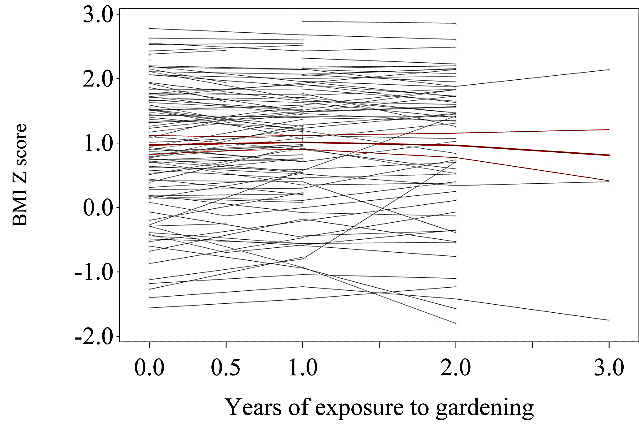
Figure 1: LOESS Plot BMI Z-Score.
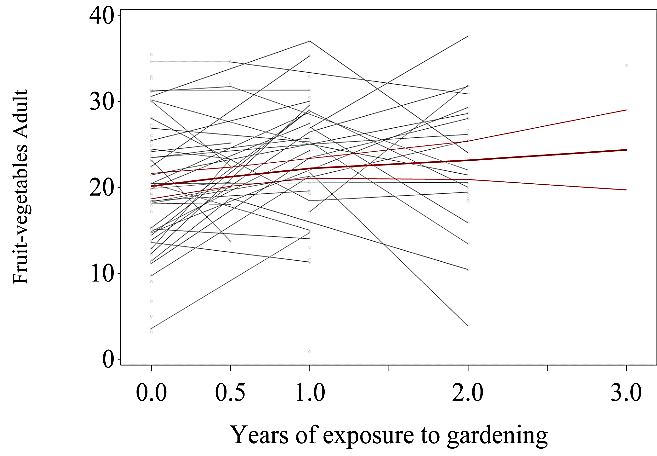
Figure 2: LOESS Plot Fruit and Vegetable Score – Adult Report.
II Focus Group Results
The percentage of children knowing the name of both the common (lettuce) and uncommon (all) vegetables significantly increased over the intervention (Table 5). Likewise, the numbers of children having tried each vegetable increased significantly for courgette, silverbeet and capsicum (Table 6). The most common comments were for the green beans – before the intervention, most children thought they were “pea sacks,” and after the intervention, the most common guess was broad beans, reflecting what had been grown in their gardens that year.
The number of children who liked trying new foods rose from 75.7% to 84% but this was not statistically significant. Some of the comments about trying new foods were positive and some philosophical: "so we can say to people we've eaten it", "you don’t want to be fussy all your life", "so we don't always eat the same food all the time", “you try foods and sometimes they are yum and sometimes they are yuck”.
Table 5: Mean (SD) percentage of children knowing the name of vegetables.
|
|
Before intervention |
After intervention |
|
Peas |
88.3 (25.7) |
99.4 (3.0) |
|
Tomato |
100 (0) |
98.1 (6.2) |
|
Potato |
93.5 (11.6) |
93.4 (19.1) |
|
Carrot |
98.5 (4.6) |
99.3 (3.2) |
|
Lettuce |
67.4 (37.0) |
90.3 (17.6) * |
|
Courgette |
24.8 (30.9) |
73.2 (35.2) ** |
|
Silverbeet |
28.7 (28.4) |
53.6 (35.4) * |
|
Capsicum |
72.8 (28.0) |
94.1 (12.4) ** |
|
Beans |
45.8 (32.2) |
68.9 (33.3) * |
|
Beetroot |
50.0 (33.8) |
83.9 (26.3) ** |
T-Test; *P < 0.05; **P < 0.01.
Table 6: Mean (SD) percentage of children having tried the vegetables.
|
|
Before intervention |
After intervention |
|
Peas |
92.1 (17.7) |
98.9 (5.2) |
|
Tomato |
97.2 (8.7) |
98.1 (6.2) |
|
Potato |
98.9 (4.6) |
95.8 (16.1) |
|
Carrot |
98.3 (5.3) |
100 (0) |
|
Lettuce |
88.1 (29.6) |
96.0 (9.4) |
|
Courgette |
44.3 (38.6) |
81.3 (27.4) ** |
|
Silverbeet |
76.6 (18.4) |
90.9 (19.2) * |
|
Capsicum |
77.7 (20.6) |
91.7 (11.4) * |
|
Beans |
78.9 (20.2) |
85.2 (22.0) |
|
Beetroot |
71.5 (29.3) |
84.0 (28.3) |
T-Test; *P < 0.05; **P < 0.01.
III Process Evaluation
i “What Did You Like the Most?”
The children were overwhelmingly positive about GTT, evidenced by such comments as “everything”, “it’s fun” and “it’s awesome”. Children liked both the gardening and cooking modules, although some children were less keen on one or the other. Some comments showed progressing acceptance over the programme “The vegetables get yummier over time – you get used to it”. Some schools used “MasterChef” type challenges and competitions in the programme, and this was very popular, as was getting to be head chef for the session.
ii “What Did You Like the Least?”
This section elicited some minor complaints such as getting wet (dishes) and muddy (gardening), dealing with insects and compost. Some jobs were clearly unpopular – washing dishes, taking out rubbish and weeding were often mentioned.
iii “Have You Done Anything at Home that You Learned at GTT?”
As the children were aged from 7 to 12 with schools choosing to implement GTT at different ages, this impacted on the number of children replicating GTT activities at home. Children reporting making GTT dishes at home were older, while younger children tended to report gardening at home. Some of the children reported using knife skills at home “I taught my nana how to cut silverbeet properly” and reported chopping vegetables for dinner preparation (“chopping with a bear claw”). A good number of children did report making dishes at home, ranging from simple (scrambled eggs and pizza) to more complex (dumplings, roast veggies, and sushi).
Some discussions occurred around whether the children ate more vegetables at home after doing GTT. Some were positive and others neutral. One child remarked that "my parents couldn’t believe I ate the veggies at school". Another "maybe but depends on how they are cooked", "they (GTT) find ways to make the vegetables taste nicer".
iv “What Could Improve GTT?”
The suggestions given here ranged from the aspirational “a fountain,” “a new kitchen,” and “a glass house” to the practical “aprons”, “gumboots,” and “clean plates”. A common theme was how to protect the garden better from animals and people, with better fences, nets and signs all suggested. One of the older groups said that they wanted it to be more challenging "We could do more as we are capable of doing more - teacher does a lot for us we could be doing ourselves".
IV Principal and Teacher Feedback
The keys to success from a Principal and School point of view from the interviews were: stable funding, enough volunteers and integration into school and community life. Having strong community links was important for borrowing equipment (or getting it donated), sourcing volunteers and having help over the holidays with weeding and watering. It was also important for organising trips to visit restaurant kitchens, getting prizes donated and sourcing extra funding.
i Integration with Curriculum
The teachers and garden specialist discussed how positive it had been for the children and about integrating other subjects with the garden. Maths was the obvious one with measuring and working out how much was saved buying seeds vs. buying the vegetables at the store. The children were following systems through from the seeds to harvesting and again from raw food to cook. Art was also incorporated, and children painted murals around the gardens.
ii Increased Vegetable Consumption and Acceptance
The teachers had noticed children eating more vegetables at school events (camp, shared morning teas) and thought they were influencing their siblings as well. “We just had camped, and when they made their own burgers, they used more vegetables lots more vegetables in their burgers.” “The positives are the attitude towards veggies has changed, they have dips from veggies and more fruit. They wouldn’t have eaten this (healthy shared morning tea) so enthusiastically before. If they get the sugar out of their lives, they don’t miss it.” But they noted that it needed to be supported schoolwide “We need more whole school buy-in. The school culture for the teachers is to have junk food for celebrations. We need to emphasize the importance – lots of the community is affected by diabetes”.
iii Personal Growth
Teachers and volunteers also notice the children changing with the programme personally. “They have nurtured the plants, it’s an achievement and an attitude change for them. The kids come to the teachers and say what they have done at home.” “They are more willing to try everything and that’s in any situation” “They learn problem-solving. We’ve got a sick lime tree – they have to research how to look after it”.
Discussion
The study demonstrates that a school-based gardening programme incorporating both growing of vegetables and preparation of them into meals was well received by children and schools. The programme increased children’s knowledge about and exposure to different vegetables and increased fruit and vegetable consumption. This cohort was larger than other cohorts reporting similar programmes and focused on low decile schools, where rates of obesity are high and health literacy and fruit and vegetable consumption are generally low. The Apple study followed 470 children across seven schools in Otago and reported the baseline BMI z-scores were 0.80 (±0.7) and 0.61 (±0.82) for the control and intervention groups, respectively [3]. Even allowing for increases in obesity over the time period since this study, our findings showed the baseline BMI z-score was double that of the Apple study. Furthermore, our cohort is more overweight than the New Zealand Health Survey 2016/2017 report from children aged 9 and above [1].
The focus group data showed that with gardening exposure, children were able to name more vegetables and were also more likely to have tried them. One interesting phenomenon with beans and beetroot was that while children struggled to name them in their natural form, they had eaten them in other forms – for beans it was from frozen and for beetroot, it was tinned. Children overwhelmingly reported enjoying the GTT programme and teachers and principals were also very positive about the programme and its’ effects. While the GTT programme is aimed at children aged 7-10 years, this evaluation included a class of older children aged 11 and 12 who were doing it with success and with perhaps more ability to change intake based on the feedback that it was these students who were more likely to be cooking at home.
Although the LOESS fit for BMI z-score is consistent with a reduced BMI z-score with more years of exposure to gardening, this did not reach significance, which is likely due to the small numbers of children completing the three-year evaluation. The LOESS fit for BMI percentile had no particular pattern and the regression coefficient showed no evidence of a relationship. As the determinants of obesity are complex and likely beyond the scope of one intervention to influence. There was no specific intervention around either exercise or the reduction of non-core food items. Incorporating these in a multi-faceted intervention may be more likely to have a greater impact. Despite no specific effort to reduce non-core food consumption, there was an encouraging non-significant trend to reduction in intake.
The LOESS fits for Fruit and Vegetable intake are consistent with an increased intake over time with a steeper regression line when questionnaires were answered by children compared to parents. One school started halfway through the first year, which explains the steeper points at this exposure in the LOESS graphs. The observation of increased fruit and vegetable intake provides further evidence that exposure to fruit and vegetables is a key determinant of intake. Furthermore, that gardening and cooking is a valid way to achieve this. GTT also results in increased food preparation skills and self-efficacy, which have been shown to be determinants of fruit and vegetable intake [6, 7].
There were some limitations around the dietary questionnaire with one data collection falling the day after students had returned from school camp, and another day falling after school had been closed following a major earthquake. Both of these events would have affected their usual diets. Compliance from parents returning the questionnaire was low, and this reflects the nature of the low socioeconomic demographic from which the children were from. Having a control group would have been useful to have seen the effects of growth within a similar cohort.
Conclusion
The GTT programme is well received by children and schools. The programme increased children’s knowledge about and exposure to different vegetables and increased fruit and vegetable consumption. Although this did not translate into a significant reduction in BMI in children from these low decile schools, the lack of increase in BMI remains encouraging as the natural trend in this population is for the progressive increase in BMI over time. Further research is required to understand how to translate the positive improvements in knowledge and interest in healthy foods into sustained behavioural changes and patterns that facilitate this.
Funding
This evaluation was supported by a grant in aid from Pub Charity New Zealand.
Conflicts of Interest
None.
Article Info
Article Type
Research ArticlePublication history
Received: Tue 28, Jul 2020Accepted: Tue 11, Aug 2020
Published: Fri 21, Aug 2020
Copyright
© 2023 Amber Parry Strong. This is an open-access article distributed under the terms of the Creative Commons Attribution License, which permits unrestricted use, distribution, and reproduction in any medium, provided the original author and source are credited. Hosting by Science Repository.DOI: 10.31487/j.JFNM.2020.02.06
Author Info
Corresponding Author
Amber Parry StrongCentre for Endocrine, Diabetes & Obesity Research, Wellington Hospital, Wellington, New Zealand
Figures & Tables
Table 1: Ethnicities of children at participating schools.
|
|
School 1: Decile 1 |
School 2: Decile 3 |
School 3: Decile 4 |
School 4: Decile 5 |
|
|
Percentage |
|||
|
Māori |
16 |
61 |
9 |
12 |
|
NZ European |
|
22 |
3 |
18 |
|
Pacific |
79 |
17 |
47 |
27 |
|
African |
|
|
13 |
3 |
|
Asian/Indian |
|
|
24 |
19 |
|
Middle East |
|
|
4 |
17 |
|
Other |
5 |
|
|
4 |
Table 2: Baseline characteristics of participating children.
|
Combined Schools N = 124 |
Mean (SD) |
|
Age (years) |
9.4 (1.4) |
|
Weight (kg) |
42.9 (15.3) |
|
Height (cm) |
142.1 (11.6) |
|
BMI (kg/m2) |
20.7 (4.8) |
|
Waist circumference (cm) |
70.2 (11.3) |
|
Waist to Height Ratio |
0.49 (0.06) |
|
BMI z-score |
1.59 (6.1) |
|
BMI z-score Percentile |
77.3 (25.5) |
|
Body Fat (%) |
25.2 (9.7) |
Table 3: Body composition and food intake by visit.
|
Visit 1 |
Visit 2 |
Visit 3 |
Visit 4 |
|
|
Variable (N) |
Mean (SD) |
Mean (SD) |
Mean (SD) |
Mean (SD) |
|
Age (years) N=124 |
9.4 (1.4) |
10.2 (1.4) |
10.2 (1.0) |
10.8 (0.5) |
|
BMI (kg/m2) N=124 |
20.7 (4.8) |
21.3 (5.2) |
20.3 (4.2) |
20.1 (6.1) |
|
BMI Z score N=124 |
1.1 (1.0) |
1.0 (1.0) |
0.8 (1.1) |
0.4 (1.6) |
|
BMI percentile N=124 |
77.4 (25.5) |
77.3 (25.4) |
71.7 (29.9) |
61.3 (40.5) |
|
Exposure years N=124 |
0.1 (0.3) |
1.1 (0.4) |
2.0 (0.0) |
3 (0) |
|
Fat Free Mass (kg) N=124 |
30.9 (7.8) |
33.2 (8.9) |
33.6 (7.7) |
33.7 (4.2) |
|
Fat mass (kg) N=124 |
12 (8.7) |
13.7 (9.7) |
10.5 (6.2) |
10.5 (7.9) |
|
Fat percentage (%) N=124 |
25.2 (9.7) |
26.6 (10.1) |
22.2 (8.8) |
21.4 (11.2) |
|
Waist to Height Ratio N=124 |
0.5 (0.1) |
0.5 (0.1) |
0.4 (0.1) |
0.4 (0.1) |
|
Waist circumference (cm) N=124 |
70.2 (11.3) |
68.9 (12.3) |
65 (11.1) |
60.1 (11.2) |
|
Weight (kg) N=124 |
42.9 (15.3) |
46.9 (16.9) |
44.1 (12.5) |
44.1 (11.9) |
|
Height (cm) N=124 |
142.1 (11.6) |
146.4 (11.7) |
146.5 (9.2) |
148.7 (4.1) |
|
Fruit Veg Parent report N=70 |
19.8 (8.1) |
23.9 (6.9) |
21.9 (6.8) |
34.1 (NA) |
|
Fruit Veg Child report N=75 |
14.4 (8.2) |
20.9 (7.4) |
20.3 (7.8) |
26 (5.1) |
|
Full fat dairy Parent report N=70 |
4.4 (3.2) |
3.3 (2.4) |
3.8 (3.3) |
7 (NA) |
|
Full fat dairy Child report N=75 |
2.5 (2.7) |
2.5 (2.6) |
4.2 (3.4) |
4.5 (3.1) |
|
Non-core food Parent report N=70 |
2.8 (1.4) |
2.0 (1.2) |
2.6 (1.9) |
1.9 (.) |
|
Non-core food Child report N=75 |
2.9 (2.2) |
2.4 (1.5) |
2.4 (1.5) |
2.5 (1.4) |
|
Sweet beverage Parent report N=70 |
1.5 (1.5) |
1.3 (1.2) |
1.2 (1.1) |
1 (NA) |
|
Sweet beverage Child report N=75 |
1.3 (1.5) |
1.3 (1.2) |
1.4 (1.5) |
2 (1.8) |
Table 4: Fitted regression lines by exposure year (number of units change in response variable per year of gardening exposure) from the mixed linear models.
|
Response variable |
Regression coefficient (95% CI) |
P |
|
BMI Z score |
0.001 (-0.05 to 0.05) |
0.96 |
|
BMI percentile |
0.72 (-0.7 to 2.1) |
0.32 |
|
Fruit-vegetable Parent report |
0.9 (0.3 to 3.7) |
0.024 |
|
Fruit-vegetable Child report |
3.2 (1.9 to 4.4) |
<0.001 |
|
Full fat dairy Parent report |
-0.2 (-0.9 to 0.5) |
0.50 |
|
Full fat dairy Child report |
0.4 (-0.1 to 1.0) |
0.13 |
|
Noncore foods Parent report |
-0.2 (-0.5 to 0.04) |
0.09 |
|
Noncore foods Child report |
-0.2 (-0.6 to 0.1) |
0.20 |
|
Sweet beverage Parent report |
-0.2 (-0.4 to 0.1) |
0.24 |
|
Sweet beverage Child report |
0.03 (-0.2 to 0.3) |
0.82 |
Table 5: Mean (SD) percentage of children knowing the name of vegetables.
|
|
Before intervention |
After intervention |
|
Peas |
88.3 (25.7) |
99.4 (3.0) |
|
Tomato |
100 (0) |
98.1 (6.2) |
|
Potato |
93.5 (11.6) |
93.4 (19.1) |
|
Carrot |
98.5 (4.6) |
99.3 (3.2) |
|
Lettuce |
67.4 (37.0) |
90.3 (17.6) * |
|
Courgette |
24.8 (30.9) |
73.2 (35.2) ** |
|
Silverbeet |
28.7 (28.4) |
53.6 (35.4) * |
|
Capsicum |
72.8 (28.0) |
94.1 (12.4) ** |
|
Beans |
45.8 (32.2) |
68.9 (33.3) * |
|
Beetroot |
50.0 (33.8) |
83.9 (26.3) ** |
T-Test; *P < 0.05; **P < 0.01.
Table 6: Mean (SD) percentage of children having tried the vegetables.
|
|
Before intervention |
After intervention |
|
Peas |
92.1 (17.7) |
98.9 (5.2) |
|
Tomato |
97.2 (8.7) |
98.1 (6.2) |
|
Potato |
98.9 (4.6) |
95.8 (16.1) |
|
Carrot |
98.3 (5.3) |
100 (0) |
|
Lettuce |
88.1 (29.6) |
96.0 (9.4) |
|
Courgette |
44.3 (38.6) |
81.3 (27.4) ** |
|
Silverbeet |
76.6 (18.4) |
90.9 (19.2) * |
|
Capsicum |
77.7 (20.6) |
91.7 (11.4) * |
|
Beans |
78.9 (20.2) |
85.2 (22.0) |
|
Beetroot |
71.5 (29.3) |
84.0 (28.3) |
T-Test; *P < 0.05; **P < 0.01.
References
- Annual Update of Key Results 2016/17: New Zealand Health Survey. Ministry of Health 2017.
- Elaine Rush, Stephanie McLennan, Victor Obolonkin, Alain C Vandal, Michael Hamlin et al. (2014) Project Energize: whole-region primary school nutrition and physical activity programme; evaluation of body size and fitness 5 years after the randomised controlled trial. Br J Nutr 111: 363-371. [Crossref]
- Rachael W Taylor, Kirsten A McAuley, Wyn Barbezat, Amber Strong, Sheila M Williams et al. (2007) APPLE Project: 2-y findings of a community-based obesity prevention program in primary school age children. Am J Clin Nutr 86: 735-742. [Crossref]
- Anthea Margaret Magarey, Tahna Lee Pettman, Annabelle Wilson, Nadia Mastersson (2013) Changes in Primary School Children's Behaviour, Knowledge, Attitudes, and Environments Related to Nutrition and Physical Activity. ISRN Obes 2013: 752081. [Crossref]
- Michael Prelip, Janni Kinsler, Chan Le Thai, Jennifer Toller Erausquin, Wendelin Slusser (2012) Evaluation of a school-based multicomponent nutrition education program to improve young children's fruit and vegetable consumption. J Nutr Educ Behav 44: 310-318. [Crossref]
- K Resnicow, M Davis Hearn, M Smith, T Baranowski, L S Lin et al. (1997) Social-cognitive predictors of fruit and vegetable intake in children. Health Psychol 16: 272-276. [Crossref]
- Kim D Reynolds, Agnes W Hinton, Richard M Shewchuk, Carol A Hickey (1999) Social Cognitive Model of Fruit and Vegetable Consumption in Elementary School Children. J Nutr Educ 31: 23-30.
- Jennifer Utter, Simon Denny, Ben Dyson (2016) School gardens and adolescent nutrition and BMI: Results from a national, multilevel study. Prev Med 83: 1-4. [Crossref]
- Don C Des Jarlais, Cynthia Lyles, Nicole Crepaz, TREND Group (2004) Improving the reporting quality of nonrandomized evaluations of behavioral and public health interventions: the TREND statement. Am J Public Health 94: 361-366. [Crossref]
- Anthea Magarey, Rebecca Golley, Nicola Spurrier, Emma Goodwin, Fangyi Ong (2009) Reliability and validity of the Children's Dietary Questionnaire; a new tool to measure children's dietary patterns. Int J Pediatr Obes 4: 257-265. [Crossref]