Journals
Effects of Red and Blue Light on the Cardiac Autonomic Nervous System
A B S T R A C T
Purpose: Light is an important environmental stimulus influencing everyday life. However, information about the impact of coloured light on the autonomic nervous system (ANS) is sparse. In general, red light (RL) is thought to act as an adrenergic trigger, while there is evidence that blue light (BL) induces parasympathetic activation. This is a pilot study to find out, if RL and/or BL affects heart rate variability (HRV).
Methods: Participants were randomly exposed first to neutral light (NL) and then to RL and BL for 120 minutes in a special light cabin. During each test run, HRV measurements were performed using both wrist training computers and Holter-ECGs. Furthermore, heart rate, arrhythmias and blood pressure were analysed. All parameters were measured during neutral and repeated during RL or BL in 10 supraventricular tachycardia patients, in 10 patients with heart failure and 10 athletes.
Results: During exposure to both RL and BL an increase of blood pressure, improvements of several HRV parameters, but no significant change of heart rate was observed. Neither RL nor BL influenced the occurrence of ectopic beats in Holter ECGs. The most prominent improvement of HRV was found in athletes, whereas increase in blood pressure were comparable between all three groups.
Conclusion: RL and BL influence the cardiac ANS. Since no differences were found between different light scenarios, the changes can not solely be attributed to the two-sided model of sympathetic and parasympathetic effects of ANS. However, RL and BL could potentially be used therapeutically to influence HRV in athletes.
Keywords
parasympathetic, cholinergic, adrenergic, heart rate variability, light therapy, blood pressure
Purpose
Light is a ubiquitous environmental stimulus and energy source for all species living on earth. Our organism reacts to diurnal and seasonal light fluctuations with complex mechanisms and elaborated adaptations, which developed during the evolution of human beings. Although we are mostly not able to perceive non-visual effects of light, the latter can indeed initiate a number of complex and so far only partially explored mechanisms [1-5]. Specifically, an effect of light on the autonomic nervous system (ANS) and cardiovascular system is evident and the biochemical signal transduction of light impulses in specific brain areas has recently been discovered: After entering via the retina and the retinohypothalamic tract, light impulses are mainly processed in the nucleus suprachiasmaticus (SCN), which is also considered as the “endogenous master pacemaker” [6]. This center subsequently triggers autonomic pathways, located in the hypothalamus, to regulate body-temperature, wake-sleep-rhythm, blood pressure, respiration, digestion, lipid metabolism, hydration, as well as body growth.
Additionally, direct neuronal pathways connecting the SCN with the epiphysis, pituitary gland, and other centers of adrenergic control are causal for subsequent reaction of the specific nervous system of the heart [7-11]. Via these mechanisms, specific cardiac reactions to light exposure, e.g. increase of heart rate and sympathetic cardiac tone, can be detected within seconds to minutes [11-13]. Light can trigger either activity or regeneration as an external impulse stimulus to the internal clock. For instance, bright light exposure can increase concentration and physical performance, reduce fatigue and the urge to sleep and thus acts as an activating stimulus [14]. These complex bio-psycho-behavioural reactions can be simplified as activating/adrenergic (“fight and flight reaction”) or relaxing/cholinergic (“rest and digest reaction”) and have been an evolutionary survival advantage. By contrast bright light during night in shift workers, can be a misleading circadian trigger, potentially resulting in a higher risk for developing diabetes, obesity, dyslipidemia, hypertension, but also ischaemic stroke and other cardiovascular diseases [12, 13, 15-20].
The effects of light are not exclusively explained by its intensity but may also depend on its spectrum. Prior studies have shown that the adrenergic system, as well as the serotonin metabolism can be activated by a full spectrum bright white light [8, 11]. Long wavelength (red) light also might trigger “fight and flight” sympathetic reactions, on the other hand, a short wavelength (blue) light seems to cause parasympathetic reactions and can induce regenerative effects, e.g. changes of leptin, insulin and human growth hormone as well as immune-modulations [12, 16, 21-23]. Thus, light plays a major role in influencing these activating and relaxing reactions mediated by the ANS.
Heart rate variability (HRV) describes fluctuations of RR-intervals in a specific time frame. HRV indices correlate with sympathetic and parasympathetic activity and have been used for evaluation of the ANS for decades [21]. Specifically, increased adrenergic reactions or a decreased cholinergic response result in reduced HRV. Only a small number of studies have been published describing the effect of light upon the ANS and the cardiovascular system [8, 10, 11, 13, 24]. The majority of the existing data carry methodical problems (e.g. uncontrolled intensity and spectrum, short exposure), since it is very difficult to expose test persons to light in a well-controlled environment [8, 10, 25]. For this purpose, a special light cabin was developed, and heart rate variability and rhythm effects of red and blue light were tested using a well-controlled setting to minimize and intraindividual variability.
In this pilot study we sought to test the hypothesis, that red and blue light exposure might cause relevant autonomic (HRV) or other cardiac (heart rate, blood pressure) effects. The experiments were carried out using parallel testing of HRV and hemodynamics in three subgroups, i.e. patients after ablation of supraventricular tachycardia (SVT), patients with congestive heart failure (CHF) and athletes. These groups were chosen because of known differences in their autonomic balance.
Methods
We initiated an explorative study with repeated measurements to analyse the effects of red light (RL) and blue light (BL) exposure in 10 participants after successful catheter ablation of supraventricular tachycardia (SVT), 10 patients with heart failure and ischaemic cardiomyopathy (CHF) and 10 aerobic athletes. The study was conducted in accordance with the “Declaration of Helsinki”, it was approved by the Institutional Review Board of the Medical University of Innsbruck and written informed consent was obtained from each patient at inclusion into the study.
I Characteristics of Study Subjects
Participants had to meet the following inclusion criteria: age between 20 and 80 years, male gender (to exclude hormonal influence upon measurements observed in women), no shift work within the last 3 months, no traveling through time zones during the last month, no acute infection and no sleeping disturbance. In the SVT group, patients with a history of successful ablation of AV nodal reentrant tachycardia (AVNRT) or Wolff-Parkinson-White (WPW) syndrome more than three months ago were recruited from our outpatient clinic. Structural heart disease had been excluded in this cohort by echocardiography and stress tests; trained athletes were not included in this group.
Inclusion criteria for the congestive heart failure (CHF) patients were known ischaemic cardiomyopathy with moderately or severely reduced left ventricular ejection fraction (measured by transthoracic echocardiography); absence of an acute cardiac event, such as acute coronary syndrome or hospitalization for heart failure during the last six months. All patients were tested on guideline directed heart failure and diuretic therapy due to ethical reasons. The athletes group comprised individuals without any known cardiovascular disease and a peak O2 above 50 ml/min/kg uptake during maximal cardiopulmonary exercise treadmill exercise test Demographics and medication of each cohort are given in (Table 1).
Table 1: Demographics and medication of enrolled study subjects.
|
|
SVT patients (n=10) |
CHF patients (n=10) |
Athletes (n=10) |
|
age (yrs) |
44,3±14,5 |
60,4±8,7 |
27,9±6,8 |
|
LVEF (%) |
61,2±4,7 |
35,6±13,2 |
58,4±6,0 |
|
peak VO2 (ml/min/kg) |
n.a. |
n.a. |
51,6±4,2 |
|
betablocker (n) |
0 |
10 |
0 |
|
RAAS-inhibitor (n) |
4 |
10 |
0 |
|
diuretic (n) |
1 |
5 |
0 |
|
statin (n) |
2 |
10 |
0 |
LVEF: left ventricular ejection fraction in transthoracic echocardiography calculated by Simpson’s rule, peak VO2: peak O2 uptake during maximal cardiopulmonary exercise treadmill exercise test; these values are given in mean ± SD; RAAS-inhibitors: Angiotensin-converting-enzyme-inhibitors or angiotensin-2 receptor blockers; for medication the number of subjects within a group on a specific drug is given (n).
II Study Protocol
Two participants were exposed at the same time first to NL (neutral light; 120 minutes) and thereafter randomly either to RL or BL (red light, blue light; 120 minutes) during morning hours after fasting for at least 2 hours in a specially designed light cabin (Figure 1). Subjects were asked to rest in a supine position during each light scenario and to look straight into the light source. Seven days later, participants were exposed to the same protocol with the other light scenario. During NL and coloured light exposure, strictly timed measurements were performed in exactly the same way (Figure 2). Specifically, Holter ECG and HRV-recordings as well as automatic blood pressure measurements were continuously recorded during NL, BL and RL. Furthermore, orthostasis and metronome respiration tests were performed at multiple time points.

Figure 1: Configuration of light cabins: The testing room with red and blue light scenarios is shown.
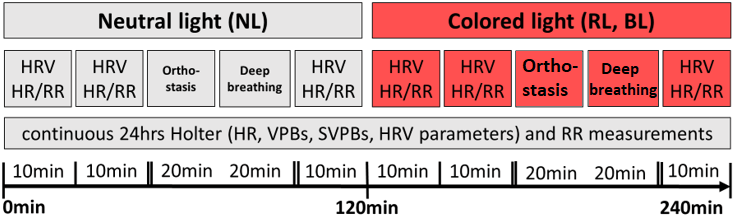
Figure 2: Sequence of test procedures during exposure to neutral and red/blue light.
HRV: heart rate variability; HR: heart rate; RR: blood pressure; VPBs: ventricular premature beats; SVPBs: supraventricular premature beats.
The light cabins (Figure 1) were developed by Bartenbach GmbH for experimental research projects to quantify specific light-effects on human beings. Optimal control of temperature (24°C ±2) and photometric parameters during light exposure were guaranteed by means of this light cabin. Irradiance, photon flux density, illumination at eye level, luminance within field of view, peak wavelength of the light sources as well as correlated colour temperature were constant during each light exposure and defined as follows: NL 0.194W/m2, 5.48*1017photons/(m2*s), 200lux, 55-85cd/m2, 4000 Kelvin, RL 0.970W/m2, 3.06*1018photons/(m2*s), 130lux, 100-160cd/m2, 621µm and BL 2.396W/m2, 5.57*1018photons/(m2*s), 65lux, 55-85cd/m2, 463µm.
III Measurements of Heart Rate (HR) and Heart Rate Variability (HRV), ECG Parameters
Short-term recordings (10 minutes) of HR and HRV were taken using a wrist training computer RS800CX® (Polar, Kempele, Finland). To calculate HRV parameters, Kubios RS800CX® software (Version 2.0, 2008, Biosignal Analysis and Medical Imaging Group) was used. Long term (24 hours) HRV and ECG parameters were analysed after continuously recording ECG data during light exposure and the night thereafter using the Getemed Cardiomem CM3000® Holter monitor using the Cardio Day® Version 2.2.0.3 Software. Classical HRV-parameters were calculated by the time domain method (RMSSD, SDNN, pNN50, SDSD), frequency domain method (LF/HF) and by the non-linear method (SD1) to quantify the impact of coloured light exposure on the ANS.
IV Orthostasis and Deep Breathing Testing
Orthostatic testing included 10 minutes of resting in a supine position and upright standing for another 10 minutes. Heart rate was recorded continuously, and blood pressure was taken every 60 seconds to calculate 30:15 ratios, a maximum decrease of blood pressure and increase of heart rate. During deep breathing, subjects had to slow down respiration to 6 times/minute for 5 minutes guided by a visual metronome. HRV parameters were recorded continuously and calculated during respiration testing using Kubios RS800CX® software (Version 2.0, 2008, Biosignal Analysis and Medical Imaging Group) as described above.
V Statistics
All statistical analyses were performed using SPSS 16.0 statistical software (Chicago, Illinois, USA). Results were expressed as mean values or as mean differences ± standard deviations (SD). After testing for normal distribution (Shapiro-Wilk-test, Kolmogorov-Smirnov-test) differences of mean values were tested for significance using different statistical methods (t-test, Mann-Whitney-test). For changes in short term analyses ANOVA for repeated measurements were performed. Since the age of the CHF group was higher than in all other subjects, a log reg model was used to compare the different groups. A p-value of less than 0,05 was considered statistically significant. All data were analysed anonymously.
Results
I Heart Rate, ECG Parameters and Hemodynamics
24 hours heart rate (HR) was lower in the CHF and athletes group compared to the SVT patients but was not found to be significantly different between both NL scenarios (data not shown). Furthermore, average HR was comparable between both light scenarios (min HR -0,8/min, mean HR +0,5/min, max HR +3,1/min RL vs. BL; p=n. s.) (Table 2). In short term measurements HR during NL was 66.9±24,0 bpm and decreased during RL to 59.1±10,9 bpm, whereas HR remained unchanged (61,7±9,9bpm vs. 59.8±10,6bpm) during BL (both p=n. s.). The effect of RL was short-lasting since HR showed a trend to decrease during the first minutes of RL (-7,8 bpm @ 10 minutes, -2,9 bpm @ 20min, -4,0 bpm @ 100min). This trend was not observed during BL (-1,9 bpm @ 10 minutes, +3,6 bpm @ 20min, +0,2 bpm @ 100min).
The number of ventricular and supraventricular premature beats per hour in 24 hours Holter recordings was not altered significantly during or after coloured light exposure (data not shown) and was not different between RL and BL (VPB +19,2/h, SVPB -2,8/h; p=n. s.). Mean arterial blood pressure (MAP) significantly increased after 10 minutes both RL and BL exposure (Table 2): MAP during NL was 98.1±10,1mmHg and increased to 101.6±8,6mmHg during RL (p=0.01) and the same trend was observed during BL (from 99.0±11,6mmHg during NL to 103.4±11,4mmHg during BL; p=0.01). Over time MAP did not change significantly after 20 minutes, but slightly increased after 120 minutes of exposure to RL and BL (data not shown; p=n.s.).
Table 2: Heart rate variability (HRV) measurements, heart rate and mean arterial blood pressure (MAP) after exposure to neutral, red or blue light.
|
|
|
neutral light (n=30) |
red light (n=30) |
p |
neutral light (n=30) |
blue light (n=30) |
p |
|
short-term HRV measurements (@ 10min exposure) |
SDNN (ms) |
74,6±38,5 |
109,0±58,0* |
0,001 |
76,4±46,0 |
98,2±53,9* |
0,001 |
|
RMSSD (ms) |
59,8±44,5 |
78,7±56,5* |
0,01 |
55,1±42,9 |
65,0±46,7 |
0,11 |
|
|
pNN50 (%) |
23,2±23,1 |
27,6±21,2 |
0,10 |
22,6±19,7 |
29,0±23,0* |
0,01 |
|
|
LF/HF |
2,7±3,0 |
3,0±2,9 |
0,84 |
1,9±1,7 |
3,8±7,3 |
0,20 |
|
|
SD 1 (ms) |
42,5±31,6 |
55,8±40,1* |
0,01 |
39,1±30,4 |
46,1±33,1 |
0,11 |
|
|
24hrs Holter HRV measurements |
SDNN (ms) |
110,3±45,2 |
127,4±55,2* |
0,001 |
118,0±45,8 |
138,1±59,8* |
0,001 |
|
RMSSD (ms) |
63,3±40,4 |
68,3±39,3* |
0,04 |
72,5±37,5 |
84,2±50,5* |
0,01 |
|
|
pNN50 (%) |
22,1±18,9 |
24,7±18,5* |
0,04 |
25,9±17,0 |
29,8±18,5* |
0,001 |
|
|
SDSD (ms) |
47,9±30,6 |
52,2±31,2* |
0,04 |
56,3±30,5 |
65,3±41,0* |
0,01 |
|
|
heart rate (bpm) |
66,9±24,0 |
59,1±10,9 |
0,10 |
61,7±9,9 |
59,8±10,6 |
0,30 |
|
|
MAP (mmHg) |
98,1±10,1 |
101,6±8,6* |
0,01 |
99,0±11,6 |
103,4±11,4* |
0,01 |
|
values are given as mean ± SD; SDNN: standard deviation of RR-intervals (ms); RMSSD: square root of mean squared difference of successive RR-intervals (ms); pNN50 percentage of heart beats over 50 ms from the baseline (%); LF/HF: ratio of low to high frequency RR-variation calculated by power spectral density analysis; SD1: standard deviation of the scatter away from the 45 degree line in the Pointcaré plot (ms); SDSD: standard deviation of the successive difference between adjacent R-R intervals (ms); MAP: mean arterial blood pressure; * p<0,05 vs. NL.
II Changes of HRV Parameters During Coloured Light Exposure
Mean values of HRV parameters (continuous Holter and short-term 5 minutes measurements at rest) under NL, RL and BL are given in (Table 2). Interestingly HRV-parameters increased during exposure to both light scenarios compared to NL and this effect was consistent for short-term and Holter-HRV-measurements. Specifically, significant changes were found for SDNN, RMSSD, SD1 (5 minutes measurement) and SDNN, RMSSD, pNN50, SDSD (24 hrs Holter measurement) under RL as well as RMSSD, pNN50 (5 minutes measurement) and SDNN, RMSSD, pNN50, SDSD (24 hrs Holter measurement) under BL. The quantity of increase was comparable for both coloured light scenarios (RL minus BL SDNN +10,0ms, pNN50 +1,5%, RMSSD 5,4ms, SDSD 5,2ms) (Figures 3A & 3B).
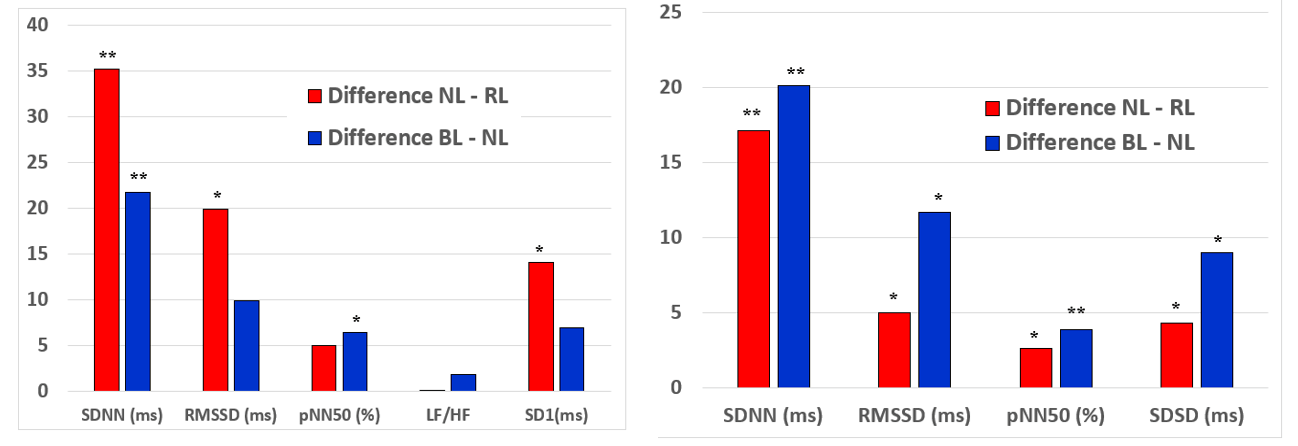
Figure 3: Changes (RL-NL and BL-NL) in HRV parameters during red and blue light: A) 5 min HRV short-term measurements, B) continuous HRV measurements during Holter recordings.
SDNN: standard deviation of RR-intervals; RMSSD: square root of mean squared difference of successive RR-intervals; SDSD: standard deviation of the successive difference between adjacent R-R intervals; LF/HF: ratio of low to high frequency RR-variation calculated by power spectral density analysis; SD1: standard deviation of the scatter away from the 45 degree line in the Pointcaré plot. * p<0,05 and ** p<0,005 vs. neutral light.
Over time measurements HRV (specifically SDNN) slightly increased after 20 minutes and decreased again after 120 minutes of RL (mean SDNN @10min 109,41ms, mean SDNN @20min 118,62ms, mean SDNN @120min 108,94ms) and BL exposure (mean SDNN @10min 97,10ms, mean SDNN @20min 104,06ms, mean SDNN @120min 89,27ms). Accordingly the effects of coloured light (difference RL minus NL and BL minus NL) on HRV decreased during 120min of exposure to RL (Δ SDNN @10min 35,20ms (p<0,01), Δ SDNN @20min 25,70ms (p=0,07), Δ SDNN @120min 18,20ms (p=0,02) and exposure to BL (Δ SDNN @10min 21,80ms (p<0,01), Δ SDNN @20min 25,70ms (p<0,01), Δ SDNN @120min 0,70ms (p=n.s.).
III Changes During Deep Breathing and Orthostasis
Coloured light exposure did not change HRV during deep breathing or orthostasis tests. Specifically, there were no differences of SDNN (RL -3,5ms, BL +6,8ms), RMSSD (RL -4,5ms, BL +6,5ms), pNN50 (RL +0,2%, BL +4,4%s), LF/HF (RL -1,1, BL -2,0), SD-1(RL -3,2ms, BL +4,6ms), E/I-quotient, E-I-difference during deep breathing (all n.s.). Furthermore max. HR change (-0,9 bpm; -6,8 bpm), 30:15 ratio (0,00; +0,01) or decrease of systolic (-0,93 mmHg; -2,20 mmHg) or diastolic BP (-0,07mmHg; +0,24mmHg) were not significantly changed by orthostatic maneuvers by RL and BL compared to NL (all n.s.).
IV Differences of HRV and Other Tested Parameters Between SVT, CHF Patients and Athletes
Compared to the CHF and SVT group, a more prominent increase of most short-term (SDNN, RMSSD, pNN50, SD1) and Holter-HRV-parameters (SDNN, RMSSD, pNN50, SDSD) in athletes could be observed during RL and BL (Table 3). Furthermore, athletes showed the most prominent increase in MAP during RL (SVT +3,23mmHg, CHF +2,15mmHg, athletes +5,90mmHg) and CHF patients showed the most prominent increase of MAP during BL (SVT +3,70mmHg, patients +6,60mmHg, athletes +3,00mmHg). Changes in absolute values in the different subgroups are shown in (Table 3).
Table 3: Differences in the effect of blue and red light on HRV measurements between SVT, heart failure (CHF) patients and athletes.
|
|
Effect of red light |
Effect of blue light |
|||||
|
SVT |
CHF |
athletes |
SVT |
CHF |
athletes |
||
|
short-term HRV measurements (@ 10min exposure) |
SDNN (ms) |
+31,2 |
+13,3 |
+59,0 * |
+11,8 |
+17,3 |
+36,3 * |
|
RMSSD (ms) |
+12,0 |
+16,7 |
+29,5 * |
+11,0 |
-4,1 |
+22,7 * |
|
|
pNN50 (%) |
+4,8 |
-0,1 |
+10,7 * |
+7,7 |
+3,2 |
+8,5 |
|
|
LF/HF |
-0,4 |
+0,6 |
+0,1 |
+4,9 * |
+0,6 |
-0,1 |
|
|
SD 1 (ms) |
+8,5 |
+11,9 |
+20,9 * |
+7,8 |
-0,1 |
+16,1 * |
|
|
24 hrs Holter HRV measurements |
SDNN (ms) |
+7,9 |
+6,6 |
+27,7 * |
+8,6 |
+8,5 |
+37,3 * |
|
RMSSD (ms) |
+4,0 |
+1,6 |
+6,6 |
+3,7 |
+6,3 |
+21,7 |
|
|
pNN50 (%) |
+2,4 |
+1,6 |
+2,3 |
+2,8 |
+2,3 |
+5,3 |
|
|
SDSD (ms) |
+2,9 |
+1,0 |
+6,7 |
+2,5 |
+5,4 |
+16,5 |
|
values are given as Δ mean (red light or blue light minus preceding neutral light); SDNN: standard deviation of RR-intervals (ms); RMSSD: square root of mean squared difference of successive RR-intervals (ms); pNN50 percentage of heart beats over 50 ms from the baseline (%); LF/HF: ratio of low to high frequency RR-variation calculated by power spectral density analysis; SD1: standard deviation of the scatter away from the 45 degree line in the Pointcaré plot (ms); SDSD: standard deviation of the successive difference between adjacent R-R intervals (ms); * p<0,05 for differences between groups.
Discussion
In this pilot-study, we found that red and blue light exposure acutely improves HRV in a well-controlled setting using a light cabin. Furthermore, both light scenarios transiently and slightly increased blood pressure; however, heart rate and the rate of ventricular or supraventricular premature beats remained unchanged. Interestingly, no differences between red and blue light exposure upon cardiac and autonomic effects were observed and RL and BL showed the most pronounced effects on HRV in trained athletes.
This is the first study showing that hemodynamics and the autonomic cardiac system can indeed be influenced by coloured light in a well-controlled setting. Specifically, the effects of red or blue light on HRV were consistent in different measurements and parameters, and the extent of changes of HRV parameters suggests a significant clinical effect especially in healthy individuals. The response of heart rate and HRV to coloured light has already been analysed in a couple of earlier studies: Litscher and colleagues found in a small cohort of healthy volunteers that blue, but not red light lead to decreased HRV [26]. Along the same lines Yuda et al. found significant increases in LF/HF ratio as an indicator of vagal outflow by blue, red and green light exposure within 6 min [27]. In both experimental settings light exposure was much shorter in duration and light panels were equipped with lower illuminescence. Since effects of blue light are dose-dependent, light intensity might have made a difference in the more pronounced light effects observed in the setting of the current study [27].
Furthermore, coloured light exposure was preceded by darkness (no light) in both earlier trials, therefore the physiological effects of coloured light cannot be distinguished from the one of neutral light. Finally, HRV indices were not specified in one study and frequency analyses (LF/HF) were the only HRV parameter in the second trial, whereas a number of different HRV parameters were analysed in our trial and we saw the most significant changes in time domain indices of HRV. The exact mechanism, by which the autonomic nervous system is influenced by coloured light, still needs to be explored. Assuming regulation through the retino-hypothalamic pathway, our results support the notion of a central nervous effect of light [6]. Specifically, our data suggest that red and blue, but not neutral light suppress vagal cardiac modulation through a melanopsin-dependent, non-image-forming effect. This mechanism is indicated by increased HRV parameters and an increased blood pressure as well as a trend towards decreased heart rate during blue and red-light exposure. The fact that athletes showed the most prominent impact of the light scenarios on HRV also supports the hypothesis proposed above.
Surprisingly, cardiac and HRV effects of red and blue light were similar. Furthermore, susceptibility to cholinergic (deep breathing) and adrenergic stimulation (orthostasis) did not change during light exposure in our study. While this observation goes in line with comparable results in previous studies, the simplified two-sided model of sympathetic and parasympathetic effects is not sufficient to explain solely cholinergic (increase of HRV, decrease of heart rate) and adrenergic effects (increase of blood pressure) of both red and blue light [28-30]. Our results may be explained by feedback mechanisms or a model of parallel and not exclusively parasympathetic/sympathetic activation in the ANS. Alternatively, multiple light effects may vary over time. Specifically, the diminished effect on HRV and blood pressure after 120 minutes of light exposure suggests a habituation reaction. We conclude that both red light and blue light might cause an immediate and transient effect on the autonomic nervous system, causing a predominantly cholinergic but also partially adrenergic reaction pattern, which could be potentially used therapeutically.
A potential therapeutic value of red or blue light may exist in certain individuals and specifically athletes, representing a population with vagal dominance in the resting state and pronounced adrenergic stimulation during exercise. It is well known that endurance training increases HRV by increasing parasympathetic tone with concomitant inhibition of sympathetic tone at rest [31, 32]. Furthermore, a decreased HRV is considered a marker of overtraining and exhaustion [33, 34]. Since exposure to both light scenarios improved HRV to a clinically significant extend in our study, training in a light cabin could be used as a therapeutic tool to potentially improve HRV and to subsequently amplify athletic performance. Yuda and colleagues reported that exposure to blue or orange light during a lunch break did not change HRV or psychomotor vigilance in university office workers [35]. However, these results in a small cohort cannot be generalized and athletes or individuals with other professions may respond differently. Similarly, increased heart rate as a consequence of SVT ablation has been attributed to impaired HRV following parasympathetic denervation and could also potentially be treated by light therapy [36]. Prospective interventional studies are currently planned at our center to test these hypotheses.
In the subset of heart failure patients, we found only a transient and slight reduction of heart rate as well as no apparent impact on HRV and specifically no antiarrhythmic effects. This group was included, because HRV has been used as a non-invasive risk indicator for arrhythmias and mortality for decades in patients with cardiomyopathy after myocardial infarction [21, 37, 38]. However, the utilization of HRV for risk-stratification has more or less disappeared and its value has been questioned in recent meta-analyses [39]. Our finding of the lack of differences in HRV between athletes and patients supports the limited value of HRV in this cohort, furthermore only a temporary effect of coloured light was found in patients with cardiovascular disease. The significantly smaller change of HRV parameters in heart failure patients may be attributed to a different responsiveness to light or varying diurnal rhythms in this older cohort. Moreover, it is possible that a more provocative light (e.g. brightness, exposure duration, oscillation) could have caused more relevant clinical effects. In summary, our results suggest that coloured light has only temporary and limited effects in this cohort.
Nevertheless, the interaction between coloured light exposure and the cardiac autonomic nervous system is demonstrated in our study and seems to be clinically relevant in specific cohorts. Thus, further research using coloured light in controlled settings needs to be initiated to shed light on mechanisms and potential therapeutic use of the described observations.
Limitations
A systematic masking factor (e.g. mental exhaustion during long and multiple testing procedures or placebo effect due to an attribution of specific effects of coloured light) cannot be completely excluded. Due to the small numbers of tested participants and the character of a pilot study, the discussion of our results must be speculative and is primarily meant hypothesis creating and should stimulate more research on this topic.
Acknowledgements
This study was supported by a grant from the Austrian Heart Foundation (Österreichischer Herzfonds). This article is designated to Prof. Dr. Otmar Pachinger, who sadly passed away during generation of the manuscript.
Conflicts of Interest
On behalf of S. Kohl, M. Schmitt, U. Bauer, A. Bauer, O. Pachinger and M. Stuehlinger the corresponding author states that there is no conflict of interest. M. Canazei and W. Pohl are employees of Bartenbach GmbH, who designed and provided the light chamber. It is ensured by the corresponding author that these co-authors did not influence data management or content of this manuscript.
Article Info
Article Type
Research ArticlePublication history
Received: Sat 04, Jul 2020Accepted: Thu 23, Jul 2020
Published: Wed 19, Aug 2020
Copyright
© 2023 Markus Stuehlinger. This is an open-access article distributed under the terms of the Creative Commons Attribution License, which permits unrestricted use, distribution, and reproduction in any medium, provided the original author and source are credited. Hosting by Science Repository.DOI: 10.31487/j.JICOA.2020.04.06
Author Info
Corresponding Author
Markus StuehlingerUniversity Clinic of Internal Medicine III, Cardiology and Angiology, Medical University of Innsbruck, Innsbruck, Austria
Figures & Tables
Table 1: Demographics and medication of enrolled study subjects.
|
|
SVT patients (n=10) |
CHF patients (n=10) |
Athletes (n=10) |
|
age (yrs) |
44,3±14,5 |
60,4±8,7 |
27,9±6,8 |
|
LVEF (%) |
61,2±4,7 |
35,6±13,2 |
58,4±6,0 |
|
peak VO2 (ml/min/kg) |
n.a. |
n.a. |
51,6±4,2 |
|
betablocker (n) |
0 |
10 |
0 |
|
RAAS-inhibitor (n) |
4 |
10 |
0 |
|
diuretic (n) |
1 |
5 |
0 |
|
statin (n) |
2 |
10 |
0 |
LVEF: left ventricular ejection fraction in transthoracic echocardiography calculated by Simpson’s rule, peak VO2: peak O2 uptake during maximal cardiopulmonary exercise treadmill exercise test; these values are given in mean ± SD; RAAS-inhibitors: Angiotensin-converting-enzyme-inhibitors or angiotensin-2 receptor blockers; for medication the number of subjects within a group on a specific drug is given (n).
Table 2: Heart rate variability (HRV) measurements, heart rate and mean arterial blood pressure (MAP) after exposure to neutral, red or blue light.
|
|
|
neutral light (n=30) |
red light (n=30) |
p |
neutral light (n=30) |
blue light (n=30) |
p |
|
short-term HRV measurements (@ 10min exposure) |
SDNN (ms) |
74,6±38,5 |
109,0±58,0* |
0,001 |
76,4±46,0 |
98,2±53,9* |
0,001 |
|
RMSSD (ms) |
59,8±44,5 |
78,7±56,5* |
0,01 |
55,1±42,9 |
65,0±46,7 |
0,11 |
|
|
pNN50 (%) |
23,2±23,1 |
27,6±21,2 |
0,10 |
22,6±19,7 |
29,0±23,0* |
0,01 |
|
|
LF/HF |
2,7±3,0 |
3,0±2,9 |
0,84 |
1,9±1,7 |
3,8±7,3 |
0,20 |
|
|
SD 1 (ms) |
42,5±31,6 |
55,8±40,1* |
0,01 |
39,1±30,4 |
46,1±33,1 |
0,11 |
|
|
24hrs Holter HRV measurements |
SDNN (ms) |
110,3±45,2 |
127,4±55,2* |
0,001 |
118,0±45,8 |
138,1±59,8* |
0,001 |
|
RMSSD (ms) |
63,3±40,4 |
68,3±39,3* |
0,04 |
72,5±37,5 |
84,2±50,5* |
0,01 |
|
|
pNN50 (%) |
22,1±18,9 |
24,7±18,5* |
0,04 |
25,9±17,0 |
29,8±18,5* |
0,001 |
|
|
SDSD (ms) |
47,9±30,6 |
52,2±31,2* |
0,04 |
56,3±30,5 |
65,3±41,0* |
0,01 |
|
|
heart rate (bpm) |
66,9±24,0 |
59,1±10,9 |
0,10 |
61,7±9,9 |
59,8±10,6 |
0,30 |
|
|
MAP (mmHg) |
98,1±10,1 |
101,6±8,6* |
0,01 |
99,0±11,6 |
103,4±11,4* |
0,01 |
|
values are given as mean ± SD; SDNN: standard deviation of RR-intervals (ms); RMSSD: square root of mean squared difference of successive RR-intervals (ms); pNN50 percentage of heart beats over 50 ms from the baseline (%); LF/HF: ratio of low to high frequency RR-variation calculated by power spectral density analysis; SD1: standard deviation of the scatter away from the 45 degree line in the Pointcaré plot (ms); SDSD: standard deviation of the successive difference between adjacent R-R intervals (ms); MAP: mean arterial blood pressure; * p<0,05 vs. NL.
Table 3: Differences in the effect of blue and red light on HRV measurements between SVT, heart failure (CHF) patients and athletes.
|
|
Effect of red light |
Effect of blue light |
|||||
|
SVT |
CHF |
athletes |
SVT |
CHF |
athletes |
||
|
short-term HRV measurements (@ 10min exposure) |
SDNN (ms) |
+31,2 |
+13,3 |
+59,0 * |
+11,8 |
+17,3 |
+36,3 * |
|
RMSSD (ms) |
+12,0 |
+16,7 |
+29,5 * |
+11,0 |
-4,1 |
+22,7 * |
|
|
pNN50 (%) |
+4,8 |
-0,1 |
+10,7 * |
+7,7 |
+3,2 |
+8,5 |
|
|
LF/HF |
-0,4 |
+0,6 |
+0,1 |
+4,9 * |
+0,6 |
-0,1 |
|
|
SD 1 (ms) |
+8,5 |
+11,9 |
+20,9 * |
+7,8 |
-0,1 |
+16,1 * |
|
|
24 hrs Holter HRV measurements |
SDNN (ms) |
+7,9 |
+6,6 |
+27,7 * |
+8,6 |
+8,5 |
+37,3 * |
|
RMSSD (ms) |
+4,0 |
+1,6 |
+6,6 |
+3,7 |
+6,3 |
+21,7 |
|
|
pNN50 (%) |
+2,4 |
+1,6 |
+2,3 |
+2,8 |
+2,3 |
+5,3 |
|
|
SDSD (ms) |
+2,9 |
+1,0 |
+6,7 |
+2,5 |
+5,4 |
+16,5 |
|
values are given as Δ mean (red light or blue light minus preceding neutral light); SDNN: standard deviation of RR-intervals (ms); RMSSD: square root of mean squared difference of successive RR-intervals (ms); pNN50 percentage of heart beats over 50 ms from the baseline (%); LF/HF: ratio of low to high frequency RR-variation calculated by power spectral density analysis; SD1: standard deviation of the scatter away from the 45 degree line in the Pointcaré plot (ms); SDSD: standard deviation of the successive difference between adjacent R-R intervals (ms); * p<0,05 for differences between groups.
HRV: heart rate variability; HR: heart rate; RR: blood pressure; VPBs: ventricular premature beats; SVPBs: supraventricular premature beats.
SDNN: standard deviation of RR-intervals; RMSSD: square root of mean squared difference of successive RR-intervals; SDSD: standard deviation of the successive difference between adjacent R-R intervals; LF/HF: ratio of low to high frequency RR-variation calculated by power spectral density analysis; SD1: standard deviation of the scatter away from the 45 degree line in the Pointcaré plot. * p<0,05 and ** p<0,005 vs. neutral light.
References
- Badia P, Myers B, Boecker M, Culpepper J, Harsh JR (1991) Bright light effects on body temperature, alertness, EEG and behavior. Physiol Behav 50: 583-588. [Crossref]
- Chang A, Santhi N, St Hilaire M, Gronfier C, Bradstreet DS et al. (2012) Human responses to bright light of different durations. J Physiol 590: 3103-3112. [Crossref]
- Czeisler CA, Allan JS, Strogatz SH, Ronda JM, Sanchez R et al. (1986) Bright light resets the human circadian pacemaker independent of the timing of the sleep-wake cycle. Science 233: 667-671. [Crossref]
- Khalsa SB, Jewett ME, Cajochen C, Czeisler CA (2003) A phase response curve to single bright light pulses in human subjects. J Physiol 549: 945-952. [Crossref]
- Van Cauter E, Sturis J, Byrne MM, Blackman JD, Leproult R et al. (1994) Demonstration of rapid light-induced advances and delays of the human circadian clock using hormonal phase markers. Am J Physiol 266: E953-E963. [Crossref]
- Kalsbeek A, Fliers E, Hofman MA, Swaab DF, Buijs RM (2010) Vasopressin and the output of the hypothalamic biological clock. J Neuroendocrinol 22: 362-372. [Crossref]
- Arendt J (1988) Melatonin. Clin Endocrinol (Oxf) 29: 205-229. [Crossref]
- Jung CM, Khalsa SB, Scheer FA, Cajochen C, Lockley SW et al. (2010) Acute effects of bright light exposure on cortisol levels. J Biol Rhythms 25: 208-216. [Crossref]
- Buijs RM, Wortel J, Van Heerikhuize JJ, Feenstra MG, Ter Horst GJ et al. (1999) Anatomical and functional demonstration of a multisynaptic suprachiasmatic nucleus adrenal (cortex) pathway. Eur J Neurosci 11: 1535-1544. [Crossref]
- Scheer FA, Kalsbeek A, Buijs RM (2003) Cardiovascular control by the suprachiasmatic nucleus: neural and neuroendocrine mechanisms in human and rat. Biol Chem 384: 697-709. [Crossref]
- Scheer FA, Van Doornen LJ, Buijs RM (2004) Light and diurnal cycle affect autonomic cardiac balance in human; possible role for the biological clock. Auton Neurosci 110: 44-48. [Crossref]
- Ruger M, Scheer FA (2009) Effects of circadian disruption on the cardiometabolic system. Rev Endocr Metab Disord 10: 245-260. [Crossref]
- Scheer FA, Hilton MF, Mantzoros CS, Shea SA (2009) Adverse metabolic and cardiovascular consequences of circadian misalignment. Proc Natl Acad Sci U S A 106: 4453-4458. [Crossref]
- Lockley SW, Evans EE, Scheer FA, Brainard GC, Czeisler CA et al. (2006) Short-wavelength sensitivity for the direct effects of light on alertness, vigilance, and the waking electroencephalogram in humans. Sleep 29: 161-168. [Crossref]
- Chalernvanichakorn T, Sithisarankul P, Hiransuthikul N (2008) Shift work and type 2 diabetic patients' health. J Med Assoc Thai 91: 1093-1096. [Crossref]
- Nagaya T, Yoshida H, Takahashi H, Kawai M (2002) Markers of insulin resistance in day and shift workers aged 30-59 years. Int Arch Occup Environ Health 75: 562-568. [Crossref]
- Shimba S, Ishii N, Ohta Y, Ohno T, Watabe Y et al. (2005) Brain and muscle Arnt-like protein-1 (BMAL1), a component of the molecular clock, regulates adipogenesis. Proc Natl Acad Sci U S A 102: 12071-12076. [Crossref]
- Karlsson B, Knutsson A, Lindahl B (2001) Is there an association between shift work and having a metabolic syndrome? Results from a population based study of 27,485 people. Occup Environ Med 58: 747-752. [Crossref]
- Brown DL, Feskanich D, Sanchez BN, Rexrode KM, Schernhammer ES et al. (2009) Rotating night shift work and the risk of ischemic stroke. Am J Epidemiol 169: 1370-1377. [Crossref]
- LaDou J (1982) Health effects of shift work. West J Med 137: 525-530. [Crossref]
- Malik M, Camm AJ (1990) Heart rate variability. Clin Cardiol 13: 570-576. [Crossref]
- Hoffmann G, Gufler V, Griesmacher A, Bartenbach C, Canazei M et al. (2008) Effects of variable lighting intensities and colour temperatures on sulphatoxymelatonin and subjective mood in an experimental office workplace. Appl Ergon 39: 719-728. [Crossref]
- Shea SA, Hilton MF, Orlova C, Ayers RT, Mantzoros CS (2005) Independent circadian and sleep/wake regulation of adipokines and glucose in humans. J Clin Endocrinol Metab 90: 2537-2544. [Crossref]
- Wright KP Jr, Badia P, Myers BL, Plenzler SC (1997) Combination of bright light and caffeine as a countermeasure for impaired alertness and performance during extended sleep deprivation. J Sleep Res 6: 26-35. [Crossref]
- Bonetti PO, Pumper GM, Higano ST, Holmes DR Jr, Kuvin JT et al. (2004) Noninvasive identification of patients with early coronary atherosclerosis by assessment of digital reactive hyperemia. J Am Coll Cardiol 44: 2137-2141. [Crossref]
- Litscher D, Wang L, Gaischek I, Litscher G (2013) The influence of new colored light stimulation methods on heart rate variability, temperature, and well-being: results of a pilot study in humans. Evid Based Complement Alternat Med 2013: 674183. [Crossref]
- Yuda E, Ogasawara H, Yoshida Y, Hayano J (2016) Suppression of vagal cardiac modulation by blue light in healthy subjects. J Physiol Anthropol 35: 24. [Crossref]
- Choi C, Kim K, Kim C, Kim S, Choi W (2011) Reactivity of heart rate variability after exposure to colored lights in healthy adults with symptoms of anxiety and depression. Int J Psychophysiol 79: 83-88. [Crossref]
- Grote V, Kelz C, Goswami N, Stossier H, Tafeit E et al. (2013) Cardio-autonomic control and wellbeing due to oscillating color light exposure. Physiol Behav 114-115: 55-64. [Crossref]
- Schafer A, Kratky KW (2006) The effect of colored illumination on heart rate variability. Forsch Komplementmed 13: 167-173. [Crossref]
- Prinsloo GE, Rauch HG, Derman WE (2014) A brief review and clinical application of heart rate variability biofeedback in sports, exercise, and rehabilitation medicine. Phys Sportsmed 42: 88-99. [Crossref]
- Abad CC, do Nascimento AM, Gil S, Kobal R, Loturco I et al. (2014) Cardiac autonomic control in high level Brazilian power and endurance track-and-field athletes. Int J Sports Med 35: 772-778. [Crossref]
- Baumert M, Brechtel L, Lock J, Hermsdorf M, Wolff R et al. (2006) Heart rate variability, blood pressure variability, and baroreflex sensitivity in overtrained athletes. Clin J Sport Med 16: 412-417. [Crossref]
- Hottenrott K, Hoos O, Esperer HD (2006) Heart rate variability and physical exercise. Current status. Herz 31: 544-552. [Crossref]
- Yuda E, Ogasawara H, Yoshida Y, Hayano J (2017) Exposure to blue light during lunch break: effects on autonomic arousal and behavioral alertness. J Physiol Anthropol 36: 30. [Crossref]
- Kocovic DZ, Harada T, Shea JB, Soroff D, Friedman PL (1993) Alterations of heart rate and of heart rate variability after radiofrequency catheter ablation of supraventricular tachycardia. Delineation of parasympathetic pathways in the human heart. Circulation 88: 1671-1681. [Crossref]
- Fukuda K, Kanazawa H, Aizawa Y, Ardell JL, Shivkumar K (2015) Cardiac innervation and sudden cardiac death. Circ Res 116: 2005-2019. [Crossref]
- Shen MJ, Zipes DP (2014) Role of the autonomic nervous system in modulating cardiac arrhythmias. Circ Res 114: 1004-1021. [Crossref]
- Wu L, Jiang Z, Li C, Shu M (2014) Prediction of heart rate variability on cardiac sudden death in heart failure patients: a systematic review. Int J Cardiol 174: 857-860. [Crossref]