Dietary Salvia hispanica L. Seed Counteracted Kidney Failure in Experimental Metabolic Syndrome
A B S T R A C T
Metabolic Syndrome (MS) has become a major health hazard in the current world by triggering cardiovascular and renal pathologies. Chia seed is a rich source of bioactive food components (n-3 fatty acids, antioxidants and fiber, among others) with several benefits on cardiovascular health. Therefore, we hypothesized that the intake of chia seed could counteract kidney failure of MS by protecting against lipid accretion, oxidative stress and fibrosis in this tissue. An experimental model of MS was induced by feeding male Wistar rats for 3 months with a sucrose-rich diet (SRD) containing corn oil as a source of fat. During the next 3 months, half of the animals continued with SRD. The other half received the SRD in which corn oil was replaced by Salvia hispanica L. seeds (chia) (SRD+C). The control group received a reference diet (RD). In experimental MS, dietary administration of chia seed significantly decreased albumin and glucose urine levels (p<0.05). Chia reverted fibrosis (SiriusRed-collagen staining), morphological anomalies and the altered markers (PEPCK and FBPase) of renal glucose metabolism (p<0.05). These effects were accompanied by a decrease in the accumulation of triglycerides and oxidative stress biomarkers (ROS and lipid peroxides) in kidney (p<0.05). The mechanisms included down-regulation of key enzymes of fatty acid biosynthesis (ACC, FAS and G6PDH) and up-regulation of antioxidant defenses (GSH, GR and GPx activities). Dietary chia seed counteracted renal failure in an experimental model of MS, indicating that it could be an exceptional food for the clinical management of this disorder.
Keywords
Metabolic syndrome, kidney failure, Salvia hispanica L., alpha-Linolenic acid, hypertension, lipotoxicity
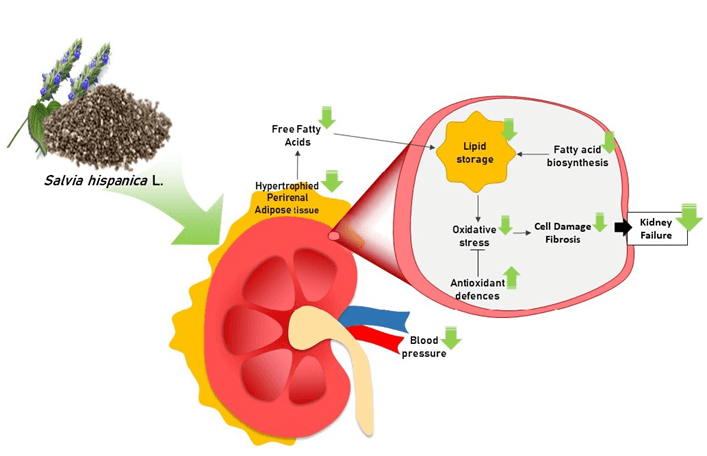
Graphical Abstract
Introduction
Metabolic Syndrome (MS) – a pathologic condition that includes dyslipidemia, insulin resistance, increased visceral adiposity, and hypertension– has become a major health hazard in the current world [1]. Its prevalence has seriously boosted around the world, affecting about 30% of people, triggering premature deaths due to non-communicable diseases and getting worse infectious disease outcomes as the ongoing severe acute respiratory syndrome coronavirus 2 (SARS-CoV-2) [2, 3].
The etiopathogenesis of MS comprises deep alterations of the main tissues involved in glucose and lipid metabolism as liver, muscle, pancreas, adipose and the complex crosstalk between them [4]. The kidneys have recently been postulated as key players in MS physiopathology as an abnormal renal process that can be key early events of chronic kidney disease, hypertension, cardiovascular diseases, and diabetic nephropathy [5]. Supporting this idea, observational studies reported that MS and its components are risk factors for kidney failure [6-8]. Even more, evidence demonstrates a positive correlation between the components of MS and the rate of renal injury [9].
The current rise of MS prevalence responds to changes in lifestyle habits of western societies over the last decades. Among dietary patterns stand out the high intake of saturated fat and simple sugar (fructose/sucrose) and the low eating of fiber and n-3 polyunsaturated fatty acids (PUFAs). Hence, the challenge is to recognize healthy foods for better clinical management of MS. In this regard, Chung et al. have observed a strong association between high concentrations of 20:5 n-3 (eicosapentaenoic acid, EPA) and 22:6 n-3 (docosahexaenoic acid, DHA) or higher n-3/n-6 FA ratio in plasma, with lesser renal function decline in type 2 diabetic patients [10]. In a randomized controlled trial, dietary supplementation with flaxseed oil –rich in 18:3 n-3 α-Linolenic acid (ALA)– decreased C-reactive protein levels in chronic hemodialysis patients [11]. Accordingly, it has been reported some effects of ALA in genetic and surgical models of kidney disease. Dietary ALA-rich flax oil reduced renal injury in a mouse model of polycystic kidney disease and renal disease in the CD1-pcy/pcy mouse model of nephronophthisis [12, 13].
Salvia hispanica L. seed –a Native American plant used by Pre-Colombian populations as nutritional food– is commonly known as chia seed and it is one of the main vegetable sources of ALA (above 60% of total fatty acids is ALA). Besides, it contains considerable amounts of polyphenols (such as caffeic and chlorogenic acids) and flavonoids (quercetin, myricetin, among others) with high antioxidant activity, and soluble fiber what make it an exceptional food [14, 15]. Thus, it was hypothesized that the intake of chia seed could counteracts kidney failure of MS by protecting against lipid accretion, oxidative stress and fibrosis in this tissue. For testing this hypothesis, a relevant experimental model of MS was induced by feeding rats with a sucrose-rich diet (SRD) for 3 months [16, 17]. For additional 3 months, rats received the SRD containing corn oil –rich in 18:2 n-6 linoleic acid (LA)– or chia seed –rich in n-3 ALA– as a source of fat. Specifically, it was analyzed the effects of chia on the renal failure induced by SRD analyzing its possible anti-lipogenic and antioxidant effects.
Methods and Materials
I Animals
Male Wistar rats were purchased from the Faculty of Pharmacy and Biochemistry, University of Buenos Aires (Buenos Aires, Argentine) and were housed under controlled temperature (22±1°C), light-dark cycle (7:00-19:00 h), airflow, and humidity conditions. All animal procedures met National Institutes of Health Guide for the Care and Use of Laboratory animals (NIH Publications No. 8023, revised 1978) and were approved by the Ethics Committee of the Faculty of Biochemistry and Biological Sciences, National University of Litoral, Santa Fe, Argentina (registration number CE2020-54-C).
II Experimental Design
Rats were initially fed a standard powdered rodent commercial diet (15,3 kJ/g of energy, GEPSA FEED, Buenos Aires, Argentina). At 8 weeks of age (180-190 g) were randomly divided into 3 groups. An experimental group (n=12) received a sucrose-rich diet (SRD) containing corn oil as fat (n-3/n-6 ratio: 0.014) during 6 months. The other experimental group (n=12) received the SRD for 3 months. After that, this group was fed with an SRD containing chia seed as fat (n-3/n-6 ratio: 3.48) for the next 3 months (SRD+C).
Diets were based on the AIN-93 M diet and were isoenergetic (16,3 kJ/g) (% energy): 60.0 carbohydrates, 23.0 fat and 17.0 protein [18]. Composition of diets (% w/w) is detailed in (Table 1). The content of macronutrients and fiber in the SRD and SRD+C were similar by balancing the amount of these nutrients in SRD+C according to chia seed composition (g/100 g seed): carbohydrates 37.45; insoluble fiber 81% of total carbohydrate; fat 30.23; protein 21.19. Chia seed (Salvia hispanica L., Salba variety) was provided by ALPA TRADE (Buenos Aires, Argentina) and its detailed composition was previously shown [19-21]. The reference group (n=12) intake a standard diet (GEPSA FEED, Buenos Aires, Argentina) for 6 months (reference diet, RD). Composition (g/100 g diet): carbohydrates (corn, sorghum, wheat, oats, barley) 42.0; protein 24.0; fat 6.0; fiber 7.0; minerals and vitamins 8.0; water 13.0. Throughout the experimental period, diet and water were administered ad libitum. The body weight, dairy energy intake, water intake, and diuresis (urine for 24 hours) of each animal were recorded twice a week.
Table 1: Composition of experimental diets. SRD: Sucrose-rich
diet. SRD+C: SRD plus chia seed.
|
Diet ingredients |
SRD |
SRD+C |
|
|
% w/w |
|
|
Corn starch |
2.5 |
- |
|
Sucrose |
55.5 |
55.5 |
|
Casein |
16.5 |
7.4 |
|
Corn oil |
10.5 |
1.0 |
|
Chia seed |
- |
36.2 |
|
Cellulose |
10.0 |
1.0 |
|
Methionine |
0.3 |
0.3 |
|
Choline |
0.2 |
0.2 |
|
Mineral Mix |
3.5 |
3.5 |
|
Vitamin Mix |
1.0 |
1.0 |
III Blood Pressure Measurement
Blood pressure was assessed once a week throughout the experimental period in conscious animals using a non-invasive tail-cuff method as was previously described [22].
IV Blood and Urine Sampling and Tissue Collection
Urine samples were collected using metabolic cages and were immediately assayed or stored at -80°C. At the end of the experimental period, rats were anaesthetized with sodium pentobarbital (60 mg/kg body weight) and were subjected to abdominal surgery. Blood samples were collected from the inferior cava vein and immediately centrifuged at 1,000 g for 15 min at 4 ºC. Serum samples were stored at -80°C. Perirenal adipose tissue (PRAT) and kidneys were removed and weighed. For biochemical assessment, tissues were stored at -80°C. For histochemical analysis, tissue was fixed in 10% neutral buffered formalin at 4 °C for 24 h, then dehydrated and embedded in paraffin wax.
V Biochemical Assays in Blood and Urine
Serum levels of glucose, triglycerides (TG) and free fatty acids (FFA) were quantified by enzymatic assays [22]. Creatinine levels in urine and blood were measured by the spectrophotometric method of picric acid using a commercial kit (Wiener Lab, Rosario, Argentina) following the manufacturer’s instructions. Glucose levels in urine and blood were quantified by a commercial enzymatic kit (Wiener Lab, Rosario, Argentina). Albuminuria was assessed by an immunoturbidimetric method and albumin concentration was calculated using a calibration curve of albumin according to the protocol provided by the manufacturer (Wiener Lab, Rosario, Argentina).
VI Determination of Triglycerides and Glycogen Content
TG content in renal tissue was quantified according to the procedure described by Scerbo et al. [23]. Briefly, total lipids were extracted from tissue and TG were determined by an enzymatic coupled assay [24]. The absorbance of the reaction product was measured at 505 nm and TG concentration was calculated using a standard solution of trioleate.
Glycogen content in renal tissue was quantified by hydrolysis with 2N HCl following the measurement of glucose concentration by an enzymatic assay, as was previously reported [25]. The absorbance of the reaction product was measured at 505 nm and glycogen concentration (μmoles glucose units/g tissue) was calculated using a standard solution of glucose.
VII Analysis of Enzyme Activities
Renal tissue was homogenized in a buffer containing 0,25 M sucrose, 1 mM DTT, and 1 mM EDTA, and centrifuged at 13,000 g and 4°C for 30 min and the supernatant was used to perform the enzymatic assays. Total protein content was determined using Bradford's reagent (Bio-Rad Laboratories Inc., California, USA). The activity of acetyl-CoA carboxylase (ACC), fatty-acyl-CoA synthase system (FAS) and glucose-6-phosphate dehydrogenase (G6PD) was measured according to spectrophotometric methods previously described in detail [25].
The activity of fructose-bisphosphatase (FBPase) and phosphoenolpyruvate carboxykinase (PEPCK) was measured by coupled enzyme assays, according to Bertinat et al. [26]. Changes in the absorbance at 340 nm due to the reduction or oxidation of NAD, respectively, were measured. One unit of FBPase or PEPCK activity was defined as the amount of enzyme that catalyzes the formation of 1 μmole of product per minute.
Glucose-6-phosphatase (G6Pase) activity was assayed according to the method described by Hein et al. [27]. Briefly, the tissue homogenate was incubated with glucose-6-phosphate 80 mM at 37°C. The reaction was stopped with 10 % p/v trichloroacetic acid. The amount of inorganic phosphate formed showed the rate of reaction. It was detected by its reaction with 2 mM ammonium molybdate and reducing agent (40 mM 1-amino-2-naphthol-4 sulfonic acid). The amount of the final product was calculated based on its absorbance at 700 nm and a standard solution of inorganic phosphate. One unit of G6Pase activity was defined as the amount of enzyme that catalyzes the formation of 1 μmoles of product per minute. Enzymatic assays of antioxidant enzymes glutathione peroxidase (GPx) and glutathione-disulfide reductase (GR) were performed by spectrophotometric methods earlier described [22, 28].
VIII Measurement of Oxidative Stress Biomarkers
ROS level in renal tissue was assessed by a fluorometric method [29]. Briefly, tissue samples were homogenized in saline phosphate buffer (pH 7,4) and centrifuged at 2,500 g and 4°C for 15 min. The isolated supernatants were incubated with dichlorodihydrofluorescein diacetate (DCFH2DA) for 30 min at 37°C. Fluorescence intensity was normalized by protein concentration of cellular extracts (fluorescence intensity/mg protein), and results are expressed relative to the RD group.
Thiobarbituric acid reactive substance (TBARS) content in renal tissue was quantified as an estimation of lipid peroxidation, following the spectrophotometric method described elsewhere [22, 28].
Reduced glutathione (GSH) content was determined according to Samarghandian et al. [29]. Tissue homogenate was processed by the addition of precipitating reagent (meta-phosphoric acid 3.34 % p/v, EDTA 0.4 % p/v and 60 % p/v sodium chloride) and centrifuged. Supernatant was incubated with phosphate solution (0.3 M disodium hydrogen phosphate) and 5-5’-dithiobis-(2-nitrobenzoic acid) (DTNB) (Ellman’s reagent). The absorbance of the yellow product was measured at 412 nm. GSH concentration (nmol/mg protein) was calculated using a standard curve of GSH.
IX Assessment of Fibrosis
Hydroxyproline content in renal tissue was measured as an estimation of total collagen [30]. Briefly, tissue was hydrolyzed with 6 N HCl at 120°C for 24 hrs. The resultant hydrolysate was subject to a colorimetric reaction with p-dimethylaminobenzaldehyde. The intensity of the coloured product was measured at 540 nm. The amount of hydroxyproline was calculated using a standard curve of hydroxyproline.
For histological examination of samples, paraffin sections (5 µm) were cut and stained with Haematoxylin and Eosin (H&E) or Sirius Red (Direct Red 80, Sigma-Aldrich, Argentina) in picric acid solution (picrosirius) counterstained with Harris haematoxylin. The kidney structure and collagen organization were evaluated using Olympus BH2 light microscopy (Olympus Optical Co., Ltd., Japan) and images were recorded with a Spot Insight V3.5 colour video camera attached. The collagen birefringence of picrosirius-stained kidney samples was quantified by polarization microscopy. At least 10 fields per section of each animal were assessed. The area occupied by organized collagen was measured as integrated optical density by using Image Pro-Plus 4.1.0.1® system (Media Cybernetics, Silver Spring, USA). The results are expressed as a percentage of collagen.
X Statistical Analyses
Sample sizes were calculated on the basis of measurements previously made with rats fed either a control diet or a SRD considering an 80% power [31]. Results are expressed as mean values with their standard errors. The statistical differences between RD, SRD, and SRD+C were determined by ANOVA following Turkey’s test. Differences having P values lower than 0.05 were considered statistically significant (SPSS 17.0 for Windows, SPSS INC. Chicago, Illinois). All reported P values were 2-sided.
Results
I Effects of Dietary Chia Seed upon General Features of SRD-Fed Rats
Experimental MS induced by chronic administration of SRD for 6 months to normal rats is characterized by middle hyperglycemia, dyslipidemia, insulin resistance and hypertension. Table 2 provides an overview of the metabolic features of experimental groups. Chia administration in SRD in the last 3 months normalized plasma levels of glucose, TG and FFA in accordance with early reports [28, 30].
Table 2: Effects of chia seed upon general features of SRD-fed
rats.
|
Parameter |
RD |
SRD |
SRD+C |
|
Final
Body weight (g) |
484.1
± 7.3b |
542.5
± 16.2a |
525.7
± 6.1a |
|
Energy
intake (kJ/24 h) |
265.3
± 7.8b |
347.2
± 4.1a |
334.5
± 22.1a |
|
Relative
weight of right kidney (g/100
g body weight) |
0.333
± 0.011 |
0.307
± 0.100 |
0.300
± 0.005 |
|
Relative
weight of PRAT (g/100
g body weight) |
0.88 ± 0.09b |
1.40 ± 0.09a |
0.99 ± 0.13b |
|
Plasma
glucose (mM) |
6.61 ± 0.13b |
9.15 ± 0.49a |
7.15 ± 0.24b |
|
Plasma
triglyceride (mM) |
1.19 ± 0.10b |
2.83 ± 0.19a |
1.20 ± 0.11b |
|
Plasma
FFA (μM) |
312.7 ± 9.1 b |
773.8 ± 28.5 a |
361.2 ± 24.3 b |
Data are expressed as mean ± SEM (n=6).
Values that do not share the same superscript lowercase letter are
significantly different by comparison using one-way ANOVA with Tukey's post hoc
test.
RD:
Reference Diet; SRD: Sucrose-Rich Diet; SRD+C: SRD Plus Chia seed; PRAT:
Perirenal Adipose Tissue.
Although SRD+C-fed rats did no present changes of body weight or dairy energy intake compared to SRD-fed rats, a significant reduction of relative weight of PRAT was observed in SRD+C group, which was significantly correlated with the normalization of systolic blood pressure. The correlational analysis is set out in (Figure 1).
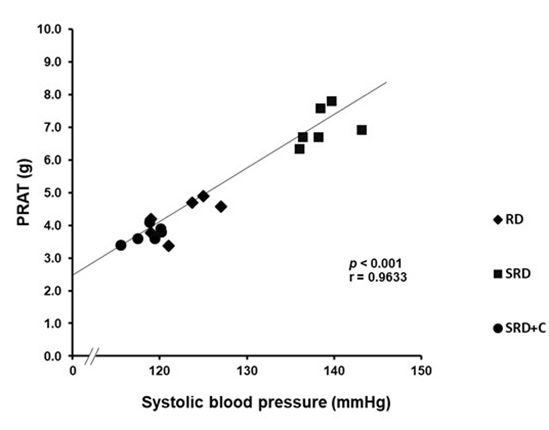
Figure 1: Correlation of perirenal adipose tissue weight and systolic blood pressure in rats fed RD, SRD and SRD+C. Pearson’s correlation coefficient (r) and statistical significance values (p) are shown.
RD: Reference Diet; SRD: Sucrose-Rich Diet; SRD+C: SRD Plus Chia seed; PRAT: Perirenal Adipose Tissue.
II Effects of Dietary Chia Seed Administration upon Renal Injury Induced by SRD
Figure 2A shows key markers of renal performance. As can be seen from the data, rats fed an SRD presented increased levels of albumin and glucose in the urine. It is a remarkable result that SRD+C-fed rats displayed a significant reduction of albumin and glucose excretion in urine, reaching values similar to those observed in RD-fed rats. Besides, an increase in urine creatinine level relative to animals that do not consume the seed was observed.
No change in liquid intake, diuresis and total creatinine excretion was observed in SRD+C-fed rats compared with animals that did not ingest the seed. Values were as follow: Liquid intake (mL/24h): 18.7±1.7 RD; 10.8±0.5 SRD; 13.0±1.2 SRD+C. p<0.05 RD vs. SRD and SRD+C. Diuresis (mL/24h): 12.1±0.4 RD; 7.0±0.7 SRD; 5.4±0.4 SRD+C. p<0.05 RD vs. SRD and SRD+C. Total creatinine excretion (mg/24 h): 24.3±0.6 RD; 13.8±0.4 SRD; 13.3±0.6 SRD+C. p<0.05 RD vs. SRD and SRD+C.
Fibrosis is an essential component of renal injury. Figure 2B shows histological sections of kidney staining by conventional Hematoxylin-Eosin and Sirius Red staining, showing morphological characteristics of kidneys and collagen distribution respectively. Hematoxylin & Eosin-stained sections of kidney show hyaline glomerular changes and obliterated lumens in tubules of SRD rats in contrast with RD and SRD+C that have normal glomerulus and tubules with open lumens. Qualitative analysis of Sirius Red staining showed that SRD+C improved collagen distribution in the renal cortex showing a similar pattern to that observed in the RD-fed rats. Quantitative analysis of collagen birefringence with polarized light microscopy shows a significant increase of (%) in SRD rat and a significant decrease of (%) in SRD+C-fed rats (Figure 2C). In accordance, SRD+C-fed rats displayed a significant reduction of hydroxyproline content in the renal cortex compared with animals fed SRD (Figure 2D).
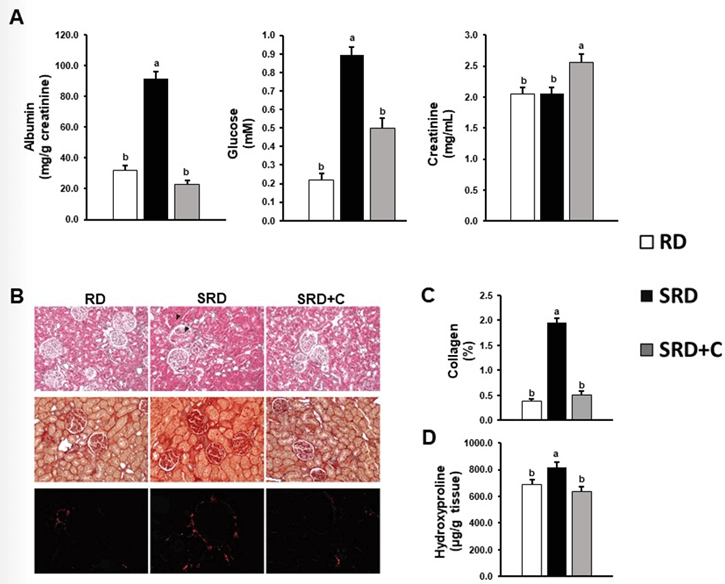
Figure 2: Effects of dietary chia seed administration upon renal injury induced by SRD. A) Urine albumin, glucose and creatinine level. B) Haematoxylin-eosin staining (top panel), Picrosirius red and polarized light-stained images (middle and lower panel respectively). In SRD group a glomerulus (arrow) and a renal tubule (arrowhead) is shown. Original magnification, 400X. C) Collagen quantification by polarization microscopy. D) Hydroxyproline levels. Data are expressed as mean ± SEM (n=6). Values that do not share the same superscript lowercase letter are significantly different by comparison using one-way ANOVA with Tukey's post hoc test.
RD: Reference Diet; SRD: Sucrose-Rich Diet; SRD+C: SRD Plus Chia seed.
III Effects of Dietary Chia Seed upon Renal Gluconeogenesis and Glucose Storage in SRD-Fed Rats
Kidneys are important players in glucose homeostasis maintenance through de novo glucose biosynthesis (gluconeogenesis). Hence, it was measured the activity of key enzymes of gluconeogenesis and glycogen storage. As shown in (Figure 3) the SRD+C group displayed a significant normalization of PEPCK and FBPase activities without recovery of the increased G6Pase activity. There was no observed change in glycogen content between the experimental groups.
IV Impact of Dietary Chia Seed upon Renal Lipotoxicity and Oxidative Stress Caused by SRD
Lipotoxicity has been described as an essential player in renal failure [32]. Although TG are neutral lipids and are not considered toxic in themselves, their association with oxidative stress markers are clear indicator of lipotoxicity. In the SRD-fed rats, increased levels of TG, ROS and lipid peroxides were shown. Dietary chia seed significantly reduced TG, ROS and TBARS levels (Figures 4A & 4C).

Figure 3: Effects of dietary chia seed upon renal gluconeogenesis and glucose storage of SRD-fed rats. Data are expressed as mean ± SEM (n=6). Values that do not share the same superscript lowercase letter are significantly different by comparison using one-way ANOVA with Tukey's post hoc test.
RD: Reference Diet; SRD: Sucrose-Rich Diet; SRD+C: SRD Plus Chia seed; PEPCK: Phosphoenolpyruvate Carboxykinase; FBPase: Fructose Bi-Phosphatase; G6Pase: Glucose-6-Phosphatase.
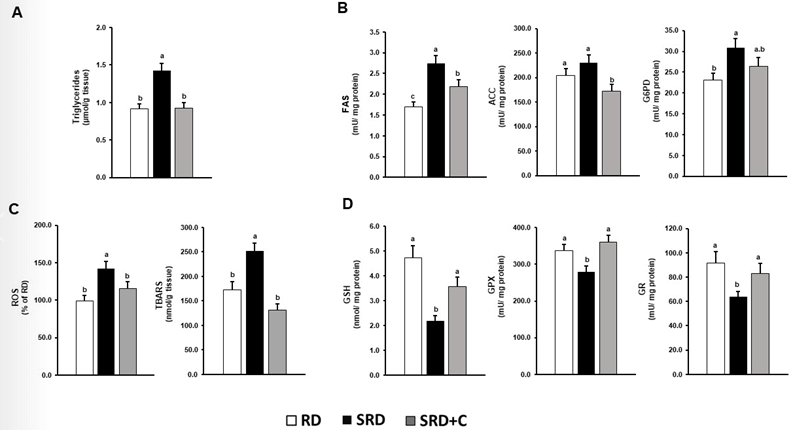
Figure 4: Impact of dietary chia seed upon increased renal lipid accumulation, de novo fatty acid biosynthesis, oxidative stress and antioxidant defenses depletion induced by SRD. A) Triglyceride content in renal cortex. B) Activity of ACC, FAS and G6PD. C) ROS levels and TBARS content in the renal cortex. D) GSH levels and activity of GPX and GR. Data are expressed as mean ± SEM (n=6). Values that do not share the same superscript lowercase letter are significantly different by comparison using one-way ANOVA with Tukey's post hoc test. RD: Reference Diet; SRD: Sucrose-Rich Diet; SRD+C: SRD Plus Chia seed; ACC: Acetyl-CoA Carboxylase; FAS: Fatty Acid Synthase; G6PD: Glucose-6-Phosphate Dehydrogenase; GSH: Glutathione; GR: Glutathione Reductase; GPX: Glutathione Peroxidase; ROS: Reactive Oxygen Substances; TBARS: Thiobarbituric Acid Reactive Substances.
To seek the mechanism by which dietary chia reduces TG content and oxidative stress, it was analyzed the activity key enzymes of de novo fatty acids biosynthesis and antioxidant defenses. Compared with SRD-fed rats, the SRD+C group presented an improvement in the activity of ACC and FAS without significant improvement in G6PD. Analyses of antioxidant defenses demonstrated that chia receiving group presented levels of GSH, and GPx and GR activities similar to those of the RD group (Figures 4B & 4D).
Discussion
The findings of this study support our hypothesis that the intake of chia seed counteracts kidney failure of MS induced by sucrose rich diet, protecting against lipid accretion, oxidative stress and fibrosis in this tissue. It has been reliably demonstrated that in both human and pre-clinical models of MS, deep changes in kidney physiology occurs [5]. Supporting this evidence, results achieved in this study demonstrate that the experimental model of MS induced by SRD display a deterioration of kidney function and morphology with fibrosis, excessive accumulation of fat in surrounding adipose tissue as well as within the kidney and oxidative stress.
The major new findings achieved in this study showed for the first time that dietary chia, a vegetable source of n-3 PUFA (ALA), antioxidants, and fiber ameliorated urine levels of creatinine, glucose, and albumin –key markers of renal injury– coincident with a complete improvement of renal fibrosis and morphology. Our data is in agreement with other studies that evaluated the effects of diets supplemented with other vegetable sources of ALA, fiber, and antioxidants in metabolic diseases. Makni et al. evidenced that a diet rich in a mixture of flax and pumpkin seeds (33% w/w of dietary supplementation) ameliorated kidney function (urea and creatinine plasma levels), glomerular hypertrophy, and tubular dilatation in alloxan-induced diabetic rats [33]. Supplementation of a hypercholesterolemic diet with a mixture of flax/pumpkin or purslane/pumpkin seeds (n-6/n-3 ratio 5/1) produced an amelioration of renal function (estimated by urea, creatinine and Na/K plasma levels) in hypercholesterolemic rats [34].
Blood pressure significantly reflects kidney function. Observational studies in humans reveal that excessive PRAT increases the risk of hypertension, supporting the idea that PRAT is a unique fat pad potentially targeted for cardiovascular disease [35-37]. Accordingly, the normalization of systolic hypertension induced by chia was strongly associated with the decrease in PRAT weight. Nevertheless, further studies are necessary to explore this field. At the same way, correct gluconeogenesis is another key feature of kidney health. The present study demonstrated that chia restored PEPCK and FBPase, key enzymes of the gluconeogenesis pathway. Even more, considering that the intensification of renal gluconeogenesis is commonly associated with hyperglycemia, the findings indicate that this could be a mechanism implicated in the hypoglycemic effects of chia [38].
By examining the mechanisms by which chia improved kidney failure induced by SRD, we found a significant reduction of TG accumulation within kidneys. On the one hand, this fact can respond to the reduction of blood lipid availability induced by chia, in accordance with the reduction of ectopic lipid accumulation in cardiac and skeletal muscle [39, 40]. Taking into account that FFA comes from adipose tissue lipolysis, the unique metabolic characteristics of PRAT, and earlier results, the results suggest that normalization of PRAT weight can be an important event implicated in the supply of FFA to kidneys [37, 41].
Furthermore, the present study demonstrated that the decrease of lipid storage in SRD+C-fed rats arises from a decline of de novo fatty acid biosynthesis (a significant reduction of ACC and FAS was observed). At regards, Chin et al. showed that dietary OMACOR® (EPA/DHA-rich oil) induced a down-regulation of the SREBP-1, an essential transcription factor of FA biosynthesis regulation, attenuating the TG amount in the kidneys of type II diabetic animals [42]. Therefore, it is possible that ALA containing in chia (through its metabolism to EPA and DHA) modulates SREBP-1 decreasing FA biosynthesis.
Excessive intracellular lipids raise ROS levels triggering fibrosis and inflammation [32]. Hence, the results achieved indicate that the reduction of TG within renal tissue induced by chia can be a mechanism involved in the decline of ROS generation and lipid peroxidation. Even more, it can result from the increase of the antioxidant cellular defenses (activity of GPx and GR and GSH levels). Several studies are in line with this finding. An increase in antioxidant defenses SOD, CAT and GHS levels was shown in pharmacological-induced diabetic rats fed a mixture of flax and pumpkin seeds rich in ALA, fiber and antioxidants [33]. Dietary chia induced antioxidant defenses in the heart muscle by up-regulation of gene expression of Nrf2 in SRD-fed rats [22]. Long-term administration of EPA/DHA-rich oil attenuated tubulointerstitial fibrosis in a chronic kidney disease model by a combination of its antioxidant and anti-inflammatory actions [43]. Further, dietary EPA/DHA reduced oxidative stress mediated by advanced glycation end products in diet-induced diabetic rats [44].
Altogether, the results achieved to support the idea that the improvement of lipidic homeostasis and oxidative status in renal tissue induced by chia are events that can work in concert to improve kidney injury. Even more, it is important to highlight the possible effects of oxylipins derived from ALA. Caligiuri et al. illustrated the capacity of oxylipins and phospholipids derived from ALA metabolism in reducing obesity-related glomerulopathy in those rats fed a high-fat diet with several proportions of n-6 LA/n-3 ALA [45, 46].
Conclusion
In summary, the data confirm the hypothesis that dietary chia ameliorated renal failure present in the relevant experimental model of MS induced by SRD, by decreasing PRAT and de novo fatty acid biosynthesis, and increasing antioxidant defenses. Taken all together, this study is the first to show the beneficial effects of seeds rich in n-3 PUFAs, fiber and antioxidants upon undesirable renal outputs of MS.
Highlights
i. Dietary chia counteracted renal damage in experimental Metabolic Syndrome.
ii. Chia returned renal lipotoxicity by handling lipid biosynthesis and availability.
iii. Chia normalizes blood pressure by decreasing perirenal adipose tissue hypertrophy.
Acknowledgment
None.
Funding
This work was supported by Consejo Nacional de Investigaciones Científicas y Técnicas (CONICET), Argentina [PIP #11220150100023CO] and Universidad Nacional del Litoral, Argentina [CAI+D #50620190100008LI].
Author Contributions
Agustina Creus: Data curation, Formal analysis, Investigation, Methodology, Writing-original draft; Paola Ingaramo: Methodology, María Eugenia Oliva: Formal analysis, María Eugenia D’Alessandro: Conceptualization; Methodology; Supervision; Validation; Writing – original draft; Writing – review & editing. Resources and funding acquisition. All authors read and approved the final manuscript.
Declaration
The authors declare that they have no known competing financial interests or personal relationships that could have appeared to influence the work reported in this paper.
Abbreviation
ACC: Acetyl-CoA Carboxylase
ALA: α-Linolenic Acid
DHA: Docosahexaenoic Acid
EPA: Eicosapentaenoic Acid
FA: Fatty Acids
FAS: Fatty-Acyl-CoA Synthase System
FBPase: Fructose-Bisphosphatase
FFA: Free Fatty Acids
G6Pase: Glucose-6-Phosphatase
G6PD: Glucose-6-Phosphate Dehydrogenase
GPx: Glutathione Peroxidase
GR: Glutathione-Disulfide Reductase
GSH: Glutathione
LA: Linoleic Acid
MS: Metabolic Syndrome
PEPCK: Phosphoenolpyruvate Carboxykinase
PRAT: Perirenal Adipose Tissue
PUFAs: n-3 Polyunsaturated Fatty Acids
RD: Reference Diet
SRD: Sucrose-Rich Diet
SRD+C: Sucrose-Rich Diet Plus Chia
TBARS: Thiobarbituric Acid Reactive Substance
TG: Triglycerides
Article Info
Article Type
Research ArticlePublication history
Received: Mon 19, Sep 2022Accepted: Fri 07, Oct 2022
Published: Mon 31, Oct 2022
Copyright
© 2023 María E. G. D’Alessandro. This is an open-access article distributed under the terms of the Creative Commons Attribution License, which permits unrestricted use, distribution, and reproduction in any medium, provided the original author and source are credited. Hosting by Science Repository.DOI: 10.31487/j.JFNM.2022.01.03
Figures & Tables
Table 1: Composition of experimental diets. SRD: Sucrose-rich
diet. SRD+C: SRD plus chia seed.
|
Diet ingredients |
SRD |
SRD+C |
|
|
% w/w |
|
|
Corn starch |
2.5 |
- |
|
Sucrose |
55.5 |
55.5 |
|
Casein |
16.5 |
7.4 |
|
Corn oil |
10.5 |
1.0 |
|
Chia seed |
- |
36.2 |
|
Cellulose |
10.0 |
1.0 |
|
Methionine |
0.3 |
0.3 |
|
Choline |
0.2 |
0.2 |
|
Mineral Mix |
3.5 |
3.5 |
|
Vitamin Mix |
1.0 |
1.0 |
Table 2: Effects of chia seed upon general features of SRD-fed
rats.
|
Parameter |
RD |
SRD |
SRD+C |
|
Final
Body weight (g) |
484.1
± 7.3b |
542.5
± 16.2a |
525.7
± 6.1a |
|
Energy
intake (kJ/24 h) |
265.3
± 7.8b |
347.2
± 4.1a |
334.5
± 22.1a |
|
Relative
weight of right kidney (g/100
g body weight) |
0.333
± 0.011 |
0.307
± 0.100 |
0.300
± 0.005 |
|
Relative
weight of PRAT (g/100
g body weight) |
0.88 ± 0.09b |
1.40 ± 0.09a |
0.99 ± 0.13b |
|
Plasma
glucose (mM) |
6.61 ± 0.13b |
9.15 ± 0.49a |
7.15 ± 0.24b |
|
Plasma
triglyceride (mM) |
1.19 ± 0.10b |
2.83 ± 0.19a |
1.20 ± 0.11b |
|
Plasma
FFA (μM) |
312.7 ± 9.1 b |
773.8 ± 28.5 a |
361.2 ± 24.3 b |
Data are expressed as mean ± SEM (n=6).
Values that do not share the same superscript lowercase letter are
significantly different by comparison using one-way ANOVA with Tukey's post hoc
test.
RD:
Reference Diet; SRD: Sucrose-Rich Diet; SRD+C: SRD Plus Chia seed; PRAT:
Perirenal Adipose Tissue.
RD: Reference Diet; SRD: Sucrose-Rich Diet; SRD+C: SRD Plus Chia seed; PRAT: Perirenal Adipose Tissue.
RD: Reference Diet; SRD: Sucrose-Rich Diet; SRD+C: SRD Plus Chia seed.
RD: Reference Diet; SRD: Sucrose-Rich Diet; SRD+C: SRD Plus Chia seed; PEPCK: Phosphoenolpyruvate Carboxykinase; FBPase: Fructose Bi-Phosphatase; G6Pase: Glucose-6-Phosphatase.
References
1. Saklayen MG (2018)
The Global Epidemic of the Metabolic Syndrome. Curr Hypertens Rep 20:
12. [Crossref]
2. O’Neill S,
O’Driscoll L (2015) Metabolic syndrome: A closer look at the growing epidemic
and its associated pathologies. Obes Rev 16: 1-12. [Crossref]
3. Bansal R, Gubbi S,
Muniyappa R (2020) Metabolic Syndrome and COVID 19: Endocrine-Immune-Vascular
Interactions Shapes Clinical Course. Endocrinology 161: bqaa112. [Crossref]
4. Grundy SM (2012)
Pre-diabetes, metabolic syndrome, and cardiovascular risk. J Am Coll Cardiol
59: 635-643. [Crossref]
5. Joyce T, Chirino
YI, Natalia MT, Jose PC (2018) Renal damage in the metabolic syndrome (MetSx):
Disorders implicated. Eur J Pharmacol 818: 554-568. [Crossref]
6. Stefansson VTN,
Schei J, Solbu MD, Jenssen TG, Melsom T et al. (2018) Metabolic syndrome but
not obesity measures are risk factors for accelerated age-related glomerular
filtration rate decline in the general population. Kidney Int 93:
1183-1190. [Crossref]
7. Chuang SM, Shih HM,
Chien MN, Liu SC, Wang CH et al. (2019) Risk factors in metabolic syndrome
predict the progression of diabetic nephropathy in patients with type 2
diabetes. Diabetes Res Clin Pract 153: 6-13. [Crossref]
8. Rashidbeygi E,
Safabakhsh M, Aghdam SD, Mohammed SH, Alizadeh S (2019) Metabolic syndrome and
its components are related to a higher risk for albuminuria and proteinuria:
Evidence from a meta-analysis on 10,603,067 subjects from 57 studies. Diabetes
Metab Syndr 13: 830-843. [Crossref]
9. Okada R, Yasuda Y,
Tsushita K, Wakai K, Hamajima N et al. (2014) The number of metabolic syndrome
components is a good risk indicator for both early- and late-stage kidney
damage. Nutr Metab Cardiovasc Dis 24: 277-285. [Crossref]
10. Chung HF, Long KZ,
Hsu CC, Mamun AA, Jhang HR et al. (2015) Association of n-3 polyunsaturated
fatty acids and inflammatory indicators with renal function decline in type 2
diabetes. Clin Nutr 34: 229-234. [Crossref]
11. Lemos JRN, de
Alencastro MG, Konrath AV, Cargnin M, Manfro RC (2012) Flaxseed oil
supplementation decreases C-reactive protein levels in chronic hemodialysis
patients. Nutr Res 32: 921-927. [Crossref]
12. Ogborn MR,
Nitschmann E, Calic NB, Weiler HA, Aukema H (2002) Dietary flax oil reduces
renal injury, oxidized LDL content, and tissue n-6/n-3 FA ratio in experimental
polycystic kidney disease. Lipids 37: 1059-1065. [Crossref]
13. Yamaguchi T,
Devassy JG, Gabbs M, Ravandi A, Nagao S et al. (2015) Dietary flax oil rich in
α-linolenic acid reduces renal disease and oxylipin abnormalities, including
formation of docosahexaenoic acid derived oxylipins in the CD1-pcy/pcy mouse
model of nephronophthisis. Prostaglandins Leukot Essent Fat Acids 94:
83-89. [Crossref]
14. Lopez MÁV, Tecante
A (2015) Chia (Salvia hispanica): A Review of Native Mexican Seed and its
Nutritional and Functional Properties. Adv Food Nutr Res 75: 53-75. [Crossref]
15. Alfredo VO, Gabriel
RR, Luis CG, David BA (2009) Physicochemical properties of a fibrous fraction
from chia (Salvia hispanica L.). LWT - Food Sci Technol 42:
168-173.
16. Lombardo YB, Drago
S, Chicco AG, Day PF, Gutman R et al. (1996) Long-term administration of a
sucrose-rich diet to normal rats: relationship between metabolic and hormonal
profiles and morphological changes in the endocrine pancreas. Metabolism
45: 1527-1532. [Crossref]
17. Chicco AG,
D’Alessandro ME, Karabatas L, Pastorale C, Basabe JC et al. (2003) Muscle lipid
metabolism and insulin secretion are altered in insulin-resistant rats fed a
high sucrose diet. J Nutr 133: 127-133. [Crossref]
18. Reeves PG, Nielsen
FH, Fahey Jr GC (1993) AIN-93 Purified diets for laboratory rodents: final
report of the American Institute of Nutrition Ad Hoc Writing Committee on the
reformulation of the AIN-76A rodent diet. J Nutr 123: 1939-1951. [Crossref]
19. Vuksan V, Choleva
L, Jovanovski E, Jenkins AL, Yeung FA et al. (2017a) Comparison of flax (Linum
usitatissimum) and Salba-chia (Salvia hispanica L.) seeds on postprandial
glycemia and satiety in healthy individuals: a randomized, controlled,
crossover study. Eur J Clin Nutr 71: 234-238. [Crossref]
20. Vuksan V, Jenkins
AL, Brissette C, Choleva L, Jovanovski E et al. (2017) Salba-chia (Salvia
hispanica L.) in the treatment of overweight and obese patients with type 2
diabetes: a double-blind randomized controlled trial. Nutr Metab Cardiovasc
Dis 27: 138-146. [Crossref]
21. Oliva ME, Ferreira
MDR, Joubert MBV, D’Alessandro ME (2021) Salvia hispanica L. (chia) seed
promotes body fat depletion and modulates adipocyte lipid handling in
sucrose-rich diet-fed rats. Food Res Int 139: 109842. [Crossref]
22. Creus A, Chicco A,
Alvarez SM, Gimenez MS, de Lombardo YB (2020) Dietary Salvia hispanica
L. reduces cardiac oxidative stress of dyslipemic insulin-resistant rats. Appl
Physiol Nutr Metab 45: 761-768. [Crossref]
23. Scerbo D, Son NH,
Sirwi A, Zeng L, Sas KM et al. (2017) Kidney triglyceride accumulation in the
fasted mouse is dependent upon serum free fatty acids. J Lipid Res 58:
1132-1142. [Crossref]
24. Folch J, Lees M,
Stanley GHS (1957) A simple method for the isolation and purification of total
lipidies from animal tissues. J Biol Chem 226: 497-509. [Crossref]
25. Oliva ME, Selenscig
D, D’Alessandro ME, Chicco A, Lombardo YB (2011) Soya protein ameliorates the
metabolic abnormalities of dysfunctional adipose tissue of dyslipidaemic rats
fed a sucrose-rich diet. Br J Nutr 105: 1188-1198. [Crossref]
26. Bertinat R, Pontigo
JP, Pérez M, Concha II, Martín RS et al. (2012) Nuclear accumulation of
fructose 1,6-bisphosphatase is impaired in diabetic rat liver. J Cell
Biochem 113: 848-856. [Crossref]
27. Hein GJ, Chicco A,
Lombardo YB (2012) Fish oil normalizes plasma glucose levels and improves liver
carbohydrate metabolism in rats fed a sucrose-rich diet. Lipids 47:
141-150. [Crossref]
28. Ferreira MR, Alvarez
SM, Illesca P, Gimenez MS, Lombardo YB (2016) Dietary Salba (Salvia hispanica
L.) ameliorates the adipose tissue dysfunction of dyslipemic insulin-resistant
rats through mechanisms involving oxidative stress, inflammatory cytokines and
peroxisome proliferator-activated receptor γ. Eur J Nutr 57: 83-94. [Crossref]
29. Samarghandian S,
Nezhad MA, Farkhondeh T, Samini F (2017) Anti-oxidative effects of curcumin on
immobilization-induced oxidative stress in rat brain, liver and kidney. Biomed
Pharmacother 87: 223-229. [Crossref]
30. Creus A, Benmelej
A, Villafañe N, Lombardo YB (2017) Dietary Salba (Salvia hispanica L) improves
the altered metabolic fate of glucose and reduces increased collagen deposition
in the heart of insulin-resistant rats. Prostaglandins Leukot Essent Fat
Acids 121: 30-39. [Crossref]
31. Glantz SA (2005)
Primer of Biostatistic. McGraw Hill, New York.
32. Gai Z, Wang T,
Visentin M, Ublick GAK, Fu X et al. (2019) Lipid Accumulation and Chronic
Kidney Disease. Nutrients 11: 722. [Crossref]
33. Makni M, Sefi M,
Fetoui H, Garoui EM, Gargouri NK et al. (2010) Flax and Pumpkin seeds mixture
ameliorates diabetic nephropathy in rats. Food Chem Toxicol 48: 2407-2412.
[Crossref]
34. Barakat LAA,
Mahmoud RH (2011) The antiatherogenic, renal protective and immunomodulatory
effects of purslane, pumpkin and flax seeds on hypercholesterolemic rats. N
Am J Med Sci 3: 411-417. [Crossref]
35. Ricci MA, Scavizzi
M, Ministrini S, Vuono SD, Pucci G et al. (2018) Morbid obesity and
hypertension: The role of perirenal fat. J Clin Hypertens (Greenwich)
20: 1430-1437. [Crossref]
36. Roever L, Resende
ES, Veloso FC, Diniz ALD, Silva NP et al. (2015) Perirenal Fat and Association
With Metabolic Risk Factors: The Uberlândia Heart Study. Medicine
(Baltimore) 94: e1105. [Crossref]
37. Liu BX, Sun W, Kong
XQ (2019) Perirenal Fat: A Unique Fat Pad and Potential Target for
Cardiovascular Disease. Angiology 70: 584-593. [Crossref]
38. Swe MT,
Pongchaidecha A, Chatsudthipong V, Chattipakorn N (2019) Molecular signaling
mechanisms of renal gluconeogenesis in nondiabetic and diabetic conditions. J
Cell Physiol 234: 8134-8151. [Crossref]
39. Creus A, Ferreira
MR, Oliva ME, Lombardo YB (2016) Mechanisms Involved in the Improvement of
Lipotoxicity and Impaired Lipid Metabolism by Dietary α-Linolenic Acid Rich
Salvia hispanica L (Salba) Seed in the Heart of Dyslipemic Insulin-Resistant
Rats. J Clin Med 5: 18. [Crossref]
40. del Rosario
Ferreira M, Oliva ME, Aiassa V, D’Alessandro ME (2020) Salvia hispanica
L. (chia) seed improves skeletal muscle lipotoxicity and insulin sensitivity in
rats fed a sucrose-rich diet by modulating intramuscular lipid metabolism. J
Funct Foods 66: 103775.
41. Oliva ME, Ferreira
MR, Chicco A, Lombardo YB (2013) Dietary Salba (Salvia hispanica L) seed rich
in α-linolenic acid improves adipose tissue dysfunction and the altered
skeletal muscle glucose and lipid metabolism in dyslipidemic insulin-resistant
rats. Prostaglandins Leukot Essent Fatty Acids 89: 279-289. [Crossref]
42. Chin HJ, Fu YY, Ahn
JM, Na KY, Kim YS et al. (2010) Omacor®, n-3 polyunsaturated fatty acid,
attenuated albuminuria and renal dysfunction with decrease of SREBP-1
expression and triglyceride amount in the kidney of type II diabetic animals. Nephrol
Dial Transplant 25: 1450-1457. [Crossref]
43. De Assis AM, Rech
A, Longoni A, da Silva Morrone M, de Bittencourt Pasquali MA et al. (2014)
Dietary n-3 polyunsaturated fatty acids revert renal responses induced by a
combination of 2 protocols that increase the amounts of advanced glycation end
product in rats. Nutr Res 35: 512-522. [Crossref]
44. An WS, Kim HJ, Cho
KH, Vaziri ND (2009) Omega-3 fatty acid supplementation attenuates oxidative
stress, inflammation, and tubulointerstitial fibrosis in the remnant kidney. Am
J Physiol Ren Physiol 297: F895-F903. [Crossref]
45. Caligiuri SPB, Blydt-Hansen T, Love K, Grégoire M, Taylor CG et al. (2014) Evidence for the use of glomerulomegaly as a surrogate marker of glomerular damage and for alpha-linolenic acid-rich oils in the treatment of early obesity-related glomerulopathy in a diet-induced rodent model of obesity. Appl Physiol Nutr Metab 39: 951-959. [Crossref]
46. Caligiuri SPB, Love K, Winter T, Gauthier J, Taylor CG et al. (2013) Dietary linoleic acid and α-linolenic acid differentially affect renal oxylipins and phospholipid fatty acids in diet-induced obese rats. J Nutr 143: 1421-1431. [Crossref]