Concentration of hCG in Blastocoel Fluid is Independent of Embryo Morphology and PGT-A Results: Could it be a Significant Biomarker for a Competent Embryo?
A B S T R A C T
The aim of this research was to develop a quantitative sandwich-strip ELISA was developed on a nitrocellulose membrane with anti-H alpha and anti-hCG beta antibodies. The detection antibody was conjugated to horseradish peroxidase, and a quantitative sandwich-strip ELISA with luminol substrate was developed following optimization with hCG. Concentration of hCG in the BF was determined for 101 embryo biopsies (Study 1) and 96 embryo biopsies (Study 2) respectively, and the results were compared with the previously recorded embryo morphology and PGT-A results. hCG was present in 73.6% of all BF specimens analysed in these two studies, and a weak correlation between hCG levels and both embryo morphology and PGT-A outcome was observed. Additionally, the receiver operating characteristic (ROC) curves show separately that both embryo morphology and PGT-A do not correlate with hCG concentrations. This indicates that the presence of hCG produced in the BF by the embryo is a separate, independent marker of embryo quality.
Keywords
Blastocoel, hCG, embryo, morphology, PGT-A
Introduction
Selecting the most competent embryo from its cohort is critical in order to give rise to a healthy singleton IVF pregnancy. To achieve this goal, morphological criteria for competent embryos have been defined and routinely used by clinicians. Trophectoderm biopsies of blastocyst-stage embryos have been employed to determine embryo ploidy status. Even with further improved techniques, such as morphokinetic analysis by time-lapse imaging and comparative genomic hybridization for comprehensive chromosome analysis, there remains much room for improvement in the process of identifying competent embryos [1-3].
This is not surprising, considering that the above mentioned assays are correlated with the reproductive outcomes of only a select few populations. Even with normal results from these tests, other defects that compromise embryo quality may be present. Therefore, to improve on IVF success rates, other biomarkers of competent embryos must be identified and considered along with embryo morphology and genetic ploidy.
A recent publication by Storr et al. confirms that trophectoderm grade is a significant predictor of live birth, underlining the importance of a functional trophectoderm: a competent trophectoderm is needed for successful implantation to occur [4, 5]. Since 1984, it has been known that the developing embryo makes hCG; we also know that a significantly higher concentration of hCG is present in embryos with high quality trophectoderm grading, and in embryos that successfully implant [6, 7].
It therefore stands to reason that hCG concentration is an essential biomarker of a competent embryo; however, the current standard assays for determining hCG concentration are not sensitive enough to analyse very low concentrations. Additionally, the current methods of measuring hCG are relatively expensive and time-consuming, requiring specialized equipment and trained technicians.
For this reason, our aim was to develop a highly sensitive, easy-to-perform assay to determine hCG concentration in BF, which is typically discarded following trophectoderm biopsy or after forced collapse of the blastocoel prior to cryopreservation. This test result, combined with morphological criteria and PGT-A results, may be useful in identifying the most competent embryo from a given cohort.
Materials and Methods
I Blastocoel Fluid (BF) Collection
Biopsies were performed either in 20 µl of HEPES buffer with 5mg/ml human serum albumin (CooperSurgical, CT 06611) in Study 1, or in 40 µl of irvine multipurpose handling medium (Fujifilm, CA, 92705) in Study 2. Samples of at least 20 µl of biopsy fluid containing BF were kept frozen individually in labeled microcentrifuge vials at -20° C until the time of analysis. Each patient was assigned an anonymous research number, according to which their blastocyst morphology and biopsied trophectoderm results were recorded.
II hCG Determination
A quantitative sandwich-strip ELISA was developed on a 4 mm-wide nitrocellulose membrane (DCN Diagnostics, CA 92011) with monoclonal anti-H alpha antibodies and monoclonal anti-hCG beta antibodies (MedixBiochemica, MA 02142). The detection antibody was conjugated to horseradish peroxidase (HRP Lightning-Link® kit by Expedeon, CA 92121) and the luminol substrate was prepared according to the manufacturer’s instructions (GE Healthcare, Amersham, VWR, PA 19087). A quantitative sandwich-strip ELISA was developed following optimization with hCG (Abcam, MA 02139).
The position of the capture antibody was marked on the back of the strip and then blocked with 5% bovine serum albumin (Sigma Aldrich, MO 63103). Next, either 15µl of hCG standards or BF with 35µl detection antibodies in buffer was transferred into 2ml polypropylene tubes, gently mixed, and allowed to stand for five (5) minutes. The mixture was then transferred into a glass test tube, the blocked strip was placed into it, and the analytes were allowed to migrate through the membrane for 30 minutes at room temperature.
The strips were then cut at the previously marked area around the capture antibody, and the cut pieces were transferred into new polypropylene tubes. The pieces were washed by vortexing them five (5) times with 1.5 ml of Pierce ™ Fast Wash Buffer (Fisher Scientific, IL 60693). Each piece was taken out, blotted dry, and placed into a black 96-well ELISA plate. To each well, 150µl of luminol substrate was added, and luminosity was read using the SpectraMax® L (Molecular Devices LLC, CA 95134) on 470 nm. The concentration of hCG in the BF was then determined from the four-parameter logistic curve generated by the SpectraMax® L.
In all, hCG was measured in the BF from 101 embryo biopsies (Study 1) and 96 embryo biopsies (Study 2) respectively. The results of the hCG concentrations were statistically analysed with the previously recorded embryo morphology and PGT-A results.
Results
hCG was detected in 60.4% of BF in Study 1 and 87% of BF in Study 2. There was no association between hCG detection and embryo morphology in either study, as shown in (Figures 1A & 1B) (Chi-Square p-value = 0.21 and 0.60). Likewise, as seen in (Figures 2A & 2B), no association was found to exist between hCG detection and PGT-A outcome (Chi-Square p-value = 0.54 and 0.84, respectively). Neither study showed hCG distribution to be correlated with embryo morphology (Kruskal-Wallis Test p = 0.43 and 0.17) or with an abnormal PGT-A outcome (Wilcoxon Two-Sample Test p = 0.79 and 0.58).
Because the median hCG differences between embryo morphology groups and by PGT-A outcomes were small, there was low power to detect a statistically significant difference (0.19 and 0.09; 0.49 and 0.08). In both studies, there was >0.80 power to detect a 15 pg/ml difference in median hCG between groups, which is clinically significant. The area under the ROC curves for discriminating between normal versus abnormal PGT-A results and embryo morphology by hCG among samples with detectable levels were 0.49 and 0.52 (Figures 3A & 3B); and 0.55 and 0.57 (Figure 4A & 4B), respectively.
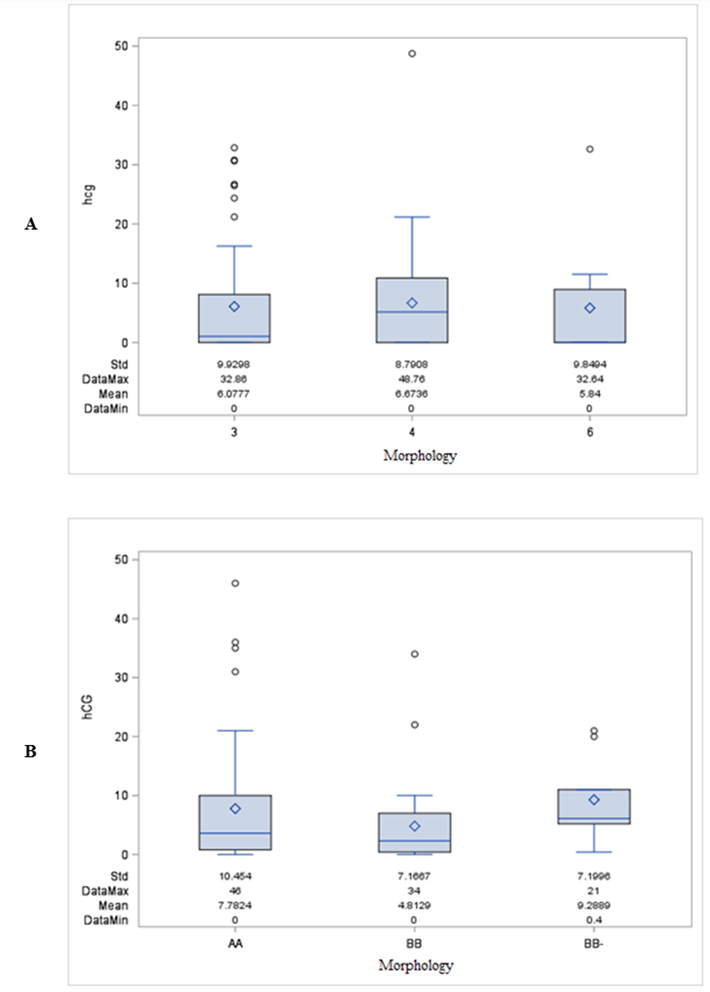
Figure 1: A & B) hCG detection and embryo morphology.
(Chi-Square p-value = 0.21 and 0.60).
A) Study 1-Distribution of hCG by morphology.
B) Study 2-Distribution of hCG by morphology.

Figure 2: A & B) hCG detection and normal versus abnormal PGT-A outcome.
(Chi-Square p-value = 0.54 and 0.84).
A) Study 1 -Distribution of hCG by PGT-A normal.
B) Study 2 -Distribution of hCG by PGT-A normal.
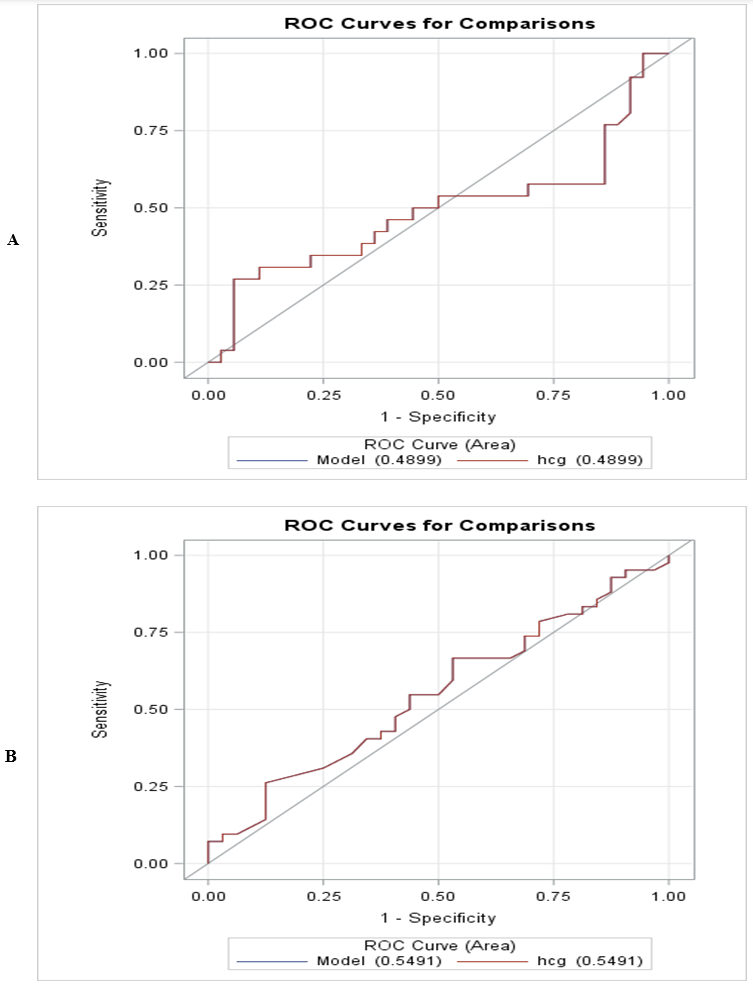
Figure 3: A & B) Receiver operating characteristic curves for discriminating between embryo morphology, by hCG among samples with detectable levels were 0.49 and 0.52.
A) Study 1 -Embryo morphology.
B) Study 2 -Embryo morphology.

Figure 4: A & B) Receiver operating characteristic curves for discriminating between normal versus abnormal PGT-A outcome by hCG amount samples with detectable levels were 0.49 and 0.52. A) Study 1 -PGT-A. B) Study 2 -PGT-A.
Discussion
It is known that the developing embryo produces hCG at various levels, and that hCG later appears in the maternal blood approximately 10-12 days after conception [7-14]. It can therefore be deduced that the implanting embryo needs to make hCG in order to result in a successful pregnancy.
hCG is measurable by assay techniques such as radioimmunoassay, electrochemiluminescence immunoassay and ELISA; however, these techniques are not sensitive enough to measure small quantities of hCG present in BF specimens. For this reason, the present research focused on developing a strip ELISA with the degree of sensitivity needed to measure the hCG concentration in BF. The results of these studies demonstrate that very small concentrations of hCG can be detected in BF following trophectoderm biopsies.
hCG was present in 73.6% of all the BF specimens analysed in these two studies combined. Failure to detect hCG in the remaining BF specimens may be due to a technical error, to embryo production of hCG being below the assay detection level, or to embryos simply not producing any hCG. It has been reported that different immunoreactive molecular forms of hCG are produced during embryo development, and the antibody complex used in the present studies may have failed to detect one of these different immunoreactive molecular forms of hCG [15]. Therefore, inability to detect hCG may not be conclusive proof that an embryo is developmentally incompetent. However, it is known that the embryo will need to produce exponential amounts of hCG later in development in order to maintain the corpus luteum and, consequently, to survive.
A lack of correlation between hCG levels and embryo morphology and PGT-A was observed in the present research. In addition, the results of the ROC curves show separately that embryo morphology and PGT-A do not correlate with hCG concentrations, indicating that hCG produced in the BF by the embryo is a separate, independent marker of embryo quality. An assay for identifying these small concentrations of hCG in blastocysts may therefore be desirable, because it indicates a potentially novel functional marker of the embryo that is independent of the prevailing methods for determining embryo competency.
Storr et al. demonstrated that trophectoderm morphology correlates better with implantation than inner cell mass (ICM) morphology, and significantly higher concentrations of hCG are present in embryos with high trophectoderm grading and in embryos that successfully implanted [4, 7]. Since hCG is produced by the trophectoderm, this strip ELISA assay for detecting low levels of hCG may help identify those embryos that are competent to implant, increasing the chances of a successful pregnancy. This technology is easy to use and economical, and may be employed at the time of trophectoderm biopsy. As mentioned earlier, there are many factors that may impact embryo implantation, and therefore may be required for a successful pregnancy. Only some of these factors have been identified to date.
We have demonstrated the ability of the present assay to reliably identify the presence of hCG in BF. The absence of a correlation between BF hCG and other currently available and well established markers of embryo quality suggest that BF hCG may represent a new and useful marker of embryo quality. Further studies are needed to determine the usefulness of this technology for detecting low levels of hCG from BF, and to what extent this information can be used in the process of identifying the most competent embryo.
Article Info
Article Type
Research ArticlePublication history
Received: Fri 21, Jul 2023Accepted: Mon 28, Aug 2023
Published: Wed 20, Sep 2023
Copyright
© 2023 Rajasingam S. Jeyendran. This is an open-access article distributed under the terms of the Creative Commons Attribution License, which permits unrestricted use, distribution, and reproduction in any medium, provided the original author and source are credited. Hosting by Science Repository.DOI: 10.31487/j.CROGR.2023.02.01
Figures & Tables
(Chi-Square p-value = 0.21 and 0.60).
A) Study 1-Distribution of hCG by morphology.
B) Study 2-Distribution of hCG by morphology.
(Chi-Square p-value = 0.54 and 0.84).
A) Study 1 -Distribution of hCG by PGT-A normal.
B) Study 2 -Distribution of hCG by PGT-A normal.
A) Study 1 -Embryo morphology.
B) Study 2 -Embryo morphology.
References
1. Gardner DK, Balaban
B (2016) Assessment of human embryo development using morphological criteria in
an era of time-lapse, algorithms and ‘OMICS’: is looking good still important? Mol
Hum Reprod 22: 704-718. [Crossref]
2. Dahdouh EM, Balayla
J, García Velasco JA (2015) Comprehensive chromosome screening improves embryo
selection: a meta-analysis. Fertil Steril 104: 1503-1512. [Crossref]
3. Munné S, Kaplan B,
Frattarelli JL, Child T, Nakhuda G et al. (2019) Preimplantation genetic
testing for aneuploidy versus morphology as selection criteria for single
frozen embryo transfer in good prognosis patients: a multicenter randomized
clinical trial. Fertil Steril 112: 1071-1079. [Crossref]
4.
Storr A, Bilir E, Cooke S, Garrett D,
Venetis CA (2019) Fine-tuning blastocyst selection based on morphology: a
multicentre analysis of 2461 single blastocyst transfers. Reprod Biomed
Online
39: 588-598. [Crossref]
5. Carter AM, Enders
AC, Pijnenborg R (2015) The role of
invasive trophoblast in implantation and placentation of primates. Philos
Trans R Soc Lond B Biol Sci 370: 20140070. [Crossref]
6. Fishel SB, Edwards
RG, Evans CJ (1984) Human chorionic gonadotropin secreted by preimplantation
embryos cultured in vitro. Science 223: 816-818. [Crossref]
7. Xiso Yan C, Jie L,
Dang J, Tao L, Xin Ru L et al. (2013) A highly sensitive
electrochemiluminescence immunoassay for detecting human embryonic human
chorionic gonadotropin in spent embryo culture media during IVF-ET cycle. J
Assist Reprod Genet 30: 377-382. [Crossref]
8. Alvero R, Konowal
A, Russell D, Rosario M, Kelk D et al. (2004) Evaluation of products from
embryo culture and their correlation with pregnancy outcome. Fertil Steril
82: S57.
9. Dokras A, Sargent
IL, Ross C, Garner RL, Barlow DH (1991) The human blastocyst: morphology and
human chorionic gonadotropin secretion in vitro. Hum Reprod 6:
1143-1151. [Crossref]
10. Hay DL, Lopata A
(1988) Chorionic gonadotropin secretion by human embryos in vitro. J
Clin Endocrinol Metab 66: 557-564. [Crossref]
11. Lopata A, Hay DL
(1989) The potential of early human embryos to form blastocysts, hatch from
their zona and secrete HCG in culture. Hum Reprod 4: 87-94. [Crossref]
12. Ramu S, Acacio B,
Adamowicz M, Parrett S, Jeyendran RS (2011) Human chorionic gonadotropin from
day 2 spent embryo culture media and its relationship to embryo development. Fertil
Steril 96: 615-617. [Crossref]
13. Woodward BJ, Lenton
EA, Turner K (1993) Human chorionic gonadotrophin: embryonic secretion is a
time dependent phenomenon. Hum Reprod 8:1463-1468. [Crossref]
14. Ahmed AG, Klopper A (1983) Diagnosis of early pregnancy by assay of placental proteins. Br J Obstet Gynaecl 90: 604-611. [Crossref]
15. Lopata A, Oliva K, Stanton PG, Robertson DM (1997) Analysis of chorionic gonadotropin secreted by cultured human blastocysts. Mol Hum Reprod 3: 517-521. [Crossref]