Cardiovascular Risk Factors Impact on the Severity of Coronary Artery Disease among Acute ST-Elevation Myocardial Infarction Patients in the United Arab Emirates
A B S T R A C T
Objective: To define the impact of the cardiovascular risk factors on the extent of Coronary Artery Disease in STEMI patients and to identify the common prevalent risk factors that are unrecognized or poorly treated resulting in STEMI among the UAE population.
Methods: Retrospective cohort on patients presented to Mediclinic City Hospital from 2011-2016 who underwent Primary Percutaneous Coronary Intervention (PCI) for confirmed ST-Elevation Myocardial Infarction (STEMI).
Results: Of the total 104 STEMI patients, 91% were males. Mean (+SD) of 53 (+12.5) years of age. 73% were less than 60 years old. The most prevalent risk factor was hypertension (42%). 38% of diabetics had an HbA1C of >7%. 14% of the dyslipidemic had above target lipid levels in spite of Statin. 100% of the study population had at least 1 risk factor, ≥2 risk factors (97%), ≥3 risk factors (82%). 50% had 1 or more incidental risk factors diagnosed after admission. Dyslipidemia (36%) was the commonest incidental risk factor. The total risk factor counts increased significantly when the incidental or poorly treated risk factors were added to the initial risk factors on admission. Anterior Wall STEMI (38%) was the commonest. Left Anterior Descending Coronary Artery (48%) was the commonest culprit vessel. The majority had Triple Vessel Disease (37%). 37% developed in-hospital complications. Multivessel disease patients had more risk factors than in single-vessel disease but the association between the number of risk factors and disease severity was not statistically significant. The odds of multivessel disease increased with cumulative risk factor categories, but there was no significant trend association.
Conclusion: Our study attempted to determine the impact of CVD risk factors on the severity of CAD among STEMI patients who underwent primary PCI. Contrary to other studies, there was no statistical difference noted in the prevalence of CVD risk factors between the single-vessel and multivessel disease. The study did prove that the incidental or under-diagnosed or inadequately treated risk factors had an impact on the severity of CAD. The study stress that every single CVD risk factor should be treated with equal importance. Statistically significant associations need to be confirmed in future studies with a larger number of patients.
Keywords
CVD, risk factors, STEMI, PCI, CAD severity, UAE, retrospective study
Introduction
I Background and Rationale
Cardiovascular Disease (CVD) has emerged as the leading cause of morbidity and mortality. World Health Organization (WHO) data reveals an annual mortality of 17.9 million due to CVD [1, 2]. Based on the INTERHEART case-control study, almost 90% of CVD can be prevented by lifestyle changes [3]. The higher the risk factors present, the poorer is the prognosis of CVD. The burden of CVD on life years lost, reduced quality of life and increased healthcare costs all have a huge impact on the economy of any country [4]. CVD risk factors are broadly classified as traditional and non-traditional. As per the United States Preventive Services Task Force, there is only a little evidence to assess the balance of benefits and harm using non-traditional risk factors [5]. Smoking, high blood pressure, obesity and dyslipidemia are among the top traditional risk factors for premature morbidity and mortality [6]. The severity of the CVD is directly proportional to the number of risk factors present. The degree of impact and the prognosis of the disease depend on the duration and the severity of these CVD risk factors [7]. Patients with a strong family history of premature coronary artery disease have a more serious disease progression when compared to patients without a significant family history [8]. Glycosylated Haemoglobin (HbA1C) is strongly associated with the progression and prognosis of coronary artery disease [9]. A large study in the Middle East studied the impact of CVD risk factors based on the type of ACS (STEMI or NSTEMI), age, and gender of the patient. The study also revealed the cumulative impact of CVD risk factors [10]. A systematic review of the Middle Eastern population showed that obesity, diabetes, hypertension, and smoking were the top CVD risk factors [11]. Due to marked changes over time in the dietary habits in the Middle East, which currently includes a high-calorie fatty food intake and a sedentary lifestyle, there is an increased prevalence of obesity and metabolic syndrome [12, 13].
II Demographic Profile of UAE
The demography of the UAE is extremely diverse. As per the Worldometer/United Nations data, the estimated total population as of 2020 is around 9.9 Million [14]. Emiratis constitute around 11% of the population and 89% are expatriates. Over 50% are South Asians, of which the majorities are Indians [15]. Many patients present with acute STEMI as their first point of contact with a healthcare facility. Some patients know that they have risk factors but are reluctant to continue with medications.
III Objectives
To study the impact of CVD risk factors on the extent and severity of CAD was the main objective. The study helped to identify the common prevalent and unrecognized or inadequately treated CVD risk factors resulting in STEMI in the UAE.
Methods
I Study Design
Retrospective cohort study.
II Setting
The study was conducted at Mediclinic City Hospital Dubai. It is a 229 bedded multi-disciplinary hospital and is one of the largest private hospitals in the region.
III Participants
i Inclusion Criteria
Patients who underwent emergency Primary Percutaneous Coronary Intervention (PCI) for confirmed STEMI as per the universal definition at Mediclinic City Hospital between 01/01/2011-31/12/2016 were considered for the study [16].
ii Exclusion Criteria
Patients underwent Coronary Angiogram or Coronary Intervention at Mediclinic City Hospital during the study period, who presented with signs and symptoms of ACS, but with ECG findings suggestive of Non-STEMI (NSTEMI) or Unstable Angina.
IV Variables
Age, sex, ethnicity, smoking, diabetes, hypertension, hyperlipidemia, renal disease, hypothyroidism, body mass index (BMI), family history of premature coronary artery disease, ECG findings, peak Troponin I, fasting blood glucose, fasting lipid profile, haemoglobin (Hb), glycosylated haemoglobin (HbA1C), in-hospital course after PCI, post-discharge follow-up, re-infarction, door to balloon time, coronary angiography findings, incidental risk factors newly diagnosed on admission.
V Data Sources/Measurement
Data was collected from the Electronic Medical Record (EMR) and entered into a data collection form. The results were then entered into a Microsoft Excel® Spread Sheet. All data were collected using good clinical and good laboratory practice. As this was a retrospective study, the data collected from the EMR was reliable.
VI Patient Confidentiality
Patient confidentiality was well maintained as the data was secure within the EMR. All study documents and materials were saved on the primary investigator’s computer and cannot be accessed by non-authorized individuals. Study materials and documentation were also be monitored regularly as per the International Conference on Harmonization of Technical Requirements for Registration of Pharmaceuticals for Human Use (ICH) of Good Clinical Practice (GCP) guidelines. Under the data protection act, all data were anonymized (Link).
VII Bias
Information bias where sicker patients tend to recall risk factors more clearly if they are diseased, and recording bias where clinicians tend to register abnormal findings more often than normal ones, subject to confounding, cannot determine causation, only association. This was a single-center study with small sample size.
VIII Study Size
104 patients.
IX Quantitative Variables
For patients who did not have a history of diabetes, an HbA1C of more than or equal to 6.5 was used to diagnose incidental diabetes as per the American Diabetes Association clinical practice guidelines. The patient's fasting lipid profiles were checked within 24 hours of admission and categorized based on the National Cholesterol Education Program (NCEP) clinical practice guidelines. The reference value for a normal Troponin I is less than 0.02 ng/mL. Family history was considered significant if there is any 1st degree relative with premature CAD. Door to balloon times was classified as less than 90 mins and more than 90 mins. Coronary angiography findings were based upon visually estimating the percentage of luminal narrowing of the coronary tree including the culprit vessel. The severity was then calculated based on the number of coronary arteries that had more than 50-70% stenosis, the number of culprit vessels causing the STEMI, and the in-hospital complications status post STEMI.
X Data Management and Analysis Plan
The validated data was summarized to compare variables, identify the relationship and differences between variables to forecast the outcomes. Statistical analysis for analysing individual variables and relationships will be conducted using statistical averages, measures of deviation, and regression analysis. Preliminary analysis for averages, and simple linear regression and multiple regressions using least squares will be conducted with Microsoft Excel®. However, SAS statistical application will also be used to do intricate and finalize the clinical study.
XI Statistical Methods
The data collected was scrutinized for the format, standard units and validated before the analysis. We abstracted demographic data, CVD risk factors, lipid indices, ECG findings, and complications. Disease severity and the study's outcome were measured in terms of the number of diseased major coronary vessels and the presence of in-hospital complications. We dichotomized continuous data to delineate groups with or without the characteristic of interest. Patient characteristics were reported as means and standard deviations for continuous data and percentages for categorical data. Association between CVD risk factors and demographic variables were studied using the chi-square test or Fisher's exact test, where applicable. We calculated odds ratios (OR) and 95% confidence intervals (CI) to demonstrate the strength of association between risk factors and disease severity. An OR of more than 1.5 was considered clinically significant. To test the cumulative effect of age and the number of risk factors on disease severity, we used the chi-square test for linear trend. A p-value of 0.05 or less was considered statistically significant.
Results
I Descriptive Data
Patients were predominantly male. Their ages ranged from 26 to 102 years, with a mean (+SD) of 53 +12.5 years. 73% of the study population was less than 60 years old. The majority of the study population was Indian (34.6%), followed by UAE (19.2%).
II Clinical Profile
85% were overweight and or obese with a BMI of 25 and above. 28% were obese with a BMI of 30 and above. Asians represented 55% of the obese group, followed by MENA (31%), of which Emiratis were 20%. Among the overweight group, Asians represented 57.6%, followed by MENA (29.6%). 30% of Emiratis and Asians were obese. 55% of Asians were overweight, followed by MENA (41%), of which Emiratis (30%). Hypertension was the most prevalent risk factor (42%), followed by smoking (37%), dyslipidemia (37%), positive family history of coronary artery disease (29%), diabetes (26%), previous cardiac history (15%). 48% had metabolic syndrome. Risk factors prevalence distribution was calculated for all the risk factors and plotted below (Figure 1).
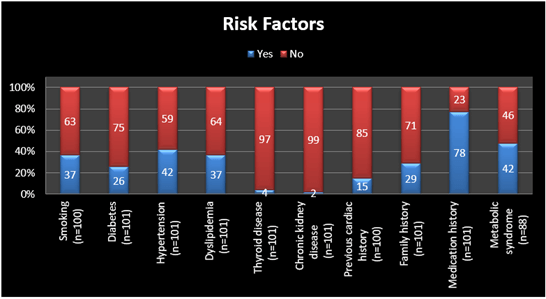
Figure 1: Risk factors prevalence distribution.
III CVD Risk Factor Count on Admission
All patients in the study had at least 1 risk factor. Only 3% of the study group had only 1 risk factor, 97% had 2 or more risk factors, 82% had 3 or more risk factors, 48% had 4 or more risk factors and 28% had 5 or more risk factors. Then we divided them into 2 groups with regards to the number of risk factors present as <3 and >3 risk factors.
IV Incidental and Poorly Treated Risk Factors
Almost half (50 of 102) had incidental risk factors diagnosed after admission. The most common incidental risk factors were dyslipidemia (36%), diabetes (30%), and hypertension (16%). 38% of diabetics in the study group had an uncontrolled glucose level with an HbA1C of > 7%. 10% of the 50 patients had an increased risk of diabetes with an HbA1C of 5.7-6.4%. Despite statin therapy, 14% of the dyslipidemic had abnormal lipid profiles.
V Total Risk Factors Count
The risk factors present on admission were then added to the incidental risk factors diagnosed to compute the total risk factors present in each patient. The number of patients who had 1 risk factor was reduced from 3 to 2. The number of patients who had 2 risk factors was also reduced from 16 to 1 which is telling us that 15 patients of those who had only 1 risk factor on admission had 1 more incidental risk factor diagnosed while in hospital. The number of patients who had 3 risk factors was also reduced from 35 to 5, telling us those 30 patients who had 3 risk factors on admission ended up having 4 or more risk factors due to the addition of incidental risk factors in the hospital. Patients who had 5 or more risk factors rose from 29 to 82 (Figure 2).
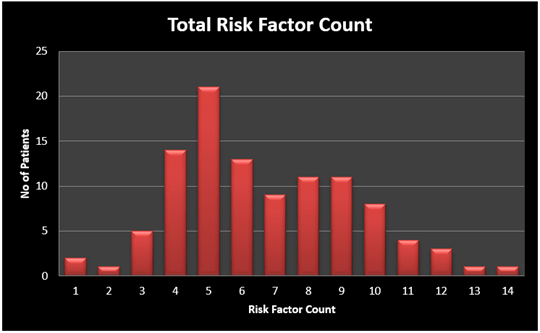
Figure 2: Total risk factor count.
The commonest culprit vessel was Left Anterior Descending (LAD) 48%, followed by Right Coronary Artery (RCA) 27%, and Left Circumflex Artery (LCx) 20%. The disease severity was then studied based on various factors including the number of vessels affected, in-hospital complications. This was then compared with various risk factors and biochemical parameters. A final analysis was done on the total number of risk factors with regards to the severity of CAD. 32% had Single Vessel Disease, 31% had Two Vessel Disease and 37% had Triple Vessel Disease. There were differences among these three groups with Single, Double, and three-vessel disease in terms of risk factors, but these could not be evaluated statistically as there were too few patients to allow chi-square analyses. Hence, we re-classified disease severity into two groups: a single vessel (32%) and multivessel disease (68%).
Main Results
CVD risk factors were higher in multivessel disease when compared to single-vessel disease, except for hypertension, thyroid disease and previous cardiac disease. Likewise, all risk factors had higher odds of multivessel disease, apart from hypertension, thyroid disease, and previous cardiac disease (Figure 3). However, there was no statistical significance noted between the risk factors and disease severity (Table 1). We employed a chi-square test for a trend to determine whether a progressive increase in age, BMI, lipid indices, and risk factor count was associated with an increased likelihood of multivessel disease. For risk factor count on admission, we considered age, BMI, smoking, and the presence of diabetes, hypertension, dyslipidemia, thyroid disease, chronic kidney disease, previous cardiac disease, family history, and medication history. Incidental findings were added to the risk factor count which includes uncontrolled lipids and the presence of the same risk factor diseases which were not apparent on admission. Though there was an increase in odds of multivessel disease with regards to cumulative risk factors, there was no significant trend association noted (Table 2).
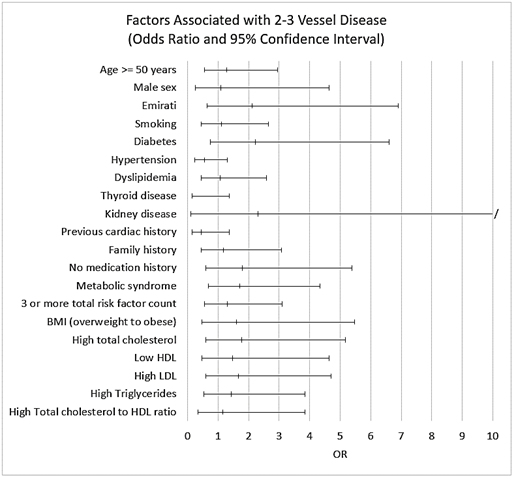
Figure 3: Odds Ratio and 95% Confidence Interval of risk factors with multivessel disease.
Table 1: Risk factor prevalence and odds ratios by disease severity.
|
Risk Factor |
Single Vessel Disease |
Multivessel Disease |
p |
Odds Ratios (95% Confidence Interval) |
|||
|
% |
n |
% |
n |
||||
|
Age 50 years & over |
55% |
33 |
61% |
71 |
0.56 |
1.3 |
(0.6-2.9) |
|
Male sex |
91% |
33 |
92% |
71 |
1.00 |
1.1 |
(0.2-4.6) |
|
Emirati |
12% |
33 |
23% |
71 |
0.21 |
2.1 |
(0.6-6.9) |
|
Smoking |
35% |
31 |
38% |
69 |
0.83 |
1.1 |
(0.5-2.7) |
|
Diabetes |
16% |
31 |
30% |
70 |
0.14 |
2.2 |
(0.7-6.6) |
|
Hypertension |
52% |
31 |
37% |
70 |
0.17 |
0.5 |
(0.2-1.3) |
|
Dyslipidemia |
35% |
31 |
37% |
70 |
0.87 |
1.1 |
(0.4-2.6) |
|
Thyroid disease |
10% |
31 |
1% |
70 |
0.17 |
0.1 |
(0.1-1.4) |
|
Chronic kidney disease |
0% |
31 |
3% |
70 |
0.96 |
2.3 |
(0.1-49.3) |
|
Previous cardiac disease |
23% |
31 |
11% |
70 |
0.25 |
0.4 |
(0.1-1.4) |
|
Family history |
27% |
30 |
30% |
70 |
0.74 |
1.2 |
(0.4-3.1) |
|
No medication history |
16% |
31 |
26% |
70 |
0.29 |
1.8 |
(0.6-5.4) |
|
Metabolic syndrome |
38% |
26 |
52% |
62 |
0.26 |
1.7 |
(0.7-4.3) |
|
Overweight to obese BMI |
81% |
26 |
87% |
62 |
0.65 |
1.6 |
(0.5-5.5) |
|
High Total cholesterol |
25% |
24 |
37% |
54 |
0.30 |
1.8 |
(0.6-5.2) |
|
Low HDL |
75% |
24 |
81% |
54 |
0.71 |
1.5 |
(0.5-4.6) |
|
High LDL |
29% |
24 |
41% |
54 |
0.33 |
1.7 |
(0.6-4.7) |
|
High triglycerides |
38% |
24 |
46% |
54 |
0.47 |
1.4 |
(0.5-3.8) |
|
High total cholesterol-HDL ratio |
79% |
24 |
81% |
54 |
1.00 |
1.2 |
(0.3-3.8) |
|
3 or more risk factor count on admission |
79% |
33 |
83% |
71 |
0.60 |
1.3 |
(0.5-3.7) |
|
3 or more total risk factor count |
88% |
33 |
93% |
71 |
0.61 |
1.8 |
(0.5-7.3) |
Table 2: Odds of multivessel disease by age, BMI, lipid indices and risk factor count.
|
Risk Factor |
Single / Multivessel Disease (No.) |
Odds Ratios (95% Confidence Interval) |
Trend p |
|
|
Age in years |
|
|
|
0.18 |
|
<40 |
5 / 7 |
1.0 |
|
|
|
40-49 |
10 / 21 |
1.5 |
(0.4-5.9) |
|
|
50-59 |
8 / 25 |
2.2 |
(0.6-9.0) |
|
|
60-69 |
7 / 11 |
1.1 |
(0.2-5.0) |
|
|
70 & over |
3 / 7 |
1.7 |
(0.8-9.8) |
|
|
BMI |
|
|
|
0.71 |
|
Normal (<25) |
5 / 8 |
1.0 |
|
|
|
Overweight (25-30) |
14 / 36 |
1.6 |
(0.4-5.8) |
|
|
Obese (>30) |
7 / 18 |
1.6 |
(0.4-6.6) |
|
|
Total cholesterol |
|
|
|
0.22 |
|
Normal (<5.18) |
18 / 34 |
1.0 |
|
|
|
Borderline high (5.18-6.19) |
5 / 11 |
1.2 |
(0.4-3.9) |
|
|
High (>=6.22) |
1 / 9 |
4.8 |
(0.6-40.6) |
|
|
LDL |
|
|
|
0.24 |
|
Normal (<3.34) |
17 / 32 |
1.0 |
|
|
|
Borderline high (3.35-4.12) |
5 / 10 |
1.1 |
(0.3-3.6) |
|
|
High (4.14-4.89) |
1 / 7 |
3.7 |
(0.4-32.8) |
|
|
Very high (>4.90) |
1 / 5 |
2.7 |
(0.3-24.6) |
|
|
Triglycerides |
|
|
|
0.72 |
|
Normal (<1.70) |
15 / 29 |
1.0 |
|
|
|
Borderline high (1.7-2.25) |
4 / 13 |
1.7 |
(0.5-6.1) |
|
|
High (>=2.26) |
5 / 12 |
1.2 |
(0.4-4.2) |
|
|
Total cholesterol-to-HDL ratio |
|
|
|
0.82 |
|
Normal (<4) |
5 / 10 |
1.0 |
|
|
|
High (4-6) |
13 / 28 |
1.1 |
(0.3-3.8) |
|
|
Very high (>6) |
6 / 16 |
1.3 |
(0.3-5.5) |
|
|
Risk factor count on admission |
|
|
|
0.24 |
|
1 |
2 / 1 |
1.0 |
|
|
|
2 |
5 / 11 |
4.4 |
(0.3-60.6) |
|
|
3 |
13 / 22 |
3.4 |
(0.3-41.1) |
|
|
4 |
5 / 16 |
6.4 |
(0.5-86.2) |
|
|
5 |
6 / 11 |
3.7 |
(0.3-49.3) |
|
|
>=6 |
2 / 10 |
10.0 |
(0.6-171.2) |
|
|
Total risk factor count |
|
|
|
0.06 |
|
1 |
1 / 1 |
1.0 |
|
|
|
2 |
3 / 4 |
1.3 |
(0.03-17.5) |
|
|
3 |
10 / 18 |
1.8 |
(0.1-32.0) |
|
|
4 |
9 / 13 |
1.4 |
(0.1-26.2) |
|
|
5 |
7 /15 |
2.1 |
(0.1-39.5) |
|
|
>=6 |
3 / 20 |
6.7 |
(0.3-137.4) |
|
Discussion
I Key Results
There was no linear increase in OR with regards to the cumulative effect of risk factors on admission (p=0.24), which indicates that whether the patient has 1 risk factor or 5 risk factors, the severity of CAD remains the same. The Odds Ratio was linear with the number of risk factors present (p=0.96). So, the chance of triple vessel disease in a patient who has only 1 risk factor is the same as the patient who has multiple risk factors. This says that every single risk factor should be treated with the same intensity as to someone who has multiple risk factors. This would have to be confirmed in a larger study. Interestingly when the incidental or under-treated risk factors diagnosed on admission were added to the total risk factor count, there is a linear increase in the Odds Ratio (p=0.06). The severity of CAD increased when the incidental risk factors were added to the risk factors reported on admission. This gives the importance of early screening, early detection of unrecognized or undertreated risk factors and initiates treatment early to prevent an acute coronary event. We found that there is an association between age and in-hospital complications. Patients aged 50 years and above were twice likely to have in-hospital complications (OR: 2.6, 95% CI 1.1-6.4) and this was statistically significant (p=0.03) (Table 3). This finding is consistent with several other studies [14, 15, 17-19].
Table 3: Risk factor prevalence and odds ratios by in-hospital complications.
|
Risk Factor |
No In-hospital Complication |
With In-hospital Complication |
p |
Odds Ratios (95% Confidence Interval) |
|||
|
% |
n |
% |
n |
||||
|
Age 50 years & over |
51% |
70 |
74% |
34 |
0.03 |
2.6 |
(1.1-6.4) |
|
Male sex |
93% |
70 |
88% |
34 |
0.66 |
1.1 |
(0.2-4.6) |
|
Emirati |
19% |
70 |
21% |
34 |
0.81 |
1.1 |
(0.4-3.2) |
|
Smoking |
37% |
67 |
36% |
33 |
0.93 |
1.0 |
(0.4-2.3) |
|
Diabetes |
24% |
67 |
29% |
34 |
0.55 |
1.3 |
(0.5-3.4) |
|
Hypertension |
40% |
67 |
44% |
34 |
0.71 |
1.2 |
(0.5-2.7) |
|
Dyslipidemia |
34% |
67 |
41% |
34 |
0.50 |
1.3 |
(0.6-3.1) |
|
Thyroid disease |
3% |
67 |
6% |
34 |
0.83 |
2.0 |
(0.3-15.1) |
|
Chronic kidney disease |
1% |
67 |
3% |
34 |
1.00 |
2.0 |
(0.1-33.0) |
|
Previous cardiac disease |
10% |
67 |
24% |
34 |
0.08 |
2.6 |
(0.9-8.0) |
|
Family history |
35% |
66 |
18% |
34 |
0.07 |
0.4 |
(0.1-1.1) |
|
No medication history |
25% |
67 |
18% |
34 |
0.38 |
0.6 |
(0.2-1.8) |
|
Metabolic syndrome |
50% |
60 |
43% |
28 |
0.53 |
0.8 |
(0.3-1.8) |
|
Overweight to obese BMI |
85% |
60 |
86% |
28 |
1.00 |
1.1 |
(0.3-3.8) |
|
High Total cholesterol |
39% |
54 |
21% |
24 |
0.12 |
0.4 |
(0.1-1.3) |
|
Low HDL |
78% |
54 |
71% |
24 |
0.34 |
0.5 |
(0.2-1.5) |
|
High LDL |
43% |
54 |
25% |
24 |
0.14 |
0.5 |
(0.1-1.31) |
|
High triglycerides |
46% |
54 |
38% |
24 |
0.47 |
0.7 |
(0.3-1.9) |
|
High total cholesterol-HDL ratio |
19% |
54 |
21% |
24 |
1.00 |
1.2 |
(0.3-3.8) |
|
3 or more risk factor count |
90% |
70 |
94% |
34 |
0.77 |
1.8 |
(0.3-9.1) |
II Limitations
As with other retrospective studies, our study might have information bias where sicker patients tend to recall risk factors more clearly if they are diseased, and recording bias where clinicians tend to register abnormal findings more often than normal ones, subject to confounding, cannot determine causation, only association. This was a single-center study with small sample size. The study would need to be repeated with a larger sample size before definitive conclusions could be drawn.
III Interpretation
In our study, there was almost a similar distribution for the number of vessels diseased or > 50% stenosis. Our finding was contrary to other studies that reported the highest incidence of single-vessel disease [19-22]. The prevalence of risk factors with regards to the severity of CAD was studied (Figure 4). As we can see, the prevalence of the top 9 risk factors is the same for single-vessel disease, triple vessel disease patients and in-hospital complications, telling us that there is no significant difference in the severity of CAD with regards to the prevalence of any particular risk factor in this population of STEMI patients. Therefore, each individual should be screened and even all and even single risk factors where possible must be aggressively treated to reduce their risk of STEMI. The CVRFs were recorded on admission to the hospital and studied against the number of coronary vessels involved. Later on, the same study was repeated after adding the incidental risk factors diagnosed while in the hospital. There was a significant increase in the proportion of people who had 3 or more risk factors with regards to all 3 groups. A dose-response relationship exists when the odds of multivessel disease increases (or decreases) with increasing levels of risk factors. We did not find any dose-response relationship for the multivessel disease. Some studies indicate an association [16]. Our study did not allow us to show such trends owing to the small number of patients.
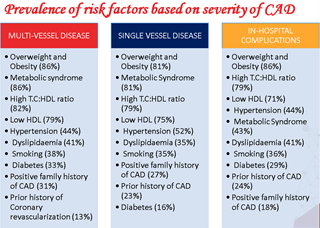
Figure 4: Prevalence of risk factors based on the severity of CAD.
Conclusion
Our present study attempted to determine the impact of CVD risk factors on the severity of CAD among STEMI patients who underwent primary PCI. Contrary to other studies, there was no statistical difference noted in the prevalence of CVD risk factors between the single-vessel and multi-vessel disease. There was no strong evidence relating to the number of risk factors to the number of vessels involved. The small sample size may have limited our ability to detect any association. The study did prove that the incidental or under-diagnosed or inadequately treated risk factors had an impact on the severity of CAD. Prompt risk stratification, early identification, and treatment are vital in preventing an Acute Coronary Syndrome. The study stress that every single CVD risk factor should be treated with equal importance. Statistically significant associations need to be confirmed in future studies with a larger number of patients.
Disclosure
Invited as a speaker to present this study at the 11th Annual Emirates Cardiac Society Conference held at Dubai, UAE in October 2020. Poster presentation of the study at EuroPrevent 2019 held in Lisbon, Portugal in April 2019. Poster presentation of the study at the 2019 American Society of Preventive Cardiology Congress on CVD Prevention held in San Antonio, Texas, USA in July 2019.
Funding
None.
Conflicts of Interest
None.
Ethical Consideration and Consent
Ethics approval was obtained from Mediclinic Research & Ethics Committee (REC) and Dubai Healthcare City Research & Ethics Committee. Following the Health Insurance Portability and Accountability Act of 1996 (HIPAA) Privacy requirements, a waiver of all elements of informed consent was therefore issued by Mediclinic REC.
Abbreviations
STEMI: ST-Elevation Myocardial Infarction
NSTEMI: Non-ST-Elevation Myocardial Infarction
ACS: Acute Coronary Syndrome
CVD: Cardiovascular Disease
PCI: Percutaneous Coronary Intervention
SD: Standard Deviation
CAD: Coronary Artery Disease
WHO: World Health Organization
UAE: United Arab Emirates
MENA: Middle East and Northern Africa
BMI: Body Mass Index
EMR: Electronic Medical Record
ICH: International Conference on Harmonization
GCP: Good Clinical Practice
NCEP: National Cholesterol Education Program
ECG: Electrocardiogram
CI: Confidence Interval
REC: Research and Ethics Committee
HIPAA: Health Insurance Portability and Accountability Act
LAD: Left Anterior Descending
RCA: Right Coronary Artery
LCx: Left Circumflex
Article Info
Article Type
Research ArticlePublication history
Received: Mon 15, Feb 2021Accepted: Mon 01, Mar 2021
Published: Mon 15, Mar 2021
Copyright
© 2023 Vijay Chander Vinod. This is an open-access article distributed under the terms of the Creative Commons Attribution License, which permits unrestricted use, distribution, and reproduction in any medium, provided the original author and source are credited. Hosting by Science Repository.DOI: 10.31487/j.JICOA.2021.01.12
Figures & Tables
Table 1: Risk factor prevalence and odds ratios by disease severity.
|
Risk Factor |
Single Vessel Disease |
Multivessel Disease |
p |
Odds Ratios (95% Confidence Interval) |
|||
|
% |
n |
% |
n |
||||
|
Age 50 years & over |
55% |
33 |
61% |
71 |
0.56 |
1.3 |
(0.6-2.9) |
|
Male sex |
91% |
33 |
92% |
71 |
1.00 |
1.1 |
(0.2-4.6) |
|
Emirati |
12% |
33 |
23% |
71 |
0.21 |
2.1 |
(0.6-6.9) |
|
Smoking |
35% |
31 |
38% |
69 |
0.83 |
1.1 |
(0.5-2.7) |
|
Diabetes |
16% |
31 |
30% |
70 |
0.14 |
2.2 |
(0.7-6.6) |
|
Hypertension |
52% |
31 |
37% |
70 |
0.17 |
0.5 |
(0.2-1.3) |
|
Dyslipidemia |
35% |
31 |
37% |
70 |
0.87 |
1.1 |
(0.4-2.6) |
|
Thyroid disease |
10% |
31 |
1% |
70 |
0.17 |
0.1 |
(0.1-1.4) |
|
Chronic kidney disease |
0% |
31 |
3% |
70 |
0.96 |
2.3 |
(0.1-49.3) |
|
Previous cardiac disease |
23% |
31 |
11% |
70 |
0.25 |
0.4 |
(0.1-1.4) |
|
Family history |
27% |
30 |
30% |
70 |
0.74 |
1.2 |
(0.4-3.1) |
|
No medication history |
16% |
31 |
26% |
70 |
0.29 |
1.8 |
(0.6-5.4) |
|
Metabolic syndrome |
38% |
26 |
52% |
62 |
0.26 |
1.7 |
(0.7-4.3) |
|
Overweight to obese BMI |
81% |
26 |
87% |
62 |
0.65 |
1.6 |
(0.5-5.5) |
|
High Total cholesterol |
25% |
24 |
37% |
54 |
0.30 |
1.8 |
(0.6-5.2) |
|
Low HDL |
75% |
24 |
81% |
54 |
0.71 |
1.5 |
(0.5-4.6) |
|
High LDL |
29% |
24 |
41% |
54 |
0.33 |
1.7 |
(0.6-4.7) |
|
High triglycerides |
38% |
24 |
46% |
54 |
0.47 |
1.4 |
(0.5-3.8) |
|
High total cholesterol-HDL ratio |
79% |
24 |
81% |
54 |
1.00 |
1.2 |
(0.3-3.8) |
|
3 or more risk factor count on admission |
79% |
33 |
83% |
71 |
0.60 |
1.3 |
(0.5-3.7) |
|
3 or more total risk factor count |
88% |
33 |
93% |
71 |
0.61 |
1.8 |
(0.5-7.3) |
Table 2: Odds of multivessel disease by age, BMI, lipid indices and risk factor count.
|
Risk Factor |
Single / Multivessel Disease (No.) |
Odds Ratios (95% Confidence Interval) |
Trend p |
|
|
Age in years |
|
|
|
0.18 |
|
<40 |
5 / 7 |
1.0 |
|
|
|
40-49 |
10 / 21 |
1.5 |
(0.4-5.9) |
|
|
50-59 |
8 / 25 |
2.2 |
(0.6-9.0) |
|
|
60-69 |
7 / 11 |
1.1 |
(0.2-5.0) |
|
|
70 & over |
3 / 7 |
1.7 |
(0.8-9.8) |
|
|
BMI |
|
|
|
0.71 |
|
Normal (<25) |
5 / 8 |
1.0 |
|
|
|
Overweight (25-30) |
14 / 36 |
1.6 |
(0.4-5.8) |
|
|
Obese (>30) |
7 / 18 |
1.6 |
(0.4-6.6) |
|
|
Total cholesterol |
|
|
|
0.22 |
|
Normal (<5.18) |
18 / 34 |
1.0 |
|
|
|
Borderline high (5.18-6.19) |
5 / 11 |
1.2 |
(0.4-3.9) |
|
|
High (>=6.22) |
1 / 9 |
4.8 |
(0.6-40.6) |
|
|
LDL |
|
|
|
0.24 |
|
Normal (<3.34) |
17 / 32 |
1.0 |
|
|
|
Borderline high (3.35-4.12) |
5 / 10 |
1.1 |
(0.3-3.6) |
|
|
High (4.14-4.89) |
1 / 7 |
3.7 |
(0.4-32.8) |
|
|
Very high (>4.90) |
1 / 5 |
2.7 |
(0.3-24.6) |
|
|
Triglycerides |
|
|
|
0.72 |
|
Normal (<1.70) |
15 / 29 |
1.0 |
|
|
|
Borderline high (1.7-2.25) |
4 / 13 |
1.7 |
(0.5-6.1) |
|
|
High (>=2.26) |
5 / 12 |
1.2 |
(0.4-4.2) |
|
|
Total cholesterol-to-HDL ratio |
|
|
|
0.82 |
|
Normal (<4) |
5 / 10 |
1.0 |
|
|
|
High (4-6) |
13 / 28 |
1.1 |
(0.3-3.8) |
|
|
Very high (>6) |
6 / 16 |
1.3 |
(0.3-5.5) |
|
|
Risk factor count on admission |
|
|
|
0.24 |
|
1 |
2 / 1 |
1.0 |
|
|
|
2 |
5 / 11 |
4.4 |
(0.3-60.6) |
|
|
3 |
13 / 22 |
3.4 |
(0.3-41.1) |
|
|
4 |
5 / 16 |
6.4 |
(0.5-86.2) |
|
|
5 |
6 / 11 |
3.7 |
(0.3-49.3) |
|
|
>=6 |
2 / 10 |
10.0 |
(0.6-171.2) |
|
|
Total risk factor count |
|
|
|
0.06 |
|
1 |
1 / 1 |
1.0 |
|
|
|
2 |
3 / 4 |
1.3 |
(0.03-17.5) |
|
|
3 |
10 / 18 |
1.8 |
(0.1-32.0) |
|
|
4 |
9 / 13 |
1.4 |
(0.1-26.2) |
|
|
5 |
7 /15 |
2.1 |
(0.1-39.5) |
|
|
>=6 |
3 / 20 |
6.7 |
(0.3-137.4) |
|
Table 3: Risk factor prevalence and odds ratios by in-hospital complications.
|
Risk Factor |
No In-hospital Complication |
With In-hospital Complication |
p |
Odds Ratios (95% Confidence Interval) |
|||
|
% |
n |
% |
n |
||||
|
Age 50 years & over |
51% |
70 |
74% |
34 |
0.03 |
2.6 |
(1.1-6.4) |
|
Male sex |
93% |
70 |
88% |
34 |
0.66 |
1.1 |
(0.2-4.6) |
|
Emirati |
19% |
70 |
21% |
34 |
0.81 |
1.1 |
(0.4-3.2) |
|
Smoking |
37% |
67 |
36% |
33 |
0.93 |
1.0 |
(0.4-2.3) |
|
Diabetes |
24% |
67 |
29% |
34 |
0.55 |
1.3 |
(0.5-3.4) |
|
Hypertension |
40% |
67 |
44% |
34 |
0.71 |
1.2 |
(0.5-2.7) |
|
Dyslipidemia |
34% |
67 |
41% |
34 |
0.50 |
1.3 |
(0.6-3.1) |
|
Thyroid disease |
3% |
67 |
6% |
34 |
0.83 |
2.0 |
(0.3-15.1) |
|
Chronic kidney disease |
1% |
67 |
3% |
34 |
1.00 |
2.0 |
(0.1-33.0) |
|
Previous cardiac disease |
10% |
67 |
24% |
34 |
0.08 |
2.6 |
(0.9-8.0) |
|
Family history |
35% |
66 |
18% |
34 |
0.07 |
0.4 |
(0.1-1.1) |
|
No medication history |
25% |
67 |
18% |
34 |
0.38 |
0.6 |
(0.2-1.8) |
|
Metabolic syndrome |
50% |
60 |
43% |
28 |
0.53 |
0.8 |
(0.3-1.8) |
|
Overweight to obese BMI |
85% |
60 |
86% |
28 |
1.00 |
1.1 |
(0.3-3.8) |
|
High Total cholesterol |
39% |
54 |
21% |
24 |
0.12 |
0.4 |
(0.1-1.3) |
|
Low HDL |
78% |
54 |
71% |
24 |
0.34 |
0.5 |
(0.2-1.5) |
|
High LDL |
43% |
54 |
25% |
24 |
0.14 |
0.5 |
(0.1-1.31) |
|
High triglycerides |
46% |
54 |
38% |
24 |
0.47 |
0.7 |
(0.3-1.9) |
|
High total cholesterol-HDL ratio |
19% |
54 |
21% |
24 |
1.00 |
1.2 |
(0.3-3.8) |
|
3 or more risk factor count |
90% |
70 |
94% |
34 |
0.77 |
1.8 |
(0.3-9.1) |
References
1. GBD 2015 Mortality and Causes of Death Collaborators (2016) Global, regional, and national life expectancy, all-cause mortality, and cause-specific mortality for 249 causes of death, 1980-2015: a systematic analysis for the Global Burden of Disease Study 2015. Lancet 388: 1459-1544. [Crossref]
2. World Health Organization (2020) Cardiovascular diseases. WHO.
3. Yusuf S, Hawken S, Ounpuu S, Dans T, Avezum A et al. (2004) Effect of potentially modifiable risk factors associated with myocardial infarction in 52 countries (the INTERHEART study): case-control study. Lancet 364: 937-952. [Crossref]
4. Lloyd Jones D, Adams R, Carnethon M, De Simone G, Ferguson TB et al. (2009) Heart disease and stroke statistics--2009 update: a report from the American Heart Association Statistics Committee and Stroke Statistics Subcommittee. Circulation 119: e21-181. [Crossref]
5. U.S. Preventive Services Task Force (2009) Using nontraditional risk factors in coronary heart disease risk assessment: U.S. Preventive Services Task Force recommendation statement. Ann Intern Med 151: 474-482. [Crossref]
6. El Menyar A, Amin H, Rashdan I, Souliman K, Deleu D et al. (2009) Ankle-brachial index and extent of atherosclerosis in patients from the Middle East (the AGATHA-ME study): a cross-sectional multicenter study. Angiology 60: 329-334. [Crossref]
7. Mihalopoulos NL, Berenson GS (2008) Cardiovascular risk factors among internal medicine residents. Prev Cardiol 11: 76-81. [Crossref]
8. Gaeta G, De Michele M, Cuomo S, Guarini P, Foglia M et al. (2000) Arterial abnormalities in the offspring of patients with premature myocardial infarction. N Engl J Med 343: 840-846. [Crossref]
9. Timmer JR, Hoekstra M, Nijsten MW, van der Horst IC, Ottervanger JP et al. (2011) Prognostic value of admission glycosylated hemoglobin and glucose in nondiabetic patients with ST-segment-elevation myocardial infarction treated with percutaneous coronary intervention. Circulation 124: 704-711. [Crossref]
10. El Menyar A, Zubaid M, Shehab A, Bulbanat B, Albustani N et al. (2011) Prevalence and impact of cardiovascular risk factors among patients presenting with acute coronary syndrome in the middle East. Clin Cardiol 34: 51-58. [Crossref]
11. Motlagh B, O'Donnell M, Yusuf S (2009) Prevalence of cardiovascular risk factors in the Middle East: a systematic review. Eur J Cardiovasc Prev Rehabil 16: 268-280. [Crossref]
12. Musaiger AO (2004) Overweight and obesity in the Eastern Mediterranean Region: can we control it? East Mediterr Health J 10: 789-793. [Crossref]
13. Kokkinos P, Myers J, Kokkinos JP, Pittaras A, Narayan P et al. (2008) Exercise capacity and mortality in black and white men. Circulation 117: 614-622. [Crossref]
14. United Arab Emirates Population (LIVE). (n.d.).
15. Aadhar R et al. (2017) ‘UAE Population by Nationality’ Abu Dhabi - Information Portal.
16. Mishra TK, Das B (2016) ST segment elevated acute myocardial infarction: Changing profile over last 24 years. J Assoc Phys India 64: 28-34. [Crossref]
17. Bundhun PK, Wu ZJ, Chen MH (2015) Impact of modifiable cardiovascular risk factors on mortality after percutaneous coronary intervention: A Systematic Review and Meta-Analysis of 100 Studies. Medicine 94: e2313. [Crossref]
18. Becker RC, Burns M, Gore JM, Spencer FA, Ball SP et al. (1998) Early assessment and in-hospital management of patients with acute myocardial infarction at increased risk for adverse outcomes: a nationwide perspective of current clinical practice. The National Registry of Myocardial Infarction (NRMI-2) Participants. Am Heart J 135: 786-796. [Crossref]
19. Jamil G, Jamil M, Alkhazraji H, Haque A, Chedid F et al. (2013) Risk factor assessment of young patients with acute myocardial infarction. Am J Cardiovasc Dis 3: 170-174. [Crossref]
20. Bhardwaj R, Kandoria A, Sharma R (2014) Myocardial infarction in young adults-risk factors and pattern of coronary artery involvement. Niger Med J 55: 44-47. [Crossref]
21. Callachan EL, Alsheikh Ali AA, Wallis LA (2017) Analysis of risk factors, presentation, and in-hospital events of very young patients presenting with ST-elevation myocardial infarction. J Saudi Heart Assoc 29: 270-275. [Crossref]
22. Deora S, Kumar T, Ramalingam R, Nanjappa Manjunath C (2016) Demographic and angiographic profile in premature cases of acute coronary syndrome: analysis of 820 young patients from South India. Cardiovasc Diagn Ther 6: 193-198. [Crossref]