Targeting UCP2 Suppresses the FAK Signaling and Progression of Human Head and Neck Cancer Cells
A B S T R A C T
Background: New adjuvant therapies for human head and neck (H&N) cancer to improve the quality of life of the patients are in great demand. Our early studies have demonstrated that uncoupling protein 2 (UCP2) is upregulated in the tumor tissues of H&N cancer compared to the adjacent normal tissues; however, the role of UCP2 in H&N cancer has not been studied.
Objective: In this manuscript, we aim to examine whether UCP2 contributes to H&N cancer progression in vitro.
Methods: We generated UCP2 stable knockdown H&N cancer cells and detected the effects of UCP2 inhibition on cell proliferation, migration, invasion, 3D spheroid formation, and the sensitivity to a chemo-drug treatment.
Results: Knockdown of UCP2 suppressed the progression of H&N cancer in vitro, which might be mediated via the following mechanism: 1) increased the G1 phase whereas decreased the S phase of the cell cycle, which could be mediated by suppression of the G1/S regulators including CDK4/6 and cyclin D1. 2) Decreased mitochondrial oxygen consumption, ATP production, and lactate formation, which is consistent with the downregulation of c-Myc. 3) FAK may serve as the upstream signaling molecule, and its action was mediated by Akt and ERK.
Conclusions: Our studies first demonstrate that targeting UCP2 may suppress H&N cancer progression in vitro.
Keywords
UCP2, H&N cancer, cancer metabolism, cell cycle, FAK
Introduction
Human head and neck (H&N) cancers are mostly squamous cell carcinomas that originated from the linings of the moist, mucosal surfaces inside of the head and neck. There are approximately 60,000 new cases of H&N cancer every year in the US, according to the American Cancer Society. Surgery, radiation therapy, and chemotherapy are the three major treatments for H&N cancer, and patients suffer from painful side effects, such as difficulty in swallowing, therefore impacting the quality of life of these patients. Furthermore, new adjuvant or targeted therapies are greatly needed.
Alcohol and smoking are the two major risk factors for H&N cancer, and studies have shown that both alcohol and smoking can induce the expression of uncoupling protein 2 (UCP2), which seems to provide tolerance [1, 2]. Knowing that UCP2 is often highly expressed in human cancers, including H&N cancers, we hypothesize that UCP2 may promote H&N cancer development [3].
Most of the cell’s redox reactions take place in mitochondria, which supply cellular energy by oxidizing the major product of glucose, pyruvate. Substrate oxidation in cellular respiration generates a proton gradient across the mitochondrial inner membrane that establishes the electrochemical potential (Δψm). The energy contained in Δψm is mainly used for ATP synthesis. However, not all the energy available in the electrochemical gradient is coupled to this process. Some of the energy is consumed by “proton leak” reactions. As a result, the energy derived from metabolic oxidation is dissipated as heat. This phenomenon is named "mitochondrial uncoupling". Mitochondrial uncoupling is caused mainly by uncoupling proteins (UCPs) at physiological conditions. There are five isoforms of UCPs: UCP1 is uniquely present in mitochondria of brown adipocytes; UCP2 is ubiquitous; UCP3 is mainly expressed in skeletal muscles, and UCP4 and UCP5 are brain-specific [4].
During cancer development, cancer cells evolve to adjust to their environment and growth needs. For instance, it has been suggested that high levels of mitochondrial uncoupling provide a prosurvival advantage to cancer cells. This prosurvival advantage is accomplished via two mechanisms: attenuating superoxide generation and reprogramming of cancer cell metabolism [5]. Therefore, targeting UCP2 may cause metabolic and oxidative stress to cancer cells, leading to cell death.
The deregulated cell cycle is a major driver pathway in both HPV negative and HPV positive H&N cancer [6]. The tumor suppressor p53 is often inactivated in H&N cancer, leading to lost expression of CDK (cyclin-dependent kinase) inhibitors such as p16 and p21. CDKs (4 and 6) become constitutively active, which phosphorylate Rb leading to its degradation and releasing the cell cycle transcription factor E2F [6].
FAK (focal adhesion kinase), a non-receptor tyrosine kinase, is highly expressed in human H&N cancer, and it promotes cell motility, survival, and proliferation through kinase-dependent and independent mechanisms [7, 8]. Akt and ERK are two of the targets of FAK, and both play a contributing role in H&N cancer tumorigenesis [8, 9]. Inhibition of FAK decreases Akt and ERK phosphorylation and sensitizes H&N cancer cells to radiation therapy [9].
Although highly expressed UCP2 has been reported in H&N cancers, there is no study demonstrating whether UCP2 contributes to H&N cancer progression. Herein, two widely used H&N cancer cells FaDu and UPCI: SCC040 were employed, and UCP2 was genetically downregulated to study the role of UCP2 in H&N cancer cell growth.
Materials and Methods
I Cell Lines and Reagents
Human head & neck (H&N) cancer cell line FaDu (hypopharynx) and UPCI: SCC040 (tongue) cells were used. FaDu cells were obtained from the American Type Culture Collection (Manassas, VA, USA). SCC040 cells were obtained from Susanne M. Gollin, Ph.D., University of Pittsburgh [10]. Both cell lines were grown in EMEM medium supplemented with 10% FBS, NEAA (non-essential amino acids), L-glutamine, sodium pyruvate, and antibiotics. UCP2 siRNA/shRNA/RNAi lentivirus (LVPi026640) and scramble siRNA lentivirus (LVP015G) were purchased from Applied Biological Materials (Richmond, BC, Canada). Both vectors contain a GFP tag for screening.
II Establishment of UCP2 Stable Knockdown (KD) H&N Cancer Cells
FaDu and SCC040 cells were seeded in 24-well plates (20,000 per well). The next day cell infection mixture was prepared as the following: in the 1-ml culture medium, 10 MOI lentivirus was added, followed by 2 µl polybrene (stock concentration: 4 µg/µl). The cell culture medium was removed and replaced with the cell infection mixture. 24 h later, the infection mixture was replaced with fresh culture medium, and cells were incubated for 24 h before puromycin (final concentration: 1 µg/ml) containing medium was added. Clonal selection lasted for 12 days with puromycin medium replaced once every three days. The scramble siRNA infected clones were enriched via flow sorting of GFP-positive cells and collected as bulk, and UCP2 stable knockdown clone was collected as a single cell. These single cells were expanded, and Western blot analysis was performed to select the UCP2 KD clones.
III Cell Proliferation Assays
2,500 H&N cells were seeded in 96-well plates (Corning 353072) for cell proliferation assay, which was performed using the IncuCyte live-cell system (Essen BioScience, Ann Arbor, MI, USA). The cells were imaged every 4 h, and the proliferation rates based on confluency were determined using the IncuCyte software.
IV Anchorage-Independent Growth Assay
Soft agar-based anchorage-independent growth assay was carried out in six-well plates. For each well, the bottom layer consisted of 2.5 ml of 0.5% agar in the growth medium. 0.75 ml of 0.33% agar containing a total of 3x10⁴ H&N cancer cells were layered on top. After ten days of incubation, colonies were stained with Neutral Red and counted.
V Cell Cycle Analysis
H&N cancer cells were seeded and incubated overnight, then starved in serum-free medium for 24 h. Cells were collected, fixed in 70% ethanol, and stained with propidium iodide and subjected to florescence-activated cell sorting analysis using a BD Biosciences flow cytometer.
VI Preparation of Whole Cell Lysate
Collected cell pellets were suspended in RIPA containing a proteinase inhibitor cocktail (EMD Millipore, La Jolla, CA). Cells were sonicated on ice for three strokes (10 sec per stroke) using a Fisher Sonic Dismembrator (Model 100, Scale 2). After incubating on ice for 30 min, cell lysate was centrifuged at 14,000 x g for 25 min, and the supernatant was collected and designated as Whole Cell Lysate.
VII Cell Migration and Invasion Assay
For migration (wound-healing) assay, 50,000 H&N cancer cells were seeded into a 96-well plate (Essen 4379). The next day wound was created by the Woundmaker (Essen BioScience), cells were washed with serum-free medium, and fresh culture medium was added. Cells were incubated in the IncuCyte Essen Bioscience Incubator for three days. Images were taken every 4 h. For invasion (transwell migration) assay, transwell inserts (Corning 3422) were coated with 50 µg/ml collagen. 50,000 H&N cancer cells were suspended in a serum-free medium, and 100 µl of the cell suspension was transferred to the inserts, and 600 µl complete growth medium was added to the bottom wells. Cells were cultured for 16 h; inserts were removed, fixed, and stained with crystal violet.
VIII 3D Spheroid Formation Assay
25,000 H&N cancer cells were seeded in a 96-well round-bottom clear cell repellent plate (Greiner, Stroudwater, UK) in growth media supplemented with 5 % Matrigel. Culture plates were centrifuged at 600 × g for 5 min and incubated in the IncuCyte Essen Bioscience Incubator for three days. The images of the spheroids were taken using a fluorescence microscope and analyzed using the Adobe Photoshop software. The volume of the spheroid was calculated using the following formula: biggest diameter x smallest diameter2 x 0.52.
IX Chemotherapy Sensitivity Assays
For the chemotherapy sensitivity assays, cisplatin was used as the chemotherapy drugs to evaluate the effect of UCP2 inhibition on chemotherapy sensitivity. Cells were seeded into 96-well plates (four thousand cells/well) and allowed to attach overnight. Cells were treated with various concentrations of anticancer drugs in at least six replicate wells. After incubated for 48 h, viable cells were determined using the MTT (3-[4,5-dimethylthiazol-2-yl]-2, 5-diphenyltetrazolium bromide, Sigma, St. Louis, MO, USA) assay. One-tenth volume of MTT diluted in serum-free medium was added to each well, and the plates were further incubated at 37˚C for four h. Formazan crystals were dissolved in DMSO. The absorbance at 595 nm was measured using a spectrometer (Bio-Rad, Philadelphia, PA, USA).
X Detection of ATP Levels
Intracellular ATP levels were detected using the ATP Detection Assay Kit (Cayman Chemicals, No. 700410) following the instructions provided by the manufacturer. The cell lysate was prepared using the ATP Detection Sample Buffer, and ATP levels were expressed as nmol per gram protein.
XI Mitochondrial Bioenergetics Measurements
Oxygen consumption was determined using the Seahorse Extracellular Flux (XF-24) analyzer (Seahorse Bioscience, Chicopee, MA). Data were presented as the oxygen consumption rate (OCR) in pmol/min/mg protein. Cells were seeded at 100,000 cells/well into gelatin-coated Seahorse Bioscience XF microplates and centrifuged to adhere to the bottom of the wells. OCR was measured four times and plotted as a function of cells under the basal condition followed by the sequential addition of oligomycin (1 µg/ml), an inhibitor of mitochondrial ATP-synthase is injected into the XF medium to estimate the OCR coupled to ATP synthesis and represented as ATP-linked. The residual OCR minus the non-mitochondrial OCR can be attributed to proton leak. FCCP (1µM), an uncoupler, was added to determine the maximal OCR, followed by antimycin (1µM), an inhibitor of mitochondrial respiration, to determine non- mitochondrial sources of oxygen consumption. The ATP-linked OCR was calculated as the difference between the basal OCR and the OCR measured after the addition of oligomycin. The OCR maximal capacity was the direct rate measured after the addition of FCCP. Reserve capacity is a measure of the amount of ATP that can be produced under energetic demand and can be calculated as the difference between the maximum rate of respiration and the basal. The OCR values were normalized to total protein content in the corresponding wells and expressed as pmol/min/mg protein.
XII Lactate Assay
Intracellular levels of lactate were measured using the Lactate Assay Kit from Biovision (Milpitas, CA, USA) according to the manufacturer's instructions. Lactate levels were normalized to the amount of proteins extracted from cells.
XIII Western Blot Analysis
The whole-cell lysate was used for the assay. Primary antibodies against Akt (#4691), pAkt (S473, #4060), UCP2 (#89326) were purchased from Cell Signaling; antibodies against β-Actin (C4, sc-47778), CDK4 (sc-260), CDK6 (sc-7961), Cyclin D1 (A-12, sc-8396), pERK (E4, sc-7383), FAK (sc-558), pFAK (Y577, sc-16665), p21 (sc-6246), pRb (S780, sc12901) were purchased from Santa Cruz Biotechnology. The whole-cell lysate was used for the analysis. Protein samples were separated on 10% and 15% SDS-PAGE gel and transferred to a nitrocellulose membrane. The membranes were blocked with 5% milk, followed by overnight incubation with primary antibodies. The membranes were then washed and incubated with secondary antibody for 1 hour at room temperature.
XIV Statistical Analysis
Data were presented as mean and standard deviation. Student t-tests were used to compare the difference between groups. Statistical software SAS 9.4 (SAS Institute Inc. Gary, NC) was used for all data analysis, and two-sided p<0.05 was considered statistically significant. One-way ANOVA followed by Newman-Keuls post-test and two-way ANOVA with Newman Kruskal Wallis test was used for comparing experimental groups. Data are a mean ± standard division (S.D.). p<0.05 and p<0.0001 were considered significant.
Results
I Cell Proliferation and Anchorage-Independent Growth were Suppressed in UCP2 KD H&N Cancer Cells
Our previous studies have demonstrated UCP2 protein is highly expressed in a number of human cancers, including H&N cancers [3]. To study whether knockdown of UCP2 suppresses H&N cancer cells growth, FaDu and SCC040 cells were infected with lentivirus-based siRNA to UCP2 or the empty vector, and UCP2 stable knockdown (KD) as well control cells were selected. As shown in (Figure 1A), UCP2 expression levels were reduced by 60-70% in the KD cells.
Next, cell growth rates were compared between control and UCP2 KD cells. As shown in (Figure 1B), inhibition of UCP2 suppressed cell growth at Day 4 or 5 after initial seeding in both cell lines. To detect whether knockdown of UCP2 suppresses tumorigenicity, an anchorage-independent growth assay was performed. As shown in (Figure 1C), inhibition of UCP2 decreased the number of colonies by approximately 40%.
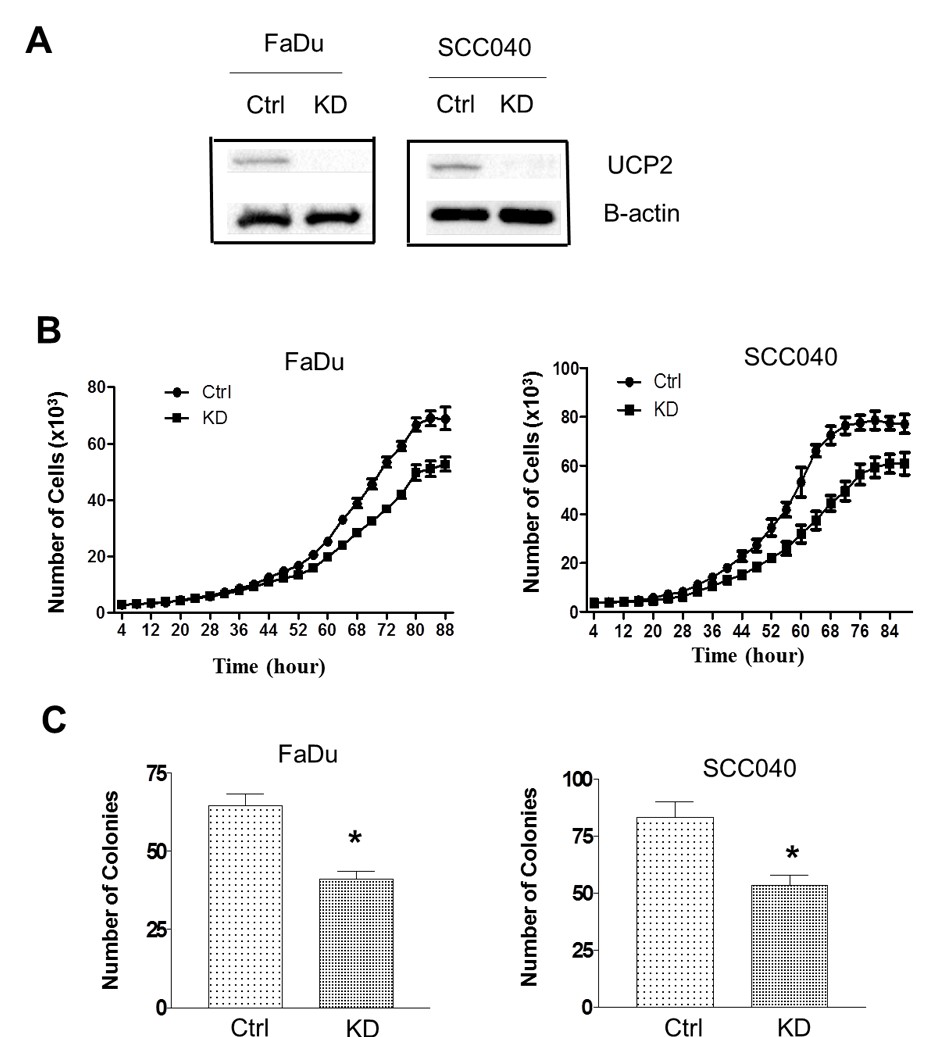
Figure 1: Inhibition of UCP2 suppressed cell proliferation and anchorage-independent growth. A) Western blot analysis of UCP2 expression levels in the knockdown cells. B) Cell growth curves of UCP2 KD cells. C) Anchorage-independent growth UCP2 knockdown cells. Ctrl: control vector-infected cells; KD: UCP2 stable knockdown cells. All of the experiments have been repeated at least three times. *, p<0.05 compared with the Ctrl group.
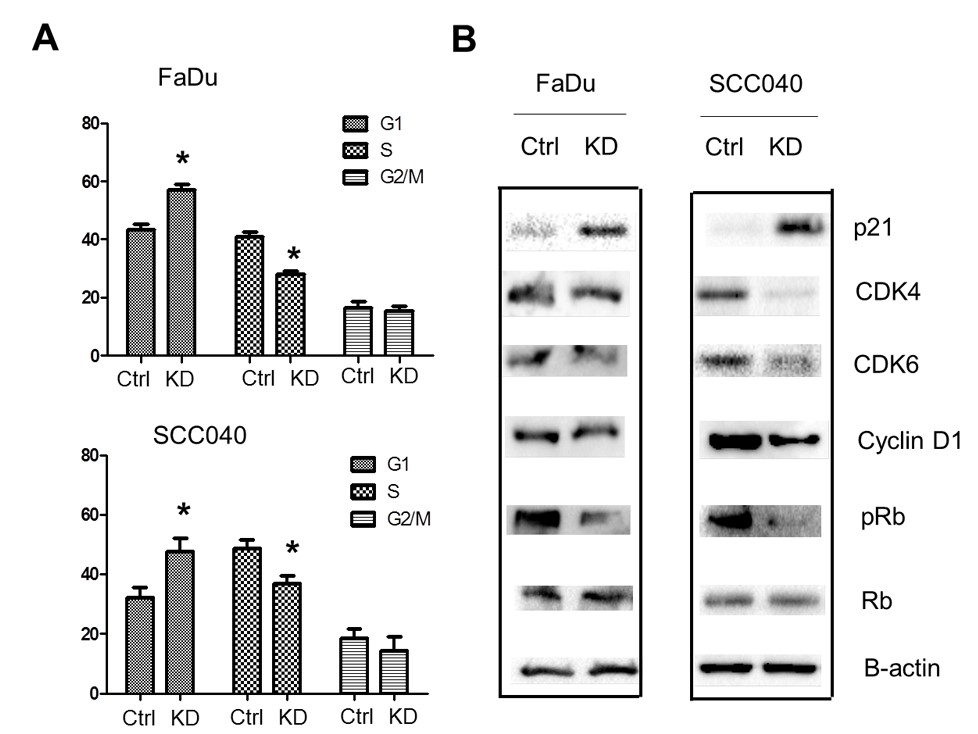
Figure 2: Inhibition of UCP2 suppressed cell cycle progression. A) Cell cycle analysis of UCP2 knockdown cells. B) Western blot analysis of cell cycle regulators. Ctrl: control vector-infected cells; KD: UCP2 stable knockdown cells. All of the experiments have been repeated at least three times. *, p<0.05 compared with the Ctrl group.
II Cell Cycle Progression was Suppressed in UCP2 KD H&N Cancer Cells
To study how knockdown of UCP2 suppresses cell proliferation, cell cycle analysis was performed. As shown in (Figure 2A), inhibition of UCP2 increased the cells population in the G1 phase, whereas decreased that in the S phase and had no significant effects on that in the G2/M phase. Next, how inhibition of UCP2 affected cell cycle regulators was studied. As shown in (Figure 2B), the G1/S CDKs (CDK4/6) and the G1/S cyclin (cyclin D1) were all downregulated in UCP2 KD H&N cancer cells. On the contrary, p21, a cyclin-depend kinase inhibitor, was upregulated in UCP2 KD cells. The tumor suppressor Rb blocks S-phase entry, and hyperphosphorylation of this protein causes its degradation. Our results found although the total Rb protein levels were not affected by inhibition of UCP2, the phosphorylated Rb proteins were downregulated (Figure 2B). These results suggest inhibition of UCP2 negatively regulates cell cycle progression.
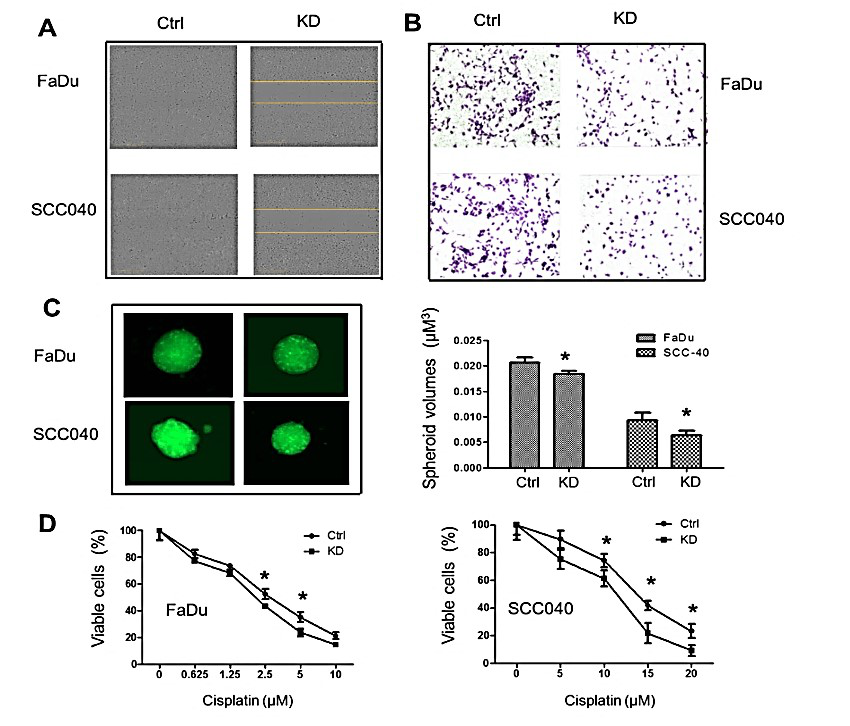
Figure 3:Inhibition of UCP2 suppressed H&N cancer cell migration, invasion, and 3D spheroid formation, as well as sensitized these cells to cisplatin treatment. A) Wound healing assay. B) Matrigel invasion assay. C) 3D spheroid growth assay. D) MTT assay after cisplatin treatment. Ctrl: control vector-infected cells; KD: UCP2 stable knockdown cells. All of the experiments have been repeated at least three times. *, p<0.05 compared with the Ctrl group.
III Cell Migration, Invasion, and 3D Spheroid Growth were Suppressed whereas Cisplatin-Induced Toxicity was Enhanced in UCP2 KD H&N Cancer Cells
To study whether knockdown of UCP2 affects the aggressiveness of the H&N cancer cells, cell migration, Matrigel invasion, and 3D spheroid formation were performed. As shown in (Figure 3A), when would-gaps were filled with new cells in control groups, they still existed in UCP2 KD groups. In the Matrigel invasion assay (Figure 3B), there were more migrated cells in control groups and less migrated cells in UCP2 KD groups. Tumor cell spheroids were cultured to mimic tumor growth in vitro. As shown in (Figure 3C), inhibition of UCP2 reduced the spheroid volumes by 20-30%. Last, whether inhibition of UCP2 could sensitize H&N cancer cells to chemo drug treatment was detected. As shown in (Figure 3D), FaDu cells were more sensitive to cisplatin treatment than SCC040 cells, and inhibition of UCP2 sensitized both cells to cisplatin treatment.
IV Mitochondrial Respiration and Lactate Production were Suppressed in UCP2 KD H&N Cancer Cells
To understand how mitochondrially located UCP2 regulates H&N cancer cell growth, intracellular ATP levels were first detected in control and UCP2 KD H&N cancer cells. As shown in (Figure 4A), the intracellular ATP levels were decreased by one-third in both UCP2 KD cells compared to control H&N cancer cells. To determine the cause of decreased ATP production, mitochondrial oxygen consumption rate and the levels of lactate (a marker of glycolysis) were detected. As shown in (Figure 4B), basal/ATP-linked respiration, maximum and reserved capacities were all decreased by at least 50% in UCP2 KD SCC040 cells compared to control cells. Similarly, lactate production was also decreased by at least 50% in both FaDu and SCC040 UCP2 KD cells compared to control cells (Figure 4C). These results suggest that both mitochondrial respiration and glycolysis are suppressed by inhibition of UCP2 in H&N cancer cells.
V FAK Signaling was Inhibited in UCP2 KD H&N Cancer Cells
Examining the animal tissue samples resulted from our previous skin carcinogenesis study using UCP2 knockout mice, our data (Figure S1) have found chemical carcinogens induced FAK activation in wild-type mice and this activation was inhibited in UCP2 knockout mice [11]. Since FAK is highly expressed, which activates Akt and ERK signaling in H&N cancer cells, how inhibition of UCP2 regulated FAK signaling was studied [8, 9]. As shown in (Figure 5), both total FAK and phospho-FAK were downregulated in UCP2 KD H&N cancer cells. The levels of non-phospho-Akt and ERK were not changed, but that of phospho-Akt and –ERK were decreased. Many oncogenic kinases, including Akt and ERK activate oncogenic c-Myc; c-Myc is essential for G1 to S phase progression, and c-Myc enhances glycolysis and drives metabolic reprogramming in cancer cells [12-14]. In UCP2 KD H&N cancer cells, c-Myc was downregulated, which is consistent with the suppression of the S-phase cell cycle (Figure 2A) and the increase in glycolysis (Figure 4C).
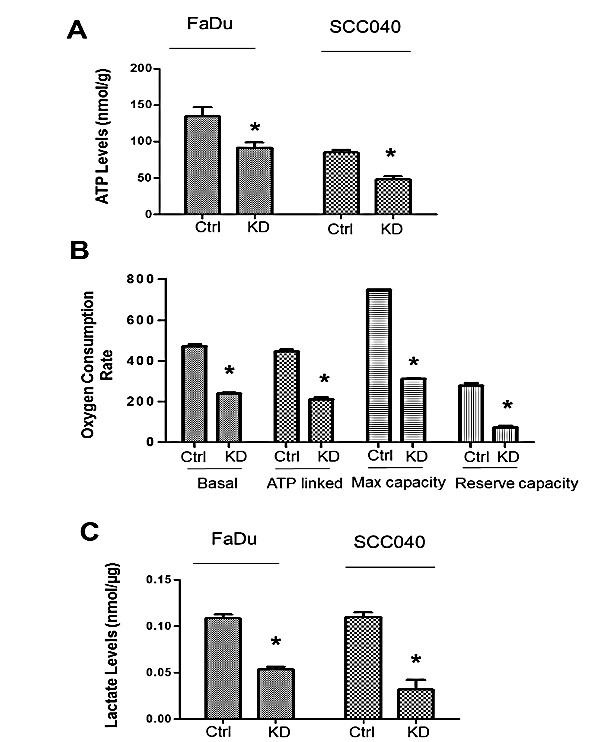
Figure 4: Inhibition of UCP2 suppresses mitochondrial oxygen consumption and ATP production in H&N cancer cells. A) Detection of intracellular ATP levels.B) Detection of oxygen consumption rate (OCR) in UCP2 KD SCC040 cells. Data are presented as OCR in pmol/min/mg protein. C) Detection of intracellular lactate levels. Ctrl: control vector-infected cells; KD: UCP2 stable knockdown cells. All of the experiments have been repeated at least three times. *, p<0.05 compared with the Ctrl group.
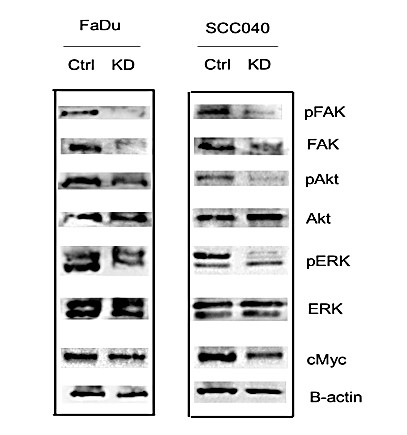
Figure 5: Western blot analysis of the FAK signaling. Ctrl: control vector-infected cells; KD: UCP2 stable knockdown cells. All of the experiments have been repeated at least three times.
Discussion
Despite the development of new therapies, head and neck squamous cell carcinomas still maintain high mortality due to tumor metastasis and recurrences resistant to therapy [6]. To identify factors contributing to metastasis and chemoresistance may lead to new and effective therapeutic strategies.
The mitochondrial protein UCP2 is ubiquitously expressed, and its physiologcal role is to transport the protons back into the mitochondrial matrix. This uncoupling effect reduces mitochondrial superoxide produced by the mitochondrial respiration chain. It is not surprising that UCP2 is highly expressed in human breast, colon, prostate, skin, pancreatic, and head and neck cancers since human cancer cells tend to have higher levels of oxidative stress [15]. To demonstrate whether UCP2 upregulation is the cause or effect of carcinogenesis, we have performed a chemically induced skin carcinogenesis study using UCP2 knockout mice. The results demonstrate that UCP2 deficiency suppresses the formation of both benign and malignant skin tumors [11]. Since UCP2 is highly expressed in human H&N cancer, to study whether inhibition of UCP2 can suppress tumorigenesis, we have chosen two HPV negative H&N cancer cell lines (FaDu and UPCI:SCC040), as HPV positive H&N cancer is considered a separate identity and has a more favorable outcome [6, 10, 16].
Cell cycle deregulation is a crucial oncogenic driver in H&N cancer [6]. In H&N cancer cells, the G1/S checkpoint is generally bypassed due to inactive CDK inhibitors (e.g., p21) and inactive Rb [6]. Our results (Figure 2) showing that inhibition of UCP2 induces p21 expression, which is accompanied by decreased expression of G1/S CDKs and cyclin D1, as well as decreased pRb levels, are consistent with increased cell populations in G1 and decreased populations in S phase. As CDKs and other cell cycle regulators are promising drug targets in H&N cancer, targeting UCP2 would serve as another therapeutic strategy. It is still unclear how the inhibition of UCP2 induces p21 expression. UCP2 has been reported to negatively regulate the tumor suppressor p53 [17, 18]. SCC040 has wild-type p53 but FaDu contains mutant p53 [10, 19]. Therefore, it is unlikely this is due to p53 activation.
Focal adhesion kinase (FAK), the main regulator of integrin signaling and cell migration/proliferation, is frequently overexpressed and hyperphosphorylated in human head-and-neck squamous cell carcinoma, and pharmacologic FAK inhibition leads to radiosensitization of 3-dimensionally grown HNSCC cell lines [8, 9]. Activated FAK induces cell cycle progression through cyclin D1 mediated by ERK and drives tumor survival and growth via Akt, which is consistent with the results (Figures 2, 3 & 5) showing inactivated FAK in UCP2 knockdown cells suppresses cyclin D1 expression and S-phase progression, as well as sensitizes H&N cancer cells to chemo-drug treatment [8]. The next question is, is there a link between UCP2 and FAK? In our previous skin carcinogenesis study, UCP2 deficiency suppresses not only tumor formation but also tumor invasion and metastasis [11]. Using the skin tumor tissues collected from this study, we have performed antibody array analysis. As shown in (Supplementary Figure 1), the phosphorylated form of FAK (Y576/577) was increased in the wild type but not in the UCP2 knockout mice upon carcinogen treatments, suggesting UCP2 could negatively regulate FAK.
Further studies need to be performed to demonstrate the underlying mechanism. Since total FAK is also downregulated in UCP2 knockdown H&N cancer cells, how UCP2 affects FAK gene transcription also needs to be studied. In summary, our study first demonstrates that knockdown of UCP2 suppresses H&N cancer progression in vitro, which provides a rationale for targeting UCP2 in future therapeutic studies.
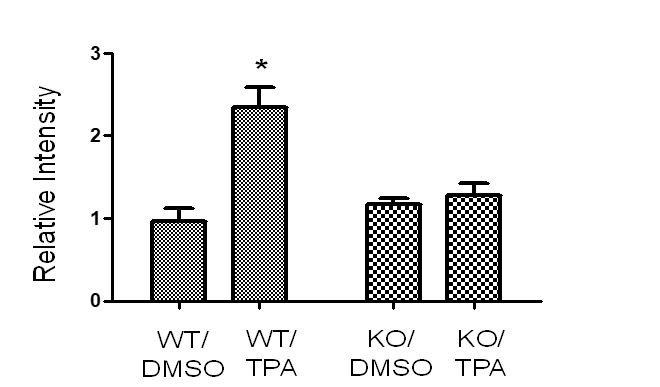
Supplementary Figure 1: Detection of the levels of phosphorylated focal adhesion kinase (FAK, Y576/577) in mouse skin epidermal tissues at the end of a skin carcinogenesis study [11]. Whole Cell Lysate from 6 mice in each treatment group was pooled together and used for the antibody microarray analysis. The microarray analysis was performed following the instructions provided by the manufacturer (Catalog Number KAS02, Full Moon BioSystems, Inc.). WT: wild-type mice, KO: UCP2 knockout mice, DMSO: vehicle control, TPA: chemical carcinogen treatments.
Acknowledgments
IncuCyte Zoom was provided by the Feist-Weiller Cancer Center’s Innovative North Louisiana Experimental Therapeutics program (INLET), which is directed by Dr. Glenn Mills at LSUHSC-Shreveport and supported by the LSU Health Shreveport Foundation. We thank Dr. Ana-Maria Dragoi, Associate Director of INLET, Dr. Jennifer Carroll, Director of the In Vivo, In Vitro Efficacy Core and Reneau Youngblood, Research Associate for their assistance in IncuCyte studies. Flow cytometry experiments were performed by David Custis at the institutional Research Core Facility.
Conflicts of Interest
None.
Data Availability
The data that support the findings of this study are available from the corresponding author upon reasonable request.
Abbreviations
H&N: head and neck
UCP2: uncoupling protein 2
FAK: focal adhesion kinase
CDK: cyclin-dependent kinase
OCR: oxygen consumption rate
KD: knockdown
Article Info
Article Type
Research ArticlePublication history
Received: Thu 09, Apr 2020Accepted: Fri 24, Apr 2020
Published: Wed 29, Apr 2020
Copyright
© 2023 Yunfeng Zhao. This is an open-access article distributed under the terms of the Creative Commons Attribution License, which permits unrestricted use, distribution, and reproduction in any medium, provided the original author and source are credited. Hosting by Science Repository.DOI: 10.31487/j.COR.2020.04.09
Figures & Tables
References
- JW Stephens, SS Dhamrait, AR Mani, J Acharyab, K Moore et al. (2008) Interaction between the uncoupling protein 2 -866G>A gene variant and cigarette smoking to increase oxidative stress in subjects with diabetes. Nutr Metab Cardiovasc Dis 18: 7-14.
- Horvath B, Spies C, Horvath G, Kox WJ, Miyamoto S et al. (2002) Uncoupling protein 2 (UCP2) lowers alcohol sensitivity and pain threshold. Biochem Pharmacol 64: 369-374. [Crossref]
- Li W, Nichols K, Nathan CA, Zhao Y (2013) Mitochondrial uncoupling protein 2 is up-regulated in human head and neck, skin, pancreatic, and prostate tumors. Cancer Biomark 13: 377-383. [Crossref]
- Robbins D, Zhao Y (2011) New aspects of mitochondrial uncoupling proteins (ucps) and their roles in tumorigenesis. Int J Mol Sci 12: 5285-5293. [Crossref]
- Baffy G (2010) Uncoupling protein-2 and cancer. Mitochondrion 10: 243-252. [Crossref]
- Leemans CR, Snijders PJF, Brakenhoff RH (2018) The molecular landscape of head and neck cancer. Nat Rev Cancer 18: 269-282. [Crossref]
- Canel M, Secades P, Rodrigo JP, Cabanillas R, Herrero A et al. (2006) Overexpression of focal adhesion kinase in head and neck squamous cell carcinoma is independent of fak gene copy number. Clin Cancer Res 12: 3272-3279. [Crossref]
- Sulzmaier FJ, Jean C, Schlaepfer DD (2014) FAK in cancer: mechanistic findings and clinical applications. Nat Rev Cancer 14: 598-610. [Crossref]
- Hehlgans S, Eke I, Cordes N (2012) Targeting FAK radiosensitizes 3-dimensional grown human HNSCC cells through reduced Akt1 and MEK1/2 signaling. Int J Radiat Oncol Biol Phys 83: e669-e676. [Crossref]
- White JS, Weissfeld JL, Ragin CC, Rossie KM, Martin CL et al. (2007) The influence of clinical and demographic risk factors on the establishment of head and neck squamous cell carcinoma cell lines. Oral Oncol 43: 701-712. [Crossref]
- Li W, Zhang C, Jackson K, Shen X, Jin R et al. (2015) UCP2 knockout suppresses mouse skin carcinogenesis. Cancer Prev Res (Phila) 8: 487-491. [Crossref]
- Albihn A, Johnsen JI, Henriksson MA (2010) Henriksson MYC in oncogenesis and as a target for cancer therapies. Adv Cancer Res 107: 163-224. [Crossref]
- Meyer N, Penn LZ (2008) Reflecting on 25 years with MYC. Nat Rev Cancer 8: 976-990. [Crossref]
- Hsieh AL, Walton ZE, Altman BJ, Stine ZE, Dang CV (2015) MYC and metabolism on the path to cancer. Semin Cell Dev Biol 43: 11-21. [Crossref]
- Sreedhar A, Zhao Y (2017) Uncoupling protein 2 and metabolic diseases. Mitochondrion 34: 135-140. [Crossref]
- Pogorzelski M, Ting S, Gauler TC, Breitenbuecher F, Vossebein I et al. (2014) Impact of human papilloma virus infection on the response of head and neck cancers to anti-epidermal growth factor receptor antibody therapy. Cell Death Dis 5: e1091. [Crossref]
- Derdak Z, Mark NM, Beldi G, Robson SC, Wands JR et al. (2008) The mitochondrial uncoupling protein-2 promotes chemoresistance in cancer cells. Cancer Res 68: 2813-2819. [Crossref]
- Wang F, Fu X, Chen X, Chen X, Zhao Y (2010) Mitochondrial uncoupling inhibits p53 mitochondrial translocation in TPA-challenged skin epidermal JB6 cells. PLoS One 5: e13459. [Crossref]
- Reiss M, Brash DE, Muñoz-Antonia T, Simon JA, Ziegler A et al. (1992) Status of the p53 tumor suppressor gene in human squamous carcinoma cell lines. Oncol Res 4: 349-357. [Crossref]