Specialist Advice Does Not Modify the Risk of Death of Diabetic 2 Patients
A B S T R A C T
Context: A recent meta-analysis (Bonora and coll.) reports benefits on death-risk for Italian diabetic patients mainly followed by the diabetic clinics of the National Health Service.
Aims: A) to do a critical appraisal of the meta-analysis by Bonora and coll. B) to verify its results conducting a controlled cohort study based on clinical records of a primary care setting.
Methods: (A) We evaluated the meta-analysis by Bonora through AMSTAR II checklist and the trials recruited in the review through ROBINS-I tool. (B) We analysed a cohort of diabetes 2 patients living in Veneto (Italy) and followed from 1/1/2009 to 12/31/2017 to compare the risk of death of a control group (i.e. never followed by specialists) with that of another two groups (i.e. respectively, followed by one specialist visit or by at least two visits in the last three years). We used a time-to-event approach (Cox model) for the main analysis; complementary designs were also tested (Restricted design and Matched design). Statistical adjustments were made both through Multivariate Cox regression and Propensity score. For the adjustments, the covariates considered were: age, sex, severity of diabetes, comorbidity, laboratory values, duration of diabetes and drugs use.
Results: (A) The meta-analysis by Bonora shows to be affected by serious pitfalls (B) A cohort of 6530 diabetic patients (none visit: n=3441; one visit: n=947; two or more visits: n=2142) was followed for a mean of 7.32y. Main multivariate analysis was not able to demonstrate any difference in mortality between groups exposed or not exposed to specialist advice: one visit HR=1.01 (0.98-1.03); two or more visits HR=1.12 (0.88-1.43). These results were confirmed by all other analytical approaches.
Conclusion: Mortality in diabetes2 is not influenced by specialist consultant. Our results differ by those reported by the meta-analysis because of our better adjustment for prognostic and confounding factors. Most of diabetes 2 patients should be entrusted with confidence to primary care facilities.
Keywords
Primary care, referral and consultation, Diabetes mellitus type 2, cox model, propensity score, specialist advices, mortality
Introduction
A recent meta-analysis (Bonora et al.) reports important improvements in survival for diabetics mainly followed by specialist structures: Death OR=0.81 (CI95% 0.69-0.95) [1]. This message is of great practical importance since Diabetes Mellitus, a vascular-equivalent disease, in primary care settings affects almost one of ten Italians (7.9%) [2-4]. The meta-analysis recruited observational studies conducted in Italy over the last 20 years, attributing that improvement to a better access to nursing resources, to a greater easiness of treatment prescriptions and to a follow-up that is generically better than that exercised in the context of a generalist approach [1, 5-7]. Taking into account the importance of the problem, our first aim was to conduct a critical appraisal of the meta-analysis by Bonora (evaluation of methodological quality); our second aim was to verify the meta-analysis results through an observational study conducted on a cohort of Italian diabetic patients assisted by general practitioner from Veneto. In detail, we investigated the relationship between general mortality and the care settings of the diabetic patients in the catchment area of our MilleinRete network, represented by the clinical records of over one hundred thousand patients followed by general practitioners (GPs) in Veneto [3].
Subjects and Methods
I First Objective
We analyzed the quality of the meta-analysis by Bonora through the checklist AMSTAR and the quality of the trials recruited through the Cochrane’s tool ROBINS I (Appendix A, Appendix B) [8, 9].
II Second Objective
We analyzed the relationship between all-cause mortality and setting of care through a controlled study based on historical data.
Dataset
On 12/31/2017 MilleinRete dataset contains 152510 electronic medical records of an open population assisted by 69 general practitioners working in Veneto (Italy) and followed from 1/1/2006 to 12/31/2017(Appendix C) [3].
Definition of disease
Diabetes2 was identified through ICD9 code 250% (excluded 250._1% and 250._3%) [10].
Definition of cohort
Six thousand five hundred thirty diabetes2 patients (i.e. all diagnosed at 12/31/2008) represented our whole cohort. Patients alive on 12/31/2017 or changing doctor between 1/1/2009 and 12/31/2017 was considered censored.
Follow-up
Patients were followed from 1/1/2009 to 12/31/2017.
Definition of exposition
We considered ‘exposed’ to specialist advice a diabetic patient sent to a specialist visit at least once from 01/01/2006 to 12/31/2008.
Important note: this is an “Intention-to-treat(ITT)-like approach [9]. Ie, we did not take into account the diabetological visits performed during the follow-up because it would have been a “Per-protocol-like approach”. We will discuss this concept later (see ‘Discussion’).
We counted the specialist visits performed in the three-years period before the enrolment assuming a greater benefit for more controlled patients, according on Hill's criteria [11].
Definition of outcome
We detected the outcome “all-cause mortality” through the dates of death recorded in electronic medical records during the follow-up.
Definition of covariates
For details see (Appendix D). All basal values of the covariates refer to the year 2008. We used these variables both for the adjustments made via multivariate analysis (Cox model) and for the calculation of the propensity score, which we used in Pair-matched analysis and in some Cox models (see later). We considered the severity of diabetes2 an important confounder since it can affect both the outcome (for worse prognosis) and exposure (encouraging specialist consultations). We considered a marker of severity to have been exposed to insulin at least once during year 2008. We also considered as important confounder the serious clinical comorbidity (Charlson Index≥4) since it can affect both the outcome (for worse prognosis) and exposure (discouraging specialist consultations) [12]. We considered as potential confounders and/or prognostic factors: LDL-Cholesterol (LDL-CL), Triglycerides (TG), Glicohaemoglobin (Ghb) [for all: mean concentrations in index year]; statins-use and metformin-use [for both: at least one prescription in the index year]. Finally, we considered the duration of diabetes (years) as true prognostic predictor. Age and sex were considered, too.
III Analysis plan
Table 1 summarizes all the adjustment approaches performed in our research, both at design-level and at data analysis-level.
Table 1: strategies that we adopted for control for confounders and/or prognostic factors potentially infuent on the outcome death.
|
Approaches |
Control procedure done at the stage of design-choice |
Diabetics Target of the adjustment- procedure |
Control procedure done at the stage of data-analysis |
References |
|
A.MAIN ANALYSIS |
None |
Whole cohort of diabetics (all the exposed are compared with all the not exposed) |
1.A Cox Model 1 adjusted for all covariates
|
Table 3 of main text Figure 1 of main text Appendix E -fig E1 |
|
1.B Cox Model 2 adjusted for propensity score (the PS is the main adjustment factor in that represents a surrogate of the randomization process)
|
Appendix G Figure 2 |
|||
|
B.RESTRICTED DESIGN ANALYSIS |
Restricted design |
Sub-cohort of insulin-treated diabetics (all the exposed trated with insulin are compared with all the not exposed treated with insulin) |
2.A Cox model 3 adjusted for all covariates in a restricted design
|
Appendix H Appendix E -fig E2 |
|
2.B Cox model 4 adjusted for propensity score in a restricted design (the PS is the main adjustment factor in that represents a surrogate of the randomization process)) |
Appendix G |
|||
|
C. MATCHED PAIRS DESIGN ANALYSIS |
Matched design (in this case the matching-variable is the Propensity score) |
Diabetics exposed are compared with diabetics not exposed characterized by an identical probability of exposure (=propensity score) |
3A ATE procedure applied to whole cohort
|
Appendix G |
|
3B ATE procedure of applied ony to insulin treated (ie the matching analysis is coupled with a “restricted design”) |
Appendix H |
Time-to-event Multivariate Analysis on the whole cohort (Cox model 1 = Main analysis, Table 1A)
We launched a multivariate analysis on the whole cohort of diabetics using a time-to-event-based approach (Cox model 1). Initially, the crude relationships between outcome and covariates were explored through monovariate Cox analyses. Covariates were selected if they showed a p < 0.10 in the monovariate analysis. Interactions between covariates were tested basing on their clinical relevance. The respect of the proportional-hazards assumption was evaluated through a statistical test based on Schoenfeld’s residuals [13]. The goodness of the pattern of covariates was evaluated through the Pregibon’s test [14]. The goodness of fit was tested through Cox-Snell’s residuals (Appendix E) [15]. As any database of historical data not collected for scientific purpose, our dataset had some missing data in some covariates we considered for the analysis: these observations were automatically excluded from the models (Appendix F).
Time-to-event analysis on the whole cohort adjusted for propensity score (Cox model 2, Table 1B)
The propensity score (PS) defines for each subject the probability to have the exposure: in an observational approach adjusting for PS is a reasonable surrogate of randomization, because it balances the known characteristics across compared groups Firstly, We used the PSs generated by a logistic model (Appendix G) as adjustment-covariate in a bivariate Cox model launched on the whole cohort. This approach allows to compensate for the missing data excluded from the Cox model 1, since the use of PS (calculated excluding laboratory data) permits a lower percentage of missing data. In that analysis we used the quantiles [17] of PSs as covariate of adjustment in a classic Cox model.
Multivariate time-to-event analysis in a restricted design (Cox model3, Cox model 4 Table 1, 2A, 2B)
Since severity of diabetes is probably the most important confounder, we made also a collateral analysis limiting the methods described above to patients in insulin therapy (Restricted design). The restriction-approach provides a complete control for variables that define the recruitment criteria, which are important confounders in this setting [9]. In this 'restricted' design we launched two types of analysis: a Cox model (Cox model 3) adjusted with the same covariates used for the Cox 1 model 1 and another one (Cox model 4) adjusted by PS.
Matched analysis based on Average Treatment Effect (ATE) and PS (Table 1, 3A, 3B)
We calculated ATE using the PS values in a matched comparison [16, 17]. In this approach the effect of the exposure is computed using the average of the difference between the observed and potential outcomes for each subject; in our model every subject exposed to specialist advice was matched 1:1 with a control characterized by almost identical values of PS [16]. We applied this approach both on the entire cohort of diabetics (Table 1 3A) and on the restricted cohort of insulin-treated diabetics (Table 1 3B). We used the statistical Software Stata14 SE for all analyses except for those in (Appendix I), for which was used PASS 2008.
Results
I Diabetes 2 patients
Six-thousand-five-hundred-thirty subjects had a diagnosis of Diabetes 2 on 12/31/2008 (males: n=3507, females: n=3014, nd: n=9). The mean age was 68.06y ±12.56y (66.03y ±11.60y for males and 70.42y ±13.20y for females).
II Exposition
Threethousand-fourhundred-fortyone (52.7%) did not receive any specialist visits before the start of the follow-up (i.e. from 1/1/2006 to 12/31/2008); 3089(47.3%) received at least one. Of these, 947 (14.5%) had only one visit; 2142 (32.8%) two or more.
III Covariates
Table 2 illustrates the pattern of covariates that we used in our analyses. In the control group (no specialist advice) age shows to be higher and use of insulin shows to be lower than both groups exposed to specialist consultants. In the exposed subjects gHb-levels and the proportions of metformin and statins- treated patients were higher, and LDL-CL-levels were lower than the control group.
Table 2: Basal values of the covariates.
|
|
None specialist advice1 (n=3441) |
One specialist advice1 (n=947) |
Two or more specialist advices1 (n=2142) |
|||
|
Covariates |
n |
Means (sd) or perecent |
n |
Means (sd) or perecent |
n |
Means (sd) or perecent |
|
Age (years)2 |
3441 |
69.78 (12.75) |
947 |
66.49 (12.36) |
2142 |
66.08 (12.02) |
|
Proportion of 65+ aged2 |
3441 |
68.46% |
947 |
58.50% |
2142 |
60.27% |
|
Proportion of males2 |
3433 |
52.28% |
946 |
56.23% |
2142 |
55.08% |
|
Proportion of insulin-treated2 |
3441 |
5.20% |
947 |
13.72% |
2142 |
29.69% |
|
Proportion of statin-treated2 |
3441 |
26.82% |
947 |
37.90% |
2142 |
49.11% |
|
Proportion of metformin-treated2 |
3441 |
21.79% |
947 |
40.33% |
2142 |
42.62% |
|
Glycosylated Hemoglobin2 (%) |
1726 |
6.84 (1.16) |
639 |
7.20 (1.32) |
1663 |
7.47 (1.30) |
|
LDL-Cholesterol2 (mg/dl) |
1495 |
121.64 (35.79) |
549 |
113.51 (34.73) |
1386 |
106.80 (31.19) |
|
Triglycerides2 (mg/dl) |
1681 |
143.06 (80.66) |
601 |
152.91 (100.40) |
1490 |
145.32 (93.14) |
|
Charlson score2 (unit) |
3441 |
2.89 (1.63) |
947 |
2.81 (1.58) |
2142 |
2.96 (1.68) |
|
Proportion of Charlson score≥42 |
3441 |
29.43% |
947 |
26.61% |
2142 |
29.97% |
|
Duration of diabetes (years) |
3146 |
13.58 (3.32) |
847 |
13.30 (3.46) |
1804 |
14.41 (3.48) |
1-from 01/01/2006 to 12/31/2008 2-Recorded in year 2008
Note: we did not calculate p values because these statistics are descriptive and not inferential
IV Cox Model 1 (Main analysis, Table 1, 1A)
The whole cohort was followed for 47819.3 person-years(py) with a mean follow-up of 7.32 years. Outcome From 1/1/2009 to 12/31/2017 1092 diabetics patients deceased (controls: 575; group with one specialist visit: 140; group with two or more specialist visits: 377). The crude mortality rate (MR) for the whole cohort was 22.8 deaths/1000py, (23.05 deaths/1000py, 19.7 deaths/1000py and 23.86 deaths/1000py for control group, for ‘one specialist visit’ group and for ‘two or more specialist visits’ group respectively. Table 3 illustrates the results of monovariate and multivariate Cox models and the results of the diagnostic checks. To be exposed to specialist consults does not show to be associated to any benefit on risk of death, independently by the level of the exposition: HR= 1.01 (0.74-1.38) for ‘one specialist visit’ group, HR=1.12 (0.88-1.43) for ‘two or more specialist visits’ group.
Table 3: Cox Model 1 (monovariate and multivariate models).
|
|
Monovariate Cox models |
Multivariate Cox model one (n=2686)1,2,3 |
|||
|
Covariates2 |
n |
Hazard Ratio (CI 95%) |
p |
Hazard Ratio (CI 95%) |
p |
|
To be aged65+ |
6530 |
5.13 (4.25-6.19) |
<0.00001 |
5.12 (3.40-7.69) |
<0.0001 |
|
To be male |
6521 |
1.04 (0.92-1.17) |
0.504 |
- |
|
|
To be treated with insulin |
6530 |
2.15 (1.87-2.47) |
<0.00001 |
1.67 (1.27-21.9) |
<0.0001 |
|
To be treated with statins |
6530 |
0.88 (0.78-1.00) |
0.0653 |
0.85 (0.69-1.05) |
0.1430 |
|
To be treated with metformin |
6530 |
0.68 (0.59-0.78) |
<0.00001 |
0.69 (0.55-0.86) |
0.001 |
|
Glycosylated Hemoglobin (for each 1% of increment) |
4028 |
1.07 (1.02-1.13) |
0.006 |
1.08 (0.99-1.17) |
0.070 |
|
LDL-Cholesterol (for each mg/dl of increment) |
3430 |
0.99 (0.99-0.99) |
<0.00001 |
0.99 (0.99-0.99) |
0.023 |
|
Triglycerides (for each mg/dl of increment) |
3772 |
0.99 (0.99-1.00) |
0.254 |
- |
|
|
To have a Charlson score≥4 |
6530 |
2.77 (2.46-3.12) |
<0.00001 |
5.96 (3.52-10.11) |
<0.0001 |
|
Duration of diabetes (for each additional year) |
5797 |
1.05 (1.04-1.07) |
<0.00001 |
1.01 (0.98-1.03) |
0.438 |
|
Having been sent to one specialist visit |
6530 |
0.85 (0.71-1.03) |
0.1090 |
1.01 (0.74-1.38) |
0.933 |
|
Having been sent to two or more specialist visits |
6530 |
1.03 (0.90-1.17) |
0.5970 |
1.12 (0.88-1.43) |
0.321 |
|
Interaction (be aged65+)#( have a Charlson score≥4 ) |
- |
- |
- |
0.30 (0.17-0.53) |
<0.0001 |
1-The pattern of covariates shows to be satisfactory: Pregibon’s test z=-0.64 p=0.520
2-The assumption of proportional risks was respected: test for Schoenfeld’s residuals chi2 16.97 (df=11) p=0.1089
3- Three thousand eight hundred forty four patients were excluded because of missing data (See main text and Appendix D)
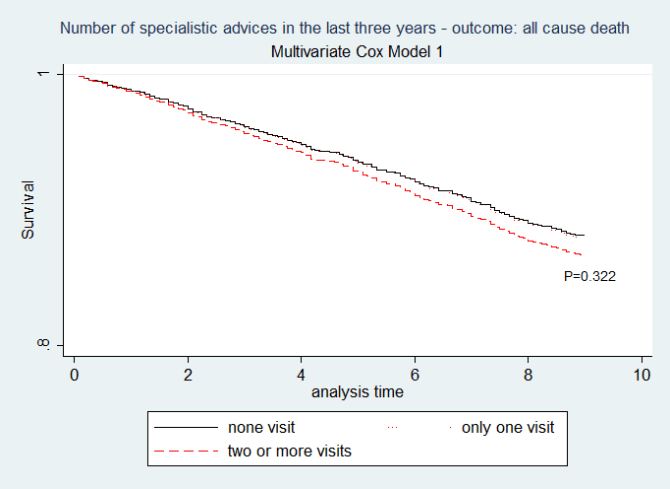
Figure 1: Cox model one. (N= 2686 diabetics without missing data i.e. 41.1% of the whole sample). Having two or more specialist advices does not influence the mortality risk (two or more vs other strata: p=0.322; one vs none: p=0.933). Pregibon’s test: z -0.64 p=0.520; Test for the Schoenfelds residuals: chi2 16.97 df11 p=0.1089.
The unique predictors of some advantages on mortality were to be treated with metformin: HR=0.69 (0.55-0.86) and having a LDL-CL not low: HR=0.99 (0.99-0.99). Obviously, age ≥ 65 and to be sick showed a detrimental effect, being mutually interacting too. Younger patients (age <65) showed a relative mortality hazards of 1.27 (p=0.01) and 7.62 (p=0.032) respectively in absence and in presence of significant comorbidity; the same values in the older diabetics (age ≥ 65) are 6.54 (p=0.022) and 11.79 (p=0.025). Figure 1 illustrates the adjusted survival curves for every level of exposure from Cox model 1. The multivariate Cox model 1 (Table 3, Figure 1) excluded however 3844/6530 diabetic patients (58.8%) because of missing data of laboratory analyses. (Appendix F) Illustrates the differences between patients excluded and included in that analysis.
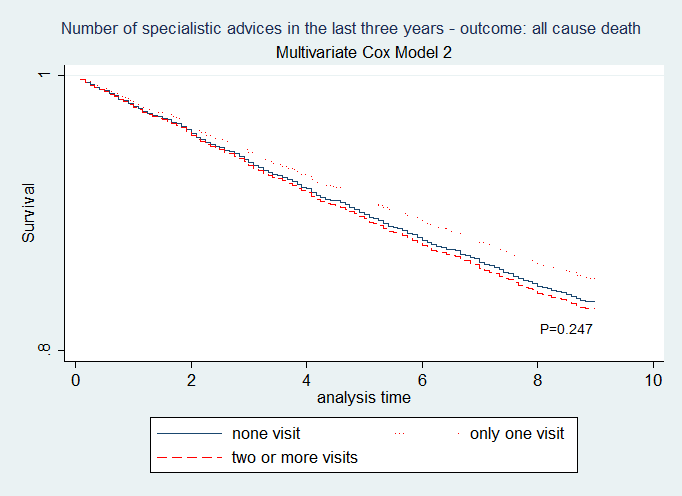
Figure 2: Cox model two. (N=5797 diabetics i.e. 88.8% of the whole sample). The covariates were quantiles of Propensity Score and duration of the diabetic disease. Pregibons test z -0.35 p=0.727; Test for the Schoenfeld’s residuals: chi2 11.07 df6 p=0.0863. Again, having one, two or more specialist advices does not appear to be related to a different mortality rate (two or more visits vs other strata: p=0.240; one visit vs none: p=0.252)
V Cox model 2 (Table 1, 1B)
To test the robustness of those results we used a PS-approach applied to most of the whole sample in order to minimize the problem of missing data too. In detail, we launched another time-to-event analysis (Cox model 2) using as covariates only the quintiles[17] of PS and the length of diabetic disease. The details of the calculation of PS are described in (Appendix G). Again, no relationship was founded between to be exposed or not exposed and the risk of death: one visit HR= 0.88 (0.72-1.09); two or more visits HR= 1.03 (0.88-1.21) being –again- examined 88.8% of the whole sample (Figure 2).
VI Restricted design analysis
We repeated all the analyses described above in a cohort of 945 diabetics treated with insulin in a restricted-design approach.
Cox model 3 (Table 1, 2A)
In a Cox model three applied to 367 insulin-treated diabetics (Appendix H) we used the same covariates of Cox model 1. To be exposed to specialist advice does not demonstrate, again, any protective effect on the mortality risk: one visit HR= HR 0.79 (0.34-1.81); two or more visits HR 0.82 (0.45-1.49)
Cox model 4 (Table 1, 2B)
The Cox model 4, applied to 707 insulin-treated diabetics using as covariates both the PS values in quintiles[17] and the length of diabetic disease, does not demonstrate any association between to be exposed to specialist advice and the risk of death: HR=0.73 (0.53-1.00) (AppendiX H)
VII Matched pairs design analysis (Table 1, 3A 3B)
We tested the relationship between specialist advices and mortality also through an ATE analysis, another procedure used in observational research (Appendix G and Appendix H). This procedure adopted a matched pairs design. In summary, couples of diabetic patients, respectively exposed and not exposed to the diabetological examination and characterized by the same baseline probability of being sent to diabetologic advice, were compared for the mortality outcome. The probability of being sent to the diabetological examination was defined for each patient by the PS values calculated by a logistic model.
Matched Pairs ATE analysis applied on the whole cohort (Table 1, 3A)
The first ATE PS matched analysis involved 88.8% of the sample (Appendix G) . This analysis was not able to demonstrate, once again, any significant difference in mortality risk between patients exposed or not exposed to diabetologic advice: ATE = 0.0048588 ( -0.0215432 to 0.0312609).
Matched Pairs ATE analysis coupled with a restrict design (Table 1, 3B)
We applied the same analysis to the restrict cohort described above. In a ATE analysis applied to 945 insulin-treated diabetic patients, exposition to at least one specialist visit did not show any effect on mortality: ATE -0.0760522 ( -0.164495 - 0.0123905) (Appendix H)
Discussion
Our critical appraisal of Bonora's work (Appendix A, Appendix B) reveals serious problems in the meta-analysis and its conclusions [1]. In fact, the meta-analysis
1. was not preceded by a sufficiently comprehensive review of the medical literature
2. did not analyze the relationship between the methodological quality of the studies recruited and its own conclusions
3. did not analyze the metodological pitfalls of the three studies reviewed [5-7].
In fact, all the studies recruited were burdened by serious risks of bias due to confounding and due to selection (Appendix B) [5-7]. Therefore, we believe that the conclusions of Bonora's meta-analysis are not transferable to clinical recommendations. Instead, in our observational study we used different analysis approaches to respect as much as possible the importance of using different strategies to assess bias due to confounding and other types of bias.
As result of our main analysis (Cox model 1), in a big sample of diabetics followed for more of seven years we did not demonstrate any relationship between specialist consultations and the risk of death. Noteworthy, our main results were confirmed by all other support analyses that we done, both using different types of design (cohort not restricted, cohort restricted, matched pairs comparisons) and using different types of adjustments (balancing through multvariate regression; balancing through propensity score). Our mortality rate (MR) (22.83 deaths/ 1000py) shows to be lower than those reported in the Bonora’s meta-analysis trials (33.76, 53.39 and 63.4 deaths/1000py respectively); in two other studies the MR was nearest to our one (29 deaths per 1000py and 24 deaths per 1000py respectively [1, 5-7, 18, 19]. The reasons of the discrepancies in MRs are not evaluable, because of the poor description of the basal variables in Bonora’s researches [1]. We recruited diabetics 68.06 years old, while those recruited diabetics of 68.9, 68.7 and 66.6 years old respectively: so, differences in ages do not appear to be able to explain these differences [5-7]. The beneficial results of Bonora’s meta-analysis on the risk of death are so explained -by our opinion- only by the poor quality of the adjustments made in those non-randomized comparisons [1].
Mortality is obviously influenced not only by diabetes but also by serious concurrent diseases that likely were present in the geriatric samples examined by these researches [5-7]. It is noteworthy that in none of these studies it was considered an adjustment for comorbidity status: this could have introduced a serious bias due to confounding. In fact, it is unlikely that seriously ill patients were referred to the specialists by their doctor, since diabetes without metabolic urgency does not represent for them a clinical priority. Consequently, the control groups of these researches may have been burdened by a differential basal prognosis [5-7]. An important confounder is represented by the severity of the diabetes; also, Zoppini and Bruno made some adjustments for that, quantified by the exposition to insulin and Ghb respectively [5, 6]. We have given every care to adjust the analysis for that confounder: firstly, including the exposition to insulin and the Ghb values as covariates of Cox model; secondly, including the first covariate in the logistic regression model used for calculate the PSs; thirdly, repeating all analyses in a design restricted to patients undergoing insulin therapy. None of that approaches were able to demonstrate any advantage for the specialist consult on mortality risk. Zoppini made a post hoc evaluation of the cohort of diabetic patients in the Verona Diabetes Study, a cross sectional research aimed to evaluate the prevalence of diabetes followed by a prospectic study of prognosis [5, 20].
Being programmed for different purposes this dataset could not have provided to Zoppini the data for a complete adjustment (except for the insulin-exposition). Baviera used in his research some administrative databases: that source of information could not guarantee of course clinical adjustments comparable to those achievable through medical records [7]. Bruno instead had a large availability of clinical data and made more complex adjustments (see Appendix B) but he did not adjust his results for the overall comorbidity [6]. In a Canadian research recruiting a tens of thousands of newly diagnosed diabetics was even found -in patients followed mainly by the specialist- a significant increase of mortality [19]. Also, that analysis, as in our experience, was corrected for comorbidity status and other important confounders. We found that only to be elderly, be sick and be treated with insulin show to be predictors of higher risk of death.
The role of insulin should be considered carefully, turning out to be an important predictor of death. A meta-analysis of RCTs found no difference in the risk of all-cause mortality [RR= 1.00 (0.93 - 1.08)] between Insulin and non-insulin glucose-lowering therapies in diabetes2 patients but at the same time it found an increased risk of hypoglycemia: RR= 1.90 (1.44 - 2.51) [21]. In our observational approach the identification of the precise role of insulin as an independent predictor of death should have required other adjustments for clinical indicators of severity and for complications of diabetic disease and its treatment, but this was not the purpose of this research. Moreover, we found that both exposition to metformin and not having low values of LDL-CL show to be independent protective predictors about death risk. The relations between exposure to metformin and a protective effect on mortality is well note, at least for overweight patients. A Cochrane meta-analysis edited in 2005 suggests in fact that metformin may be the first therapeutic option in the diabetes 2 with overweight/obesity, as it may prevent not only some vascular complications but also all- cause mortality: RR =0.73 (0.55- 0.97) [22]. In our diabetic cohort 4042 patients have measured the BMI in year 2008; of them 75.6% were overweight or obese (data not showed).
The inverse association between LDL-CL values and risk of death is also not surprising, because of the old age of our diabetic cohort. Our results confirm in fact those of Ravnsok’s meta-analysis, which noted an inverse association between mortality and LDL-C in 16 elderly cohorts [23]. Then, we were not able to find any effect of exposure to statins on mortality rates. This is coherent with the literature pertinent to diabetic2 [24-27]. Neither CARDS (a landmark study) - nor ASPEN or 4D showed any benefic effect of statins on mortality: the RRs of death were RR=0.73 (0.52-1.01), RR=1.01 (p>0.05) and RR=0.93 (0.79-1.08) respectively [25-27]. It is noteworthy that we did not find any association between Ghb levels and risk of death .A recent meta-analysys compared clinical and metabolic outcomes in type two diabetic people treated with insulin and non-insulin glucose lowering therapy(GLT) respectively: overall, insulin showed as expected greater efficacy in glycaemic control compared to non-insulin GLTs but nevertheless there was no significant difference in the risk of all-cause mortality between the groups RR= 1.00 (0.93 - 1.08) [21]. That observation appears coherent with our results.
I Why the follow up by a specialist does not offer benefits of mortality in comparison to the follow up by a primary care setting?
The intensity of the treatment is not always accompanied by significant improvements in clinical outcomes. Fisher et al. showed in USA that higher-spending regions received more care than those in lower-spending but do not have better health outcomes or satisfaction with care [28]. The differences in spending in that study were not related to differences in illness or prices but instead to different patterns of practice, being the higher-spending more inpatient-based and more specialist-oriented. The regions with high-intensity practice patterns showed –surprisingly- to be associated both with lower quality of care and even with worse outcomes [29]. Fisher attributes this situation to a complicated succession of events: a boosted medicalization can create more diagnosis but also more pseudodiagnosis (ie diseases that would never have been discovered in the normal course of life of the patient in the absence of active diagnostic interventions) and more useless treatments characterized by unfavourable risk / benefit ratios [30]. Also, with more diseases to manage the doctor could be have a greater probability to ignore essential welfare aspects in favour of interventions of little relevance [31].
It is not easy to transfer these considerations to the context of treatments for diabetic patients.
McAlister identifies one of the causes in the fragmentation of assistance: the larger the care team, the greater the possibility that coordination of care is lacking and that important at-risk conditions are not properly managed by one or more clinicians of the team [19]. This Author proposes this hypothesis taking into account that, in his work, patients sent to specialist advice were in worse general conditions. Instead, in our work no substantial difference in comordibity was found among diabetic subjects followed in different settings. It cannot be assumed that our diabetic patients followed by specialists were exposed to less efficacious therapeutic and diagnostic strategies, in fact the number of PSA assays in male patients and the proportion of influenza vaccinated subjects were not significantly different between the two groups [unpublished data, available at request]. Likely they should be considered the effectiveness of the medical treatments dispensed to diabetic subjects and the type of treated patients.
Observational studies suggest an association between the extent of hyperglycaemia and the risk of death and macrovascular and microvascular disease in patients with type 2 diabetes but three randomized clinical trial comparing intensive versus conventional glycaemic control were not able to detect any reduction in CV disease risk or mortality, being in one of these the risk of fatal endpoints even increased [31-36]. A meta-analysis of fourteen randomized clinical trials did not demonstrate any benefit linked to a more aggressive glycaemic control on cardiovascular [RR=1.11 (0.92-1.35)] or all-cause death risk [RR=1.02 (0.91-1.13)], being at the same time notably increased the risk of severe hypoglycaemia [RR=2.39(1.71-3.34)]. Nevertheless, in that experience it was also noted a reduction of the relative risks of a composite microvascular outcome [RR=0.88 (0.79- 0.97)] and of the risk of retinopathy [RR=0.80 (0.67 -0.94)] [37]. We were –coherently- unable to demonstrate any relationship between glycaemic control and risk of death. The diabetic literature (see for a synthetic review) has mainly considered surrogate endpoints (such as glycaemic values) or complex composite endpoints whose use makes it very difficult to discern the existence of a net effect on mortality [38].
II The ineffectiveness of treatments targeted to glycaemic control on mortality is not surprising considering the general phenotype of the diabetic patients.
In fact, many of these are suffering from diseases that overshadowed the importance of metabolic disease: in our experience ~13 % and ~5% of the whole diabetic2 cohort was affected by malignant neoplasms and by chronic heart failure respectively, without significant differences between patients followed in both settings [unpublished data, available at request] . Furthermore, about ~30% of diabetes type 2 patients were also affected by serious general comorbidity (i.e. Charlson Score ≥4). Diabetes2 disease regards in the Italian setting at least one Italian in ten: in the light of all these considerations it seems absolutely irrational to think of sending such a large mass of patients to specialist advice [39].
III Rather, research should be oriented to select which type of diabetic patients can benefit from specialist advice, at least in relation to the risk of non-fatal endpoints.
The epidemiological reality of the facts should reduce the specialist disease-oriented vision in favour of generalist patient-oriented strategies. The role of the specialist advice deserves some considerations.In the first instance, in our work the metabolic control was worse in patients treated by the specialist. This is quite obvious, since patients sent to second-level counselling are usually the most serious. However, Bonora has particularly insisted on the infrastructural advantages related to the consultation of a specialist team, for the greater availability of access to dietary and nursing assistance [1]. In our experience no differences emerged between the nutritional status of the patients followed by the specialist and that of patients followed by the general practitioner, neither any difference emerged in terms of control of blood pressure or of smoke exposure [unpublished data, available at request]. Secondly, the role of the specialist advice should be explored also by researches tailored on endpoint different from general or cardiovascular mortality: for example, how many patients followed by the specialist undergo less surgical amputations? how many patients suffer less renal or retinal complications related to diabetes? how many patients undergo less hospitalizations related to the diabetic disease? There are no clear answers to these questions yet.
In the modern health services, all people have benefits from general practice: this is particularly true for people with type2 diabetes because many of them are old people, with high degree of multimorbidity and frailty [40]. Emergency medicine and specialized disciplines are fundamental, but the prolonged and special relationship between the general practitioner and her patient is an added value that is unknown to any other health professional General practice faces the needs of people through a patient centred plane of care, not only a disease focused one. Keeping in mind cognitive and performance status, social and family issues of each patient, GPs use an incremental method where all the decisions are provisional and prone to continuous adjustment during whole life.
IV Strength of our research
The observational nature of our approach implied the need to adjust the comparisons in the most appropriate way. We analyzed electronic medical records: this offers important opportunities respect to analyses conducted otherwise (i.e. on administrative databases). We considered a big sample of diabetic subjects followed for a reasonable period of time, adjusting our analyses for important prognostic (i.e. diabetes length) and confounders factors (i.e. co-morbidities, severity of diabetes, lipid and glycemic parameters) through a more complete approach than the one used by the researchers examined by Bonora’s meta-analysis [1, 5-7]. A further guarantee of the validity of our results (see above) is the fact that they have been confirmed using various types of design (restricted vs not restricted) and various types of adjustment (multivariate regression, propensity score)
V Limits of our research
The historical nature of our data suggests cautions both in the analysis and in interpretation. As described, in our main analysis more than half of diabetic patients were excluded because lacking many laboratoristic information. This does not surprise in a real-life dataset: diagnostic tests are not prescribed extensively but usually for a clinical reason and to patients able to undergo them: this selection can introduce a bias. (Appendix E). Nevertheless, we were able to confirm the lack of any association between death risk and specialist consult also in sensitivity approaches conducted excluding any laboratory value, extending in this manner the analysis to most of the sample. Particularly, we also integrated our analyses with propensity-based techniques, which are considered a better approach than regression models for the adjustments of the results of non-randomized studies [17, 41]. Other consideration, our study is based on a prevalent-users-like design, therefore could have been selected patients potentially more resistant to fatal outcomes [42]. However, in this case the bias would consist of a result in favor of the exposure, which did not occur.
Finally, we considered the exposure as a baseline- and not a time-varying variable. This choice in a non-randomized study represents an ITT-like approach and it is widely adopted in the observational literature [9, 44, 45]. We did not take into account the diabetological visits performed during the follow-up while we counted the visits performed in the three-year period before the time zero. This choice was necessary to perform an ITT-like analysis instead of a Per-protocol-like one. A Per-Protocol-like approach would have been prone to serious problems, especially to reverse causation bias. In fact, serious diseases could produce both lower probabilities to be sent to the diabetologist and higher probability of death (i.e., a neoplastic patient could not be sent to the diabetologist because diabetes is no more the primary health concern). This situation could produce biased results, that is an overestimation of the true effect of the intervention. Moreover, a Per-Protocol-like approach would have required adjustments that our database did not allow in fact, MilleInRete is a historical database which includes time data for disease (first diagnosis date) but not for visits (available only in aggregate form per year –Appendix C). It should be noted that 52.6% of our diabetic patients had never been sent on a specialist visit in the three years before the start of the follow-up: this proportion is considerable, and the group is certainly a good comparator. In contrast, 47.5% of patients had undergone at least one diabetes control in the previous three years (32.8% to two or more).
There is no clinical reason to think that previous exposure to diabetes advice would have had no influence on the prognosis of the patients. To be followed by an Antidiabetic Center encourages patients to regular glycemic controls, nursing counseling on diet and life habits, regular control of the feet state, etc. So, we had no reason to think that adopting an 'ITT-like' approach could constitute an incorrect practice. This methodological option is widely used in the observational literature; to cite some examples in the diabetes field, Bowker assessed the relationship between insulin and cancer (5.4 years of follow-up) considering a cohort of diabetics who used insulin for one year before the index date as “exposed to insulin-treatment” [44]. In a similar way, Jonasson considered “exposed to insulin” patients that had taken this drug for six months before the start of the study [45]. In both these examples exposition was not treated as a time-varying factor. It is noteworthy that an-ITT -based approach was used even in the Canadian work we cited [19]. The ITT-approach relies on the assumption that the effect of the intervention lasts enough to be detected. This is a strong assumption but if it has been used to study the effect of individual drugs it is no reason to question its validity for an intervention like the assistance by a diabetes center: in fact, this kind of intervention is multidimensional and it can produce both change in pharmacological treatments and lifestyle change. While an ITT-like approach protects from the problems arising from potential switching between arms, it could dilute the magnitude of the intervention effect [43]. However, we are confident this did not happen, since our analysis shows even a certain trend towards damage (notably confirmed with statistical significance in the Canadian study) [19].
VI Final note 1
As Bonora we are skeptical about the possibility of address this important topic through an experimental approach: a RCT, that for obvious reasons should be organized with the partnership of the general practitioners, should involve 647 general practitioners for 5 years (See Appendix H) [1].
VII Final note 2
The results of Bonora are based on three Italian studies [1, 5-7]. At least one of the authors of the meta-analysis contributed to two of the three included studies [5, 6]. It is noteworthy that in the only international experience that dealt with this topic, mortality was significantly higher in the patients followed by the specialist: HR = 1.17 (1.08-1.27) [19].
Conclusions
The results of the Bonora meta-analysis, distorted by important biases, cannot be considered reliable. To our knowledge, our research is the first Italian epidemiological study in which the relationship between specialist consultations and general mortality has been explored through sufficient adjustments. Since we did not find any relationship between specialist advice and risk of death, we believe the management of most type 2 diabetics should be entrusted with confidence to primary care facilities, involving specialized medicine only for the most challenging cases under the metabolic profile.
Funding
None.
Conflicts of Interest
None
Acknowledgments
We are grateful for the important contribution in the recruitment of MilleinRete- researchers to:
Carraro Alessandro2, Pirolo Giulio1,2,3, Ioverno Enrico1,2,3 ,Franchini Carlo Andrea1,2,3 , De Conto Umberto1,2,3 , Federico Franzoso1,2,3 ,Giuliana Simioni1,2,3 ,Eugenio Visona’1,3 ,Longhi Serenella1,2,3 ,Paola Bassetto3, Musto Martina1,2,3
1. SIMG (Societa’ Italiana di Medicina Generale e delle Cure Primarie)
2. SVEMG (Scuola Veneta di Medicina Generale)
3. General practitioner
Article Info
Article Type
Original ArticlePublication history
Received: Wed 11, Sep 2019Accepted: Tue 24, Sep 2019
Published: Wed 02, Oct 2019
Copyright
© 2023 Battaggia Alessandro. This is an open-access article distributed under the terms of the Creative Commons Attribution License, which permits unrestricted use, distribution, and reproduction in any medium, provided the original author and source are credited. Hosting by Science Repository.DOI: 10.31487/j.JICOA.2019.04.02
Figures & Tables
Table 1: strategies that we adopted for control for confounders and/or prognostic factors potentially infuent on the outcome death.
|
Approaches |
Control procedure done at the stage of design-choice |
Diabetics Target of the adjustment- procedure |
Control procedure done at the stage of data-analysis |
References |
|
A.MAIN ANALYSIS |
None |
Whole cohort of diabetics (all the exposed are compared with all the not exposed) |
1.A Cox Model 1 adjusted for all covariates
|
Table 3 of main text Figure 1 of main text Appendix E -fig E1 |
|
1.B Cox Model 2 adjusted for propensity score (the PS is the main adjustment factor in that represents a surrogate of the randomization process)
|
Appendix G Figure 2 |
|||
|
B.RESTRICTED DESIGN ANALYSIS |
Restricted design |
Sub-cohort of insulin-treated diabetics (all the exposed trated with insulin are compared with all the not exposed treated with insulin) |
2.A Cox model 3 adjusted for all covariates in a restricted design
|
Appendix H Appendix E -fig E2 |
|
2.B Cox model 4 adjusted for propensity score in a restricted design (the PS is the main adjustment factor in that represents a surrogate of the randomization process)) |
Appendix G |
|||
|
C. MATCHED PAIRS DESIGN ANALYSIS |
Matched design (in this case the matching-variable is the Propensity score) |
Diabetics exposed are compared with diabetics not exposed characterized by an identical probability of exposure (=propensity score) |
3A ATE procedure applied to whole cohort
|
Appendix G |
|
3B ATE procedure of applied ony to insulin treated (ie the matching analysis is coupled with a “restricted design”) |
Appendix H |
Table 2: Basal values of the covariates.
|
|
None specialist advice1 (n=3441) |
One specialist advice1 (n=947) |
Two or more specialist advices1 (n=2142) |
|||
|
Covariates |
n |
Means (sd) or perecent |
n |
Means (sd) or perecent |
n |
Means (sd) or perecent |
|
Age (years)2 |
3441 |
69.78 (12.75) |
947 |
66.49 (12.36) |
2142 |
66.08 (12.02) |
|
Proportion of 65+ aged2 |
3441 |
68.46% |
947 |
58.50% |
2142 |
60.27% |
|
Proportion of males2 |
3433 |
52.28% |
946 |
56.23% |
2142 |
55.08% |
|
Proportion of insulin-treated2 |
3441 |
5.20% |
947 |
13.72% |
2142 |
29.69% |
|
Proportion of statin-treated2 |
3441 |
26.82% |
947 |
37.90% |
2142 |
49.11% |
|
Proportion of metformin-treated2 |
3441 |
21.79% |
947 |
40.33% |
2142 |
42.62% |
|
Glycosylated Hemoglobin2 (%) |
1726 |
6.84 (1.16) |
639 |
7.20 (1.32) |
1663 |
7.47 (1.30) |
|
LDL-Cholesterol2 (mg/dl) |
1495 |
121.64 (35.79) |
549 |
113.51 (34.73) |
1386 |
106.80 (31.19) |
|
Triglycerides2 (mg/dl) |
1681 |
143.06 (80.66) |
601 |
152.91 (100.40) |
1490 |
145.32 (93.14) |
|
Charlson score2 (unit) |
3441 |
2.89 (1.63) |
947 |
2.81 (1.58) |
2142 |
2.96 (1.68) |
|
Proportion of Charlson score≥42 |
3441 |
29.43% |
947 |
26.61% |
2142 |
29.97% |
|
Duration of diabetes (years) |
3146 |
13.58 (3.32) |
847 |
13.30 (3.46) |
1804 |
14.41 (3.48) |
1-from 01/01/2006 to 12/31/2008 2-Recorded in year 2008
Note: we did not calculate p values because these statistics are descriptive and not inferential
Table 3: Cox Model 1 (monovariate and multivariate models).
|
|
Monovariate Cox models |
Multivariate Cox model one (n=2686)1,2,3 |
|||
|
Covariates2 |
n |
Hazard Ratio (CI 95%) |
p |
Hazard Ratio (CI 95%) |
p |
|
To be aged65+ |
6530 |
5.13 (4.25-6.19) |
<0.00001 |
5.12 (3.40-7.69) |
<0.0001 |
|
To be male |
6521 |
1.04 (0.92-1.17) |
0.504 |
- |
|
|
To be treated with insulin |
6530 |
2.15 (1.87-2.47) |
<0.00001 |
1.67 (1.27-21.9) |
<0.0001 |
|
To be treated with statins |
6530 |
0.88 (0.78-1.00) |
0.0653 |
0.85 (0.69-1.05) |
0.1430 |
|
To be treated with metformin |
6530 |
0.68 (0.59-0.78) |
<0.00001 |
0.69 (0.55-0.86) |
0.001 |
|
Glycosylated Hemoglobin (for each 1% of increment) |
4028 |
1.07 (1.02-1.13) |
0.006 |
1.08 (0.99-1.17) |
0.070 |
|
LDL-Cholesterol (for each mg/dl of increment) |
3430 |
0.99 (0.99-0.99) |
<0.00001 |
0.99 (0.99-0.99) |
0.023 |
|
Triglycerides (for each mg/dl of increment) |
3772 |
0.99 (0.99-1.00) |
0.254 |
- |
|
|
To have a Charlson score≥4 |
6530 |
2.77 (2.46-3.12) |
<0.00001 |
5.96 (3.52-10.11) |
<0.0001 |
|
Duration of diabetes (for each additional year) |
5797 |
1.05 (1.04-1.07) |
<0.00001 |
1.01 (0.98-1.03) |
0.438 |
|
Having been sent to one specialist visit |
6530 |
0.85 (0.71-1.03) |
0.1090 |
1.01 (0.74-1.38) |
0.933 |
|
Having been sent to two or more specialist visits |
6530 |
1.03 (0.90-1.17) |
0.5970 |
1.12 (0.88-1.43) |
0.321 |
|
Interaction (be aged65+)#( have a Charlson score≥4 ) |
- |
- |
- |
0.30 (0.17-0.53) |
<0.0001 |
1-The pattern of covariates shows to be satisfactory: Pregibon’s test z=-0.64 p=0.520
2-The assumption of proportional risks was respected: test for Schoenfeld’s residuals chi2 16.97 (df=11) p=0.1089
3- Three thousand eight hundred forty four patients were excluded because of missing data (See main text and Appendix D)
References
- Bonora E, Monami M, Bruno G, Zoppini G, Mannucci E (2018) Attending Diabetes Clinics is associated with a lower all-cause mortality. A meta-analysis of observational studies performed in Italy. Nutr Metab Cardiovasc Dis 28: 431-435. [Crossref]
- Sattar N (2013) Revisiting the links between glycaemia, diabetes and cardiovascular disease. Diabetologia 56: 686-695. [Crossref]
- (2018) Scuola Veneta di Medicina generale MilleinRete – Il database della medicina generale del Veneto.
- Regione Veneto Giunta Regionale – 9^ legislatura Allegato A alla Dgr n. 759 del 14 maggio 2015 Percorso Diagnostico Terapeutico Assistenziale (PDTA) regionale per la gestione integrata della persona con Diabete Tipo 2.
- Zoppini G, Verlato G, Bonora E, Muggeo M (1999) Attending the diabetes center is associated with reduced cardiovascular mortality in type 2 diabetic patients: the Verona Diabetes Study. Diabetes Metab Res Rev 15: 170-174. [Crossref]
- Bruno G, Merletti F, Biggeri A, Bargero G, Ferrero S et al. (2005) Fibrinogen and AER are major independent predictors of 11-year cardiovascular mortality in type 2 diabetes: the Casale Monferrato Study. Diabetologia 48: 427-434. [Crossref]
- Baviera M, Avanzini F, Marzona I, Tettamanti M, Vannini T et al. (2017) Cardiovascular complications and drug prescriptions in subjects with and without diabetes in a Northern region of Italy, in 2002 and 2012. Nutr Metab Cardiovasc Dis 27: 54-62. [Crossref]
- Shea BJ, Grimshaw JM, Wells GA, Boers M, Andersson N et al. (2007) Development of AMSTAR: a measurement tool to assess the methodological quality of systematic reviews. BMC Med Res Methodol 7: 10. [Crossref]
- (2018) Cochrane Methods- Bias ROBINS-I tool (Risk of Bias in Non-randomized Studies of Interventions).
- (2018) X Report Health Search Istituto di ricerca della SIMG: Societa’ Italiana di medicina generale e delle Cure Primarie.
- Hill AB (1965) The environment and disease: Association or causation? Proc R Soc Med 58: 295-300. [Crossref]
- Charlson ME, Charlson RE, Peterson JC, Marinopoulos SS, Briggs WM et al. (2008) The Charlson comorbidity index is adapted to predict costs of chronic disease in primary care patients. J Clin Epidemiol 61: 1234-1240. [Crossref]
- Grambsch PM, Therneau TM (1994) Proportional hazards tests and diagnostics based on weighted residuals. Biometrika 81: 515-526.
- Pregibon D (1979) Data analytic methods for generalized linear models. Appl Stat 29: 15-24.
- Cox DR, Snell EJ (1968) A General Definition of Residuals. J Royal Stat Society 30: 248-275.
- Abadie A, Imbens GW (2006) Large sample properties of matching estimators for average treatment effects. Econometrica 74: 235-267.
- D’Agostino RB (1998) Tutorial in biostatistics Propensity score methods for bias reduction in the comparison of a treatment to a non-randomized control group. Statist Med 17: 2265-2281. [Crossref]
- Harding JL, Shaw JE, Peeters A, Guiver T, Davidson S et al. (2014) Mortality trends among people with type 1 and type 2 diabetes in Australia: 1997-2010. Diabetes Care 37: 2579-2586. [Crossref]
- McAlister FA, Majumdar SR, Eurich DT, Johnson JA (2007) The effect of specialist care within the first year on subsequent outcomes in 24,232 adults with new-onset diabetes mellitus: population-based cohort study. Qual Saf Health Care 16: 6-11. [Crossref]
- Muggeo M, Verlato G, Bonora E, Bressan F, Girotto S et al. (1995) The Verona Diabetes Study: a population-based survey on known diabetes mellitus prevalence and 5-year all-cause mortality. Diabetologia 38: 318-325. [Crossref]
- Anyanwagu U, Mamza J, Donnelly R, Idris I (2016) Comparison of cardiovascular and metabolic outcomes in people with type 2 diabetes on insulin versus non-insulin glucose-lowering therapies (GLTs): A systematic review and meta-analysis of clinical trials. Diabetes Res Clin Pract 121: 69-85. [Crossref]
- Saenz A, Fernandez-Esteban I, Mataix A, Ausejo M, Roque M et al. (2005) Metformin monotherapy for type 2 diabetes mellitus. Cochrane Database Syst Rev 20: CD002966. [Crossref]
- Ravnskov U, Diamond DM, Hama R, Hamazaki T, Hammarskjöld B et al. (2016) Lack of an association or an inverse association between low-density-lipoprotein cholesterol and mortality in the elderly: a systematic review. BMJ Open 6: e010401. [Crossref]
- Chang YH, Hsieh MC, Wang CY, Lin KC, Lee YJ (2013) Reassessing the benefits of statins in the prevention of cardiovascular disease in diabetic patients--a systematic review and meta-analysis. Rev Diabet Stud 10: 157-170. [Crossref]
- Colhoun HM, Betteridge DJ, Durrington PN, Hitman GA, Neil HA et al. (2004) Primary prevention of cardiovascular disease with atorvastatin in type 2 diabetes in the Collaborative Atorvastatin Diabetes Study (CARDS): multicentre randomised placebo-controlled trial. Lancet 364: 685-696. [Crossref]
- Knopp RH, d'Emden M, Smilde JG, Pocock SJ (2006) Efficacy and safety of atorvastatin in the prevention of cardiovascular end points in subjects with type 2 diabetes: the Atorvastatin Study for Prevention of Coronary Heart Disease Endpoints in non-insulin-dependent diabetes mellitus (ASPEN). Diabetes Care 29: 1478-1485. [Crossref]
- Wanner C, Krane V, Marz W, Olschewski M, Mann JF et al. (2005) German Diabetes and Dialysis Study Investigators. Atorvastatin in patients with type 2 diabetes mellitus undergoing hemodialysis. N Engl J Med 353: 238-248. [Crossref]
- Fisher ES, Wennberg DE, Stukel TA, Gottlieb DJ, Lucas FL et al. (2003) The implications of regional variations in Medicare spending. Part 2: health outcomes and satisfaction with care. Ann Intern Med 138: 288-298. [Crossref]
- Fisher ES (2003) Medical care--is more always better? N Engl J Med 349: 1665-1667. [Crossref]
- Fisher ES, Welch HG (1999) Avoiding the unintended consequences of growth in medical care: how might more be worse? JAMA 281: 446-453. [Crossref]
- Stratton IM, Adler AI, Neil HA, Matthews DR, Manley SE et al. (2000) Association of glycaemia with macrovascular and microvascular complications of type 2 diabetes (UKPDS 35): prospective observational study. BMJ 321: 405-412. [Crossref]
- Khaw KT, Wareham N (2006) Glycated hemoglobin as a marker of cardiovascular risk. Curr Opin Lipidol 17: 637-643. [Crossref]
- Selvin E, Ning Y, Steffes MW, Bash LD, Klein R et al. (2011) Glycated hemoglobin and the risk of kidney disease and retinopathy in adults with and without diabetes. Diabetes 60: 298-305. [Crossref]
- Gerstein HC, Miller ME, Byington RP, Bigger JT, Buse JB et al. (2008) Effects of intensive glucose lowering in type 2 diabetes. N Engl J Med 358: 2545-2559. [Crossref]
- Patel A, MacMahon S, Chalmers J, Neal B, Billot L et al. (2008) Intensive blood glucose control and vascular outcomes in patients with type 2 diabetes. N Engl J Med 358: 2560-2572. [Crossref]
- Duckworth W, Abraira C, Moritz T, Reda D, Emanuele N et al. (2009) Glucose control and vascular complications in veterans with type 2 diabetes. N Engl J Med 360: 129-139. [Crossref]
- Hemmingsen B, Lund SS, Gluud C, Vaag A, Almdal T et al. (2011) Intensive glycaemic control for patients with type 2 diabetes: systematic review with meta-analysis andtrial sequential analysis of randomised clinical trials. BMJ 343: d6898 [Crossref]
- Avogaro A (2016) [Cardiovascular disease in diabetic patients: risk factors, clinical history and prevention]. G Ital Cardiol (Rome)17: 3S-12S. [Crossref]
- EPICENTRO Il portale dell'epidemiologia per la sanità pubblica - a cura dell'Istituto superiore di sanità La prevalenza di diabete in Italia dal 1980 al 2013.
- Starfield B, Shi L, Macinko J (2005) Contribution of primary care to health systems and health. Milbank Q 83: 457-502. [Crossref]
- Rubin B (2007) The design versus the analysis of observational studies for causal effects: Parallels with the design of randomized trials. Stat Med 26: 20-36.
- Ray WA (2003) Evaluating medication effects outside of clinical trials: new-userdesigns. Am J Epidemiol 158: 915-920. [Crossref]
- Higgins JPT, Sterne JAC, Savović J, Page MJ, Hróbjartsson A et al. (2016) A revised tool for assessing risk of bias in randomized trials. Cochrane Method.
- Bowker SL, Majumdar SR, Veugelers P, Johnson JA (2006) Increased cancer-related mortality for patients with type 2 diabetes who use sulfonylureas or insulin. Diabetes Care 29: 254-258. [Crossref]
- Jonasson JM, Ljung R, Talbäck M, Haglund B, Gudbjörnsdòttir S et al. (2009) Insulin glargine use and short-term incidence of malignancies-a population-based follow-up study in Sweden. Diabetologia 52: 1745-1754. [Crossref]