Single Nucleotide Polymorphisms in Four Genes Associated with Survival Outcome for Patients with Head and Neck Squamous Cell Carcinoma
A B S T R A C T
Background: This study aimed to use a bioinformatics pipeline to explore the underlying mechanisms and identify genetic mutations that can be utilized to prognosticate individuals with head and neck squamous cell carcinoma (HNSCC).
Methods: SNP-related data was accessed using the TCGA database. Mutation and expression analyses were performed between the mutant samples and wild-type samples. Kaplan-Meier analysis was conducted to select the candidate mutant genes that affect overall survival. Correlation analysis, GSEA analysis and drug sensitivity analysis of the candidate genes were performed.
Results: Down-regulation of FAT1, KMT2B, XIRP2 and ZNF347 expression were observed in the tumors with mutations. Kaplan-Meier analysis indicated that reduced levels of FAT1, XIRP2 was significantly associated with better overall survival, while reduced levels of KMT2B, and ZNF347 were significantly correlated to worse overall survival. Additionally, SNPs of the four genes were found to participate in several pathways associated with HNSCC development. Furthermore, FAT1 mutation was sensitive to several anti-tumor drugs, such as PI-103, Belinostat and Ruxolitinib.
Conclusion: SNPs in FAT1, KMT2B, XIRP2 and ZNF347 may be used as prognostic biomarkers in the treatment of HNSCC.
Keywords
Bioinformatics, single nucleotide polymorphisms, prognosis, HNSCC
Introduction
Head and neck squamous cell carcinoma (HNSCC) is a frequently diagnosed type of head and neck cancers [1]. Worldwide, more than 550,000 cases of HNSCC were reported annually, and greater than 300,000 patients die from this disease [2]. It mainly involves the oral cavity, larynx, oropharynx, and hypopharynx [3]. Genetic mutations, HPV infections, and environmental risk factors have been considered to have a crucial role in the development of HNSCC [4]. Approximately half of all HNSCC patients are originally diagnosed at loco-regionally advanced disease [5]. The main treatments of HNSCC are surgery, chemotherapy, radiotherapy, and molecular-targeted drugs [6]. However, the prognosis of HNSCC is still poor, with an approximately 40-50% 5-year survival rate [7]. The current tumor-node-metastasis (TNM) system is inadequate at predicting prognosis and treatment benefits as it is entirely anatomy-based. Thus, it is necessary to investigate the potential molecular mechanisms by early screening and intervention in HNSCC patients, as it can lead to the development of individualized treatment.
In the past decade, bioinformatics analysis based on high-throughput technologies has been widely utilized to screen biomarkers and detect significant somatic nucleotide polymorphisms for the diagnosis and prognosis of cancer [8]. Single nucleotide polymorphisms (SNPs) are the most common type of DNA change in the human genome [9]. Most SNPs have no effect on physical health. Nevertheless, some SNPs are known to be linked with specific responses to medications, vulnerability to environmental factors and toxins, disease development and progression, and drug toxicity [10]. Zhu et al. showed that SNPs that change conserved amino acids might be linked to cancer susceptibility [11].
To date, several studies have investigated genetic SNPs in HNSCC, which facilitates the identification of high-risk patients. Bergmann et al. showed that two SNPs, Asp299Gly (rs4986790) and Thr399Ile (rs4986791) of TLR4, were associated with the development of HNSCC [12]. In addition, TLR4 genotype was likely to have an impact on the success of anticancer treatment. Nagalakshmi et al. indicated that mutations in the tyrosine kinase domain (TK) of EGFR are more specific to HNSCC disease at a progressive stage, which may lead to a worse clinical outcome [13]. Lehnerdt et al. revealed that SNPs of gene GNB3 affect the prognosis of HNSCC patients. However, few studies have integrated bioinformatics analysis for the identification of SNP-based biomarkers in HNSCC [14]. Furthermore, the association between SNPs and the prognosis of HNSCC has not been fully clarified.
Based on available data, the purpose of this study was to perform a comprehensive analysis of DNA sequence polymorphisms in HNSCC. We retrieved multiple HNSCC-related SNPs and gene expression data from The Cancer Genome Atlas (TCGA) database and analyzed it by integrating our bioinformatics approach. We also built a PPI network of mutant genes and conducted GO and KEGG pathway analysis. Finally, we identified mutated genes that were associated with HNSCC prognosis. Subsequently, correlation analyses, GSEA analysis and drug sensitivity of the candidate mutant genes were performed.
Materials and Methods
I Data Acquisition and Preprocessing
Messenger RNA (mRNA) and somatic mutation data were accessed from the TCGA database via Genomic Data Commons (GDC) data portal (Link) [15]. As the SNP raw data in the TCGA database is not available to the public, the HNSCC SNP‐related data that have been processed along with the raw mRNA data were downloaded. Raw mRNA was obtained from 546 samples (44 normal samples and 502 HNSCC samples). The mutations were retrieved from HNSCC sample SNP data. Level 3 FPKM data of mRNA was integrated and standardized by limma package of R software, and differentially expressed genes (DEGs) in HNSCC and normal samples were screened with the criteria of |log2 fold change|≥1 and P<0.05. Mutated genes were analyzed by the VarScan method.
II Pathway Enrichment Analysis
In order to determine the role of the mutant genes in signaling transduction, genes in more than 15 mutant samples underwent Gene Ontology (GO) enrichment analysis and the Kyoto Encyclopedia of Genes and Genomes (KEGG) pathways using ClusterProfiler package of R software. Thus, we were able to extract the HNSCC-related pathways and biological function, such as biological process (BP), cellular component (CC), molecular function (MF). P-value of <0.05 was set as the cut-off.
III Construction of PPI Network and Analysis of Mutation and Expression
To better assess the protein interactions among genes present in 15 or more mutant samples systematically, we input them into the STRING 11.5 (Search Tool for the Retrieval of Interacting Genes/Proteins) database, and interactions with score >0.3 were selected [16]. STRING is a widely used system of known and potential protein-protein interactions (PPIs). The PPI networks were visualized through Cytoscape software (version 3.70). To elucidate the function of mutations in HNSCC development, we further analyzed gene expression among mutated and wild samples bases in the TCGA database. P value<0.05 represents statistical significance.
IV Association of Selected Mutant Genes with HNSCC Survival
GEPIA is an advanced interactive web server for researchers to analyze RNA sequencing data from 9,736 tumors and 8,587 normal samples from TCGA and GTEx projects by using a conventional processing pipeline [17]. Survival plots were utilized to assess the effect of genes with more than 15 mutant samples on the overall survival of HNSCC patients based on the standard of p-value<0.05. Differentially expressed mutant genes were considered as candidate mutant genes that may relate to the prognosis of HNSCC.
V GSEA Analysis of the Mutant Genes
The GSEA (Gene set enrichment analysis) approach was utilized to find out the differentially expressed pathways between high-expression and low-expression of candidate mutant genes. GSEA 4.0 (JAVA version) was performed using the Gene Set Enrichment Analysis website (Link) with the MSigDB [18]. After performing 1000 permutations, phenotypes with a false discovery rate (FDR) of < 0.05 represented statistical significance.
VI Drug Sensitivity of the Mutant Genes
GSCALite is a web-based database for gene set cancer analysis (Link). It contains analytic modules data from 3 major sources, including multi-omics information from TCGA, drug sensitivity information of Genomics of Drug Sensitivity in Cancer (GDSC) and Cancer Therapeutics Response Portal (CTRP) database. Drugs sensitivity data as well as gene expression profiling data of cancer cell lines from GDSC and CTRP database were integrated into GSCALite. The expression of every gene was determined using Spearman correlation analysis using small molecule/drug sensitivity (IC50). Any correlation with a false discovery rate (FDR< 0.05) was considered significant.
Result
I Landscape of Mutation Profiles and Screening Differentially Expressed Genes
Somatic mutation profiles of 477 HNSCC samples from the TCGA database were downloaded. We applied the “Genvis” package of R software to visualize the results according to the mutated genes. Mutation information of the genes was shown in waterfall plot (Figure 1). The result exhibited the presence of 689 mutated genes in greater than 15 samples. Among them, 20 genes were mutated in greater than 50 samples. The top 5 genes with the most significant mutations were tumor protein p53 (TP53), titin (TTN), FAT atypical cadherin 1 (FAT1), mucin 16, cell surface associated (MUC16), cyclin-dependent kinase inhibitor 2A (CDKN2A). In addition, gene expression data of 546 samples, including 44 normal samples and 502 HNSCC samples, were downloaded from the TCGA database with the criteria of |log2 fold change|≥1 and P<0.05. Overall, 8634 genes were recognized as DEGs in the HNSCC gene set, with 6536 increased and 2098 decreased genes, as showed in (Figure 2).
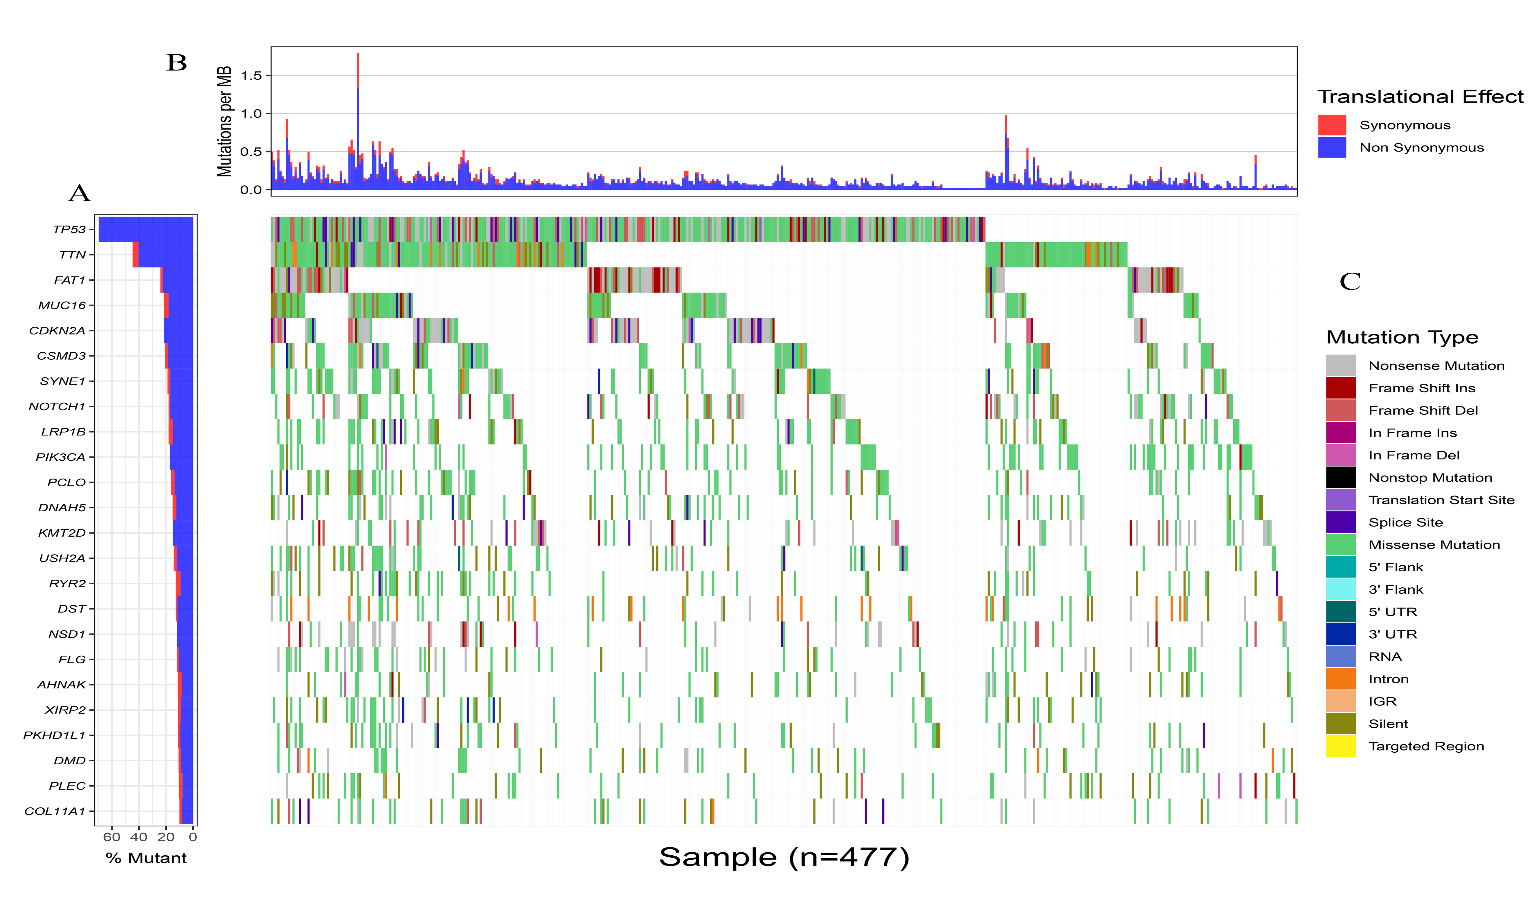
Figure 1: Landscape of genes that mutated in greater than 50 HNSCC samples. A) Top 20 genes with the most significant mutations. B) Translational effect. C) Mutation type.
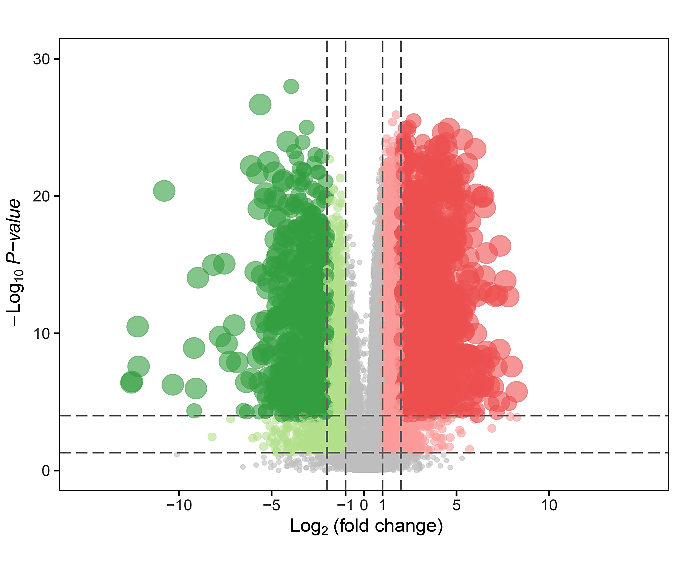
Figure 2: Volcano plot of differentially expressed genes. The x-axis indicates the gene level differences through a log transformed fold change. The y-axis indicates significance by –log10 transformed p-value value. Red dot indicates up-regulated genes and green dot indicates down-regulated genes.
II Analysis of Functional and Pathway Enrichment
In order to further explore the functional role of mutated genes in greater than 15 samples and key pathways in HNSCC patients, GO function and KEGG pathway enrichment analyses were performed. As shown in (Supplementary Figure 1), GO analysis indicated that the mutated genes were mainly enhanced in cell-cell adhesion through plasma-membrane adhesion molecules of a biological pathway. For cell compartments, mutated genes were largely enriched in the extracellular matrix. For molecular function, mutated genes were highly enriched in actin binding. KEGG pathway enrichment analyses identified that those mutated genes were largely found in human papillomavirus (HPV) infection, focal adhesion and PI3K−Akt signaling pathway.
III Assessment of PPI Network and Analysis of Mutation and Expression
All mutated genes in greater than 15 samples were submitted to STRING, and a PPI network was constructed. We visualized the PPI network via the Cytoscape software. As shown in (Supplementary Figure 2), a total of 667 nodes and 7132 edges were identified for these genes. Gene expression analysis between mutated samples and wild-type samples were performed. Results indicated that the expressions of the four genes in the mutant samples were significantly lower than wild samples, including FAT1, KMT2B, XIRP2 and ZNF347, as shown in (Figure 3).
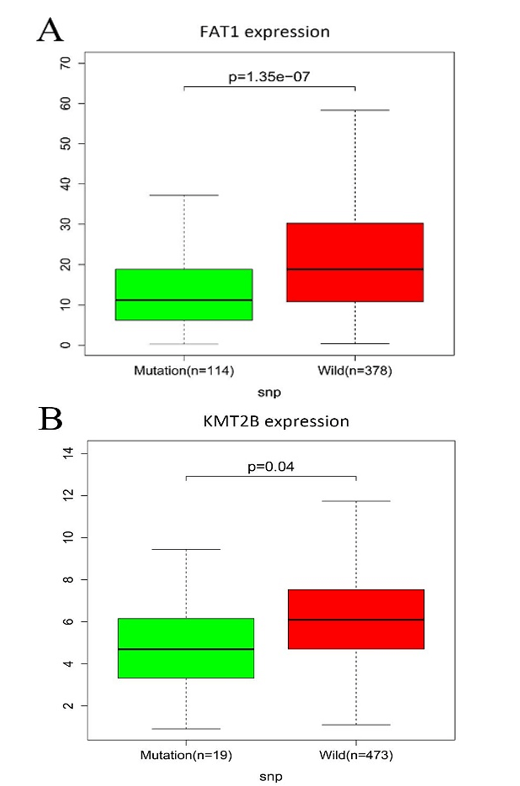
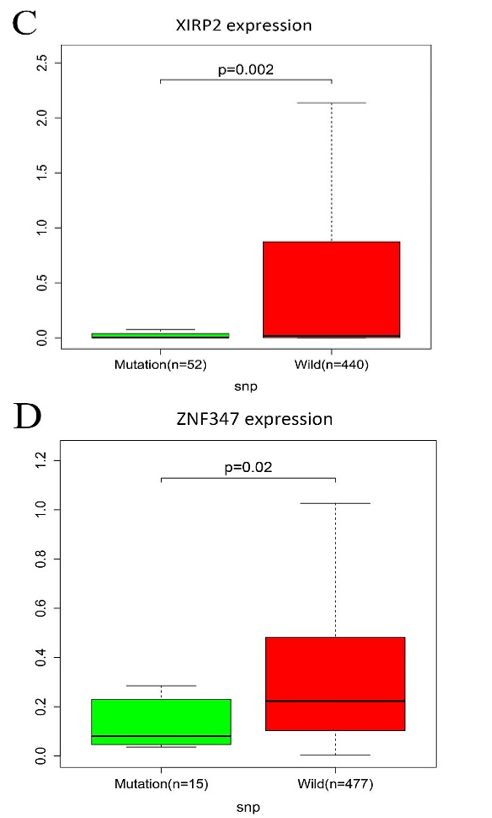
Figure 3: The connection among mutation and expression in FAT1, KMT2B, XIRP2 and ZNF347. A) FAT1. B) KMT2B. C) XIRP2. D) ZNF347. Expression levels of FAT1, KMT2B, XIRP2 and ZNF347 in the mutant HNSCC samples were reduced.
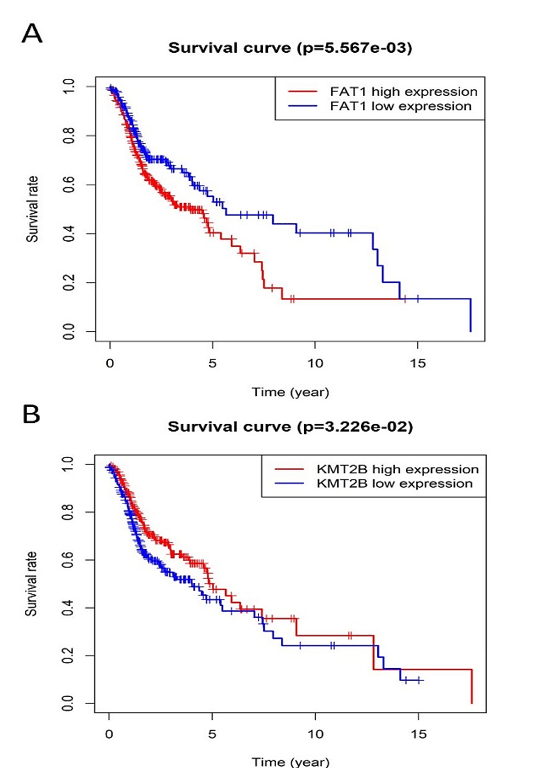
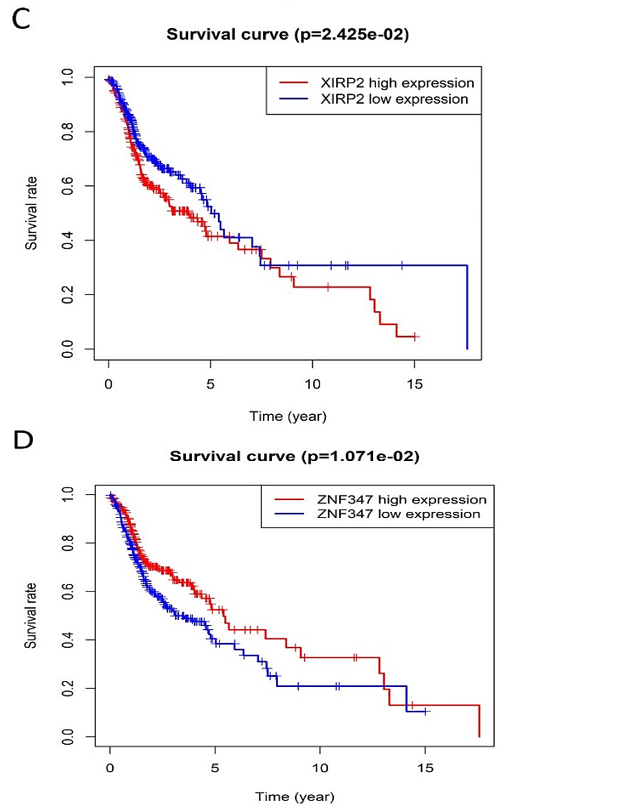
Figure 4: Kaplan-Meier survival plot for the overall survival between high and low expression of FAT1, KMT2B, XIRP2 and ZNF347. A) FAT1. B) KMT2B. C) XIRP2. D) ZNF347. High levels of FAT1, XIRP2 was associated with worse overall survival, while high expression of KMT2B, ZNF347 were associated with better overall survival.
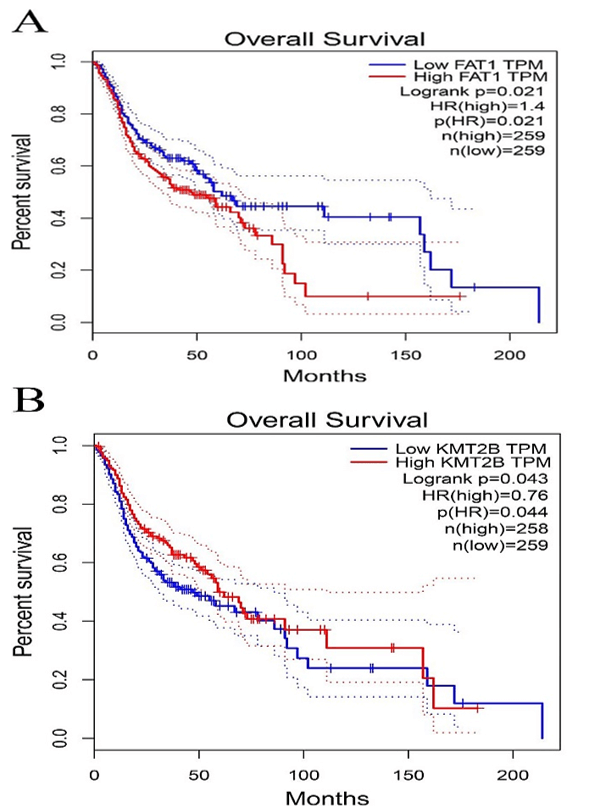
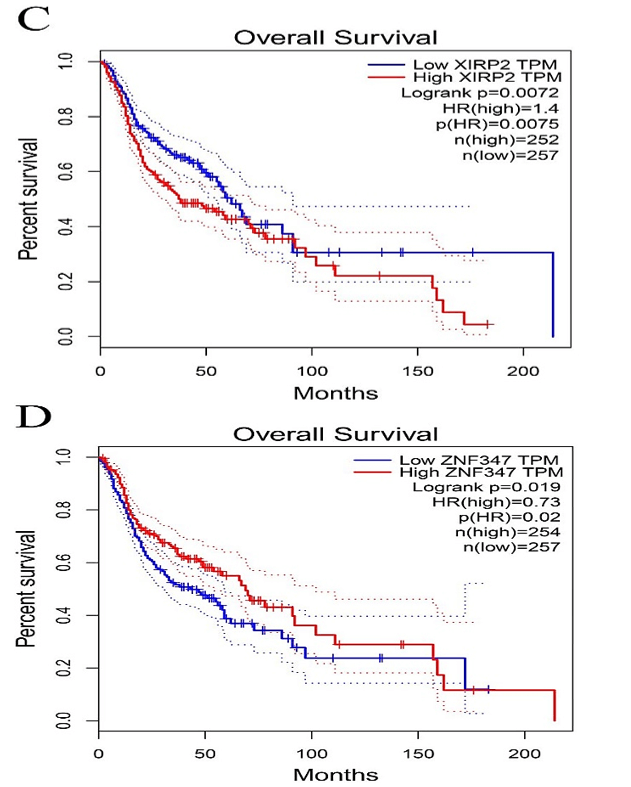
Figure 5: Comparison of Kaplan-Meier survival base on GEPIA database. A) FAT1. B) KMT2B. C) XIRP2. D) ZNF347. FAT1 and XIRP2 were negatively associated with survival rate, while KMT2B and ZNF347 were positively associated with survival rate.
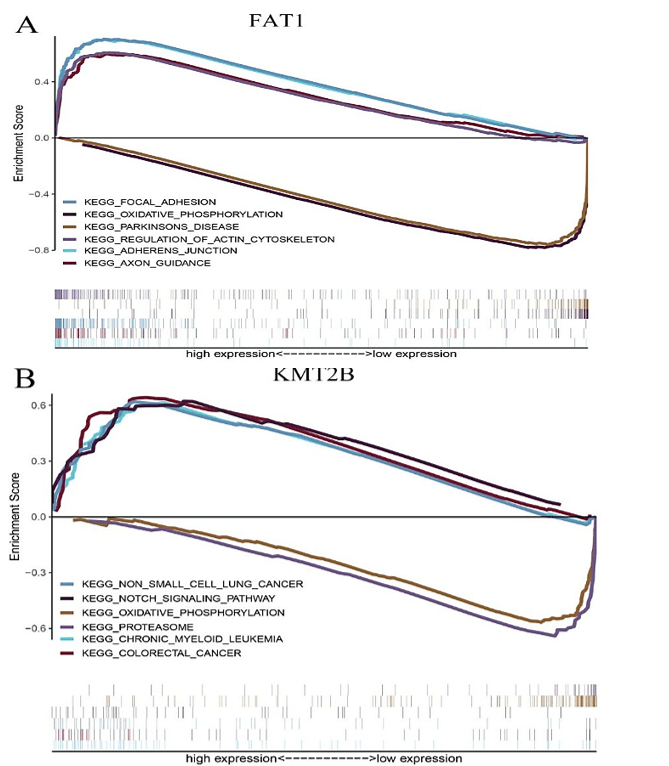
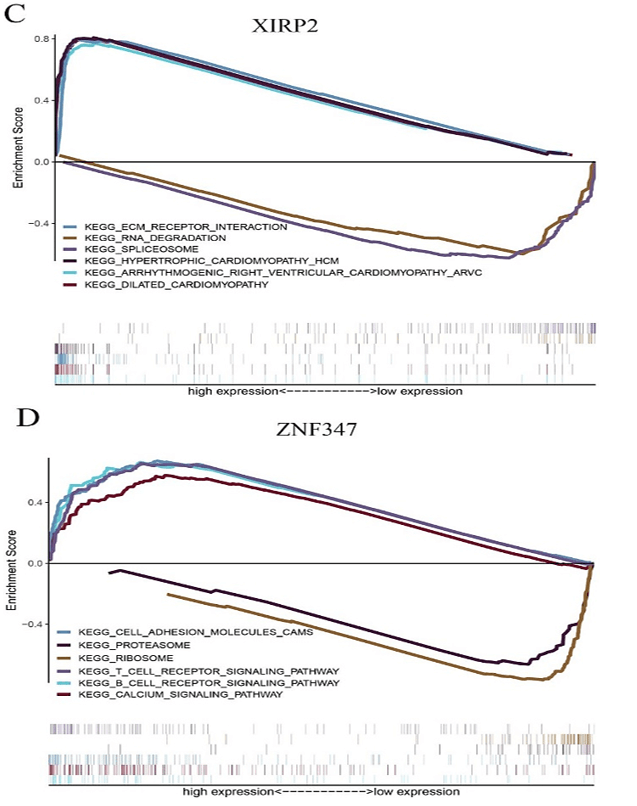
Figure 6: The GSEA enrichment analysis for pathways with FAT1, KMT2B, XIRP2 and ZNF347. The expression of the four genes were separated into a high and a low-expression group based on the median gene expression, respectively. A) FAT1. B) KMT2B. C) XIRP2. D) ZNF347.
IV Survival Analysis of FAT1, KMT2B, XIRP2 and ZNF347
The survival analysis of HNSCC patients with high and low expressions of the four genes (FAT1, KMT2B, XIRP2 and ZNF347) was performed by the Kaplan-Meier method combined with follow-up data. As shown in (Figure 4), results from Kaplan-Meier analysis indicated that increased expression levels of FAT1 and XIRP2 were correlated to worse overall survival. However, reduced expression of KMT2B and ZNF347 were correlated to worse overall survival. In addition, a comparison of Kaplan-Meier survival base on GEPIA also indicated that FAT1 and XIRP2 were negatively associated with survival rate, while KMT2B and ZNF347 were positively associated with survival rate (Figure 5).
V GSEA Analysis and Drug Sensitivity of the Four Mutated Genes
FAT1, KMT2B, XIRP2 and ZNF347 expression were separately allocated into a high and low-expression group based on median gene expression levels. As shown in (Figure 6), GSEA analysis was then conducted to identify KEGG pathways that were differentially regulated by FAT1, KMT2B, XIRP2 and ZNF347 among the high and low expression group, furthermore, we utilized GSCALite platform to analyze drug sensitivity of mutated FAT1, KMT2B, XIRP2 and ZNF347 (Figure 7). The results indicated that mutation of FAT1 was sensitive to PI-103, Belinostat and Ruxolitinib, both in CTRP and GDSC database. On the other hand, mutation of KMT2B was resistant to necrosulfonamide, PX-12, and panobinostat in the CTRP database.
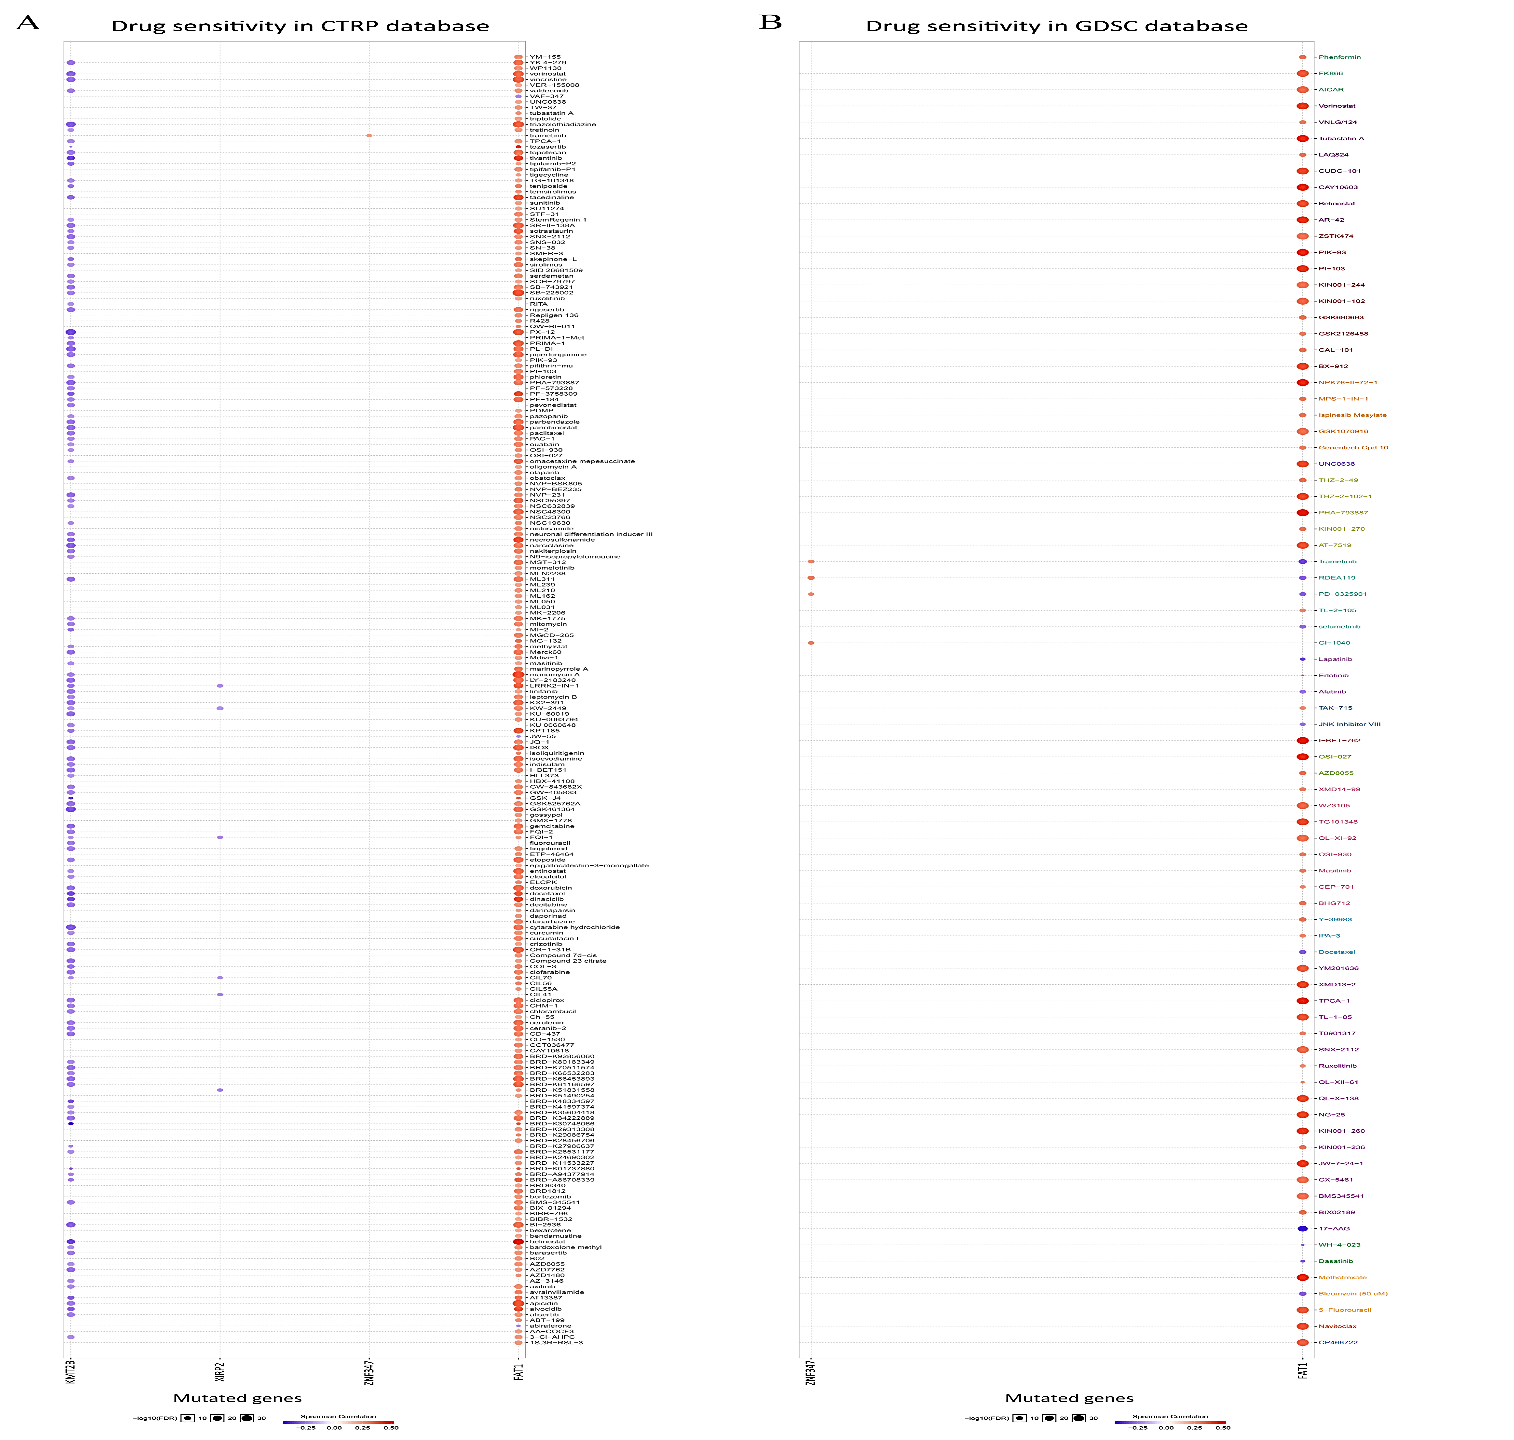
Figure 7: Drug sensitivity and resistance analysis for mutation of FAT1, KMT2B, XIRP2 and ZNF347 in CTRP and GDSC database. A) CTRP database. B) GDSC database. The blue represents drug sensitivity, while red represent drug resistance. The size of the nodes represents the level of significance.
Discussion
HNSCC is a type of malignant epithelial tumor arising from the dysregulation of multiple genes [19]. Disease-specific survival in HNSCC is poor, particularly when the tumor locally invades adjacent healthy tissue and metastasizes to cervical lymph nodes. In recent years, SNPs in genes have been studied in the initiation and processes of many cancers and are promising biomarkers for diagnosis and individual therapy [20]. Therefore, it is necessary to explore the role of genetic variation in HNSCC and investigate underlying molecular mechanisms involved in the development of HNSCC.
In this study, we utilized bioinformatics to screen DEGs and mutant genes in HNSCC samples based on the TCGA database. GO term analysis indicated that the mutant genes were substantially highly enriched in biological processes such as cell-cell adhesion via plasma-membrane adhesion molecules. KEGG pathway data indicated that these mutant genes were significantly enriched in HPV infection, focal adhesion and PI3K-Akt signaling pathway. Result from KEGG and GO term enrichment analysis demonstrated the potential mechanisms of mutant genes in the development of HNSCC.
On the other hand, results from mutation and expression analyses indicated that expression levels of FAT1, KMT2B, XIRP2 and ZNF347 in the mutant HNSCC samples were reduced. Kaplan-Meier survival analysis showed that high levels of FAT1, XIRP2 was associated with worse overall survival, while low expression of KMT2B, ZNF347 were associated with poor overall survival. FAT1 is a part of the cadherin gene superfamily. It was previously described to be a tumor-suppressor gene and has a vital function in directed cell migration and modulating cell-cell contact [21]. A study demonstrated that the inactivation of FAT1 through somatic mutations or deletions is found in multiple human cancers to promote tumorigenesis, including HNSCC [22]. However, whether the expression level affects the overall survival of patients with HNSSC is worth exploring further. Kim et al. indicated that mutation of FAT1 was significantly associated with longer overall survival in HNSCC; the result was consistent with this study [23]. Additionally, results from GSEA analysis in the study showed that mutation of FAT1 is associated with the oxidative phosphorylation pathway. A report revealed that an extensive range of oxidative phosphorylation deficits could reduce the accessibility of ATP in the process of malignancies and tumor cell expansion [24].
KMT2B is a gene that plays a role in histone modification [25]. Previous studies suggested that SNPs in KMT2B were significantly associated with endometrial carcinoma, esophageal sarcomatoid carcinoma and colorectal cancer [26-28]. In this study, GSEA analysis indicated that SNPs in KMT2B were significantly enriched in the proteasome pathway. The proteasome pathway is a vital regulator of cell-cycle arrest and apoptosis, and dysregulation of the proteasome might have an impact on tumor advancement, drug resistance, and varied immune surveillance [29]. Thus, the proteasome pathway is a promising and new treatment target in cancer.
XIRP2, also called CMYA3, is a part of the actin-binding Xin-repeat-containing protein family, the vital role of mutated XIRP2 has been reported in bladder cancer [30]. ZNF347, also known as ZNF1111, is ubiquitously expressed in the salivary gland. GSEA analysis revealed that SNPs in XIRP2 were involved in the extracellular matrix (ECM)-receptor interaction pathway, and SNPs in ZNF347 were involved in the ribosome pathway. The ECM could directly affect the process of tumor shedding, adhesion, degradation, movement, and hyperplasia [31]. ECM is strongly expressed in prostate cancer tissue and participates in the lymphatic metastasis of gastric carcinomas [32, 33]. Ribosomes are responsible for translating the mRNAs into functional proteins [34]. Li et al. showed that the expression of p90 ribosomal S6 kinase 2 (RSK2) is linked with the invasive and metastatic potential of cancer cells [35]. In addition, Sim et al. indicated that some human ribosomal genes including RPeL27, RPeL43, and RPeL41 were significantly upregulated in nasopharyngeal carcinoma cell lines compared to normal control at both transcript and protein levels [36].
The examination of drug sensitivity and resistance to the four mutant genes was performed based on GSCALite data, as gene polymorphism may have an impact on clinical responses to therapy and can serve as a possible biomarker for drug selection. The results of GSCALite showed that mutation of FAT1 was sensitive to PI-103, Belinostat and Ruxolitinib both in CTRP and GDSC database. These drugs have an anticancer effect that may contribute to the treatment of HNSCC. PI-103 is a novel lipid kinase inhibitor that targets the PI3K signaling pathway with high antitumor activity in glioma, non-small cell lung cancer cells and human leukemic cell lines, because of its ability to simultaneously block PI3Kalpha and both mTOR complexes [37]. Belinostat, a type of histone deacetylase inhibitor, might serve as a promising compound due to its strong anticancer activity [38]. Lu et al. reveal that Belinostat inhibited tumor cell growth by inactivating the Wnt/β-catenin signaling pathway and promoting apoptosis via regulation of the PKC pathway in breast cancer [39]. Ruxolitinib, a small molecule inhibitor of Janus Kinases 1/2 (JAK 1/2), is recently being evaluated as a combination therapy along with chemotherapeutics, such as Paclitaxel and Capecitabine, for the therapy of pancreatic cancer, breast cancer, and ovarian cancer [40].
Conclusion
In conclusion, the results of this study reveal that mutations in FAT1, KMT2B, XIRP2 and ZNF347 were substantially relevant to its corresponding expression level and were participated in several pathways associated with HNSCC development. Kaplan-Meier survival analysis revealed that the expression level of FAT1, KMT2B, XIRP2 and ZNF347 was significantly associated with overall survival. In addition, this study identified several drugs that demonstrated sensitivity or resistance to the four mutated genes in CTRP and GDSC database. The results from this study may contribute to the evaluation of prognosis and development of future individualized HNSCC treatment.
Acknowledgment
This study was supported by the Basic Ability Enhancement Project of Young Teachers in Guangxi Zhuang Autonomous Region (No. 2018KY0134), Guangxi Science and Technology Cooperation and Exchange Project (GKH 159905-2-11), Central Guided Local Science and Technology Development Project (GK ZY18076006), and Guangxi Science and Technology Program Project (GK AD17129013).
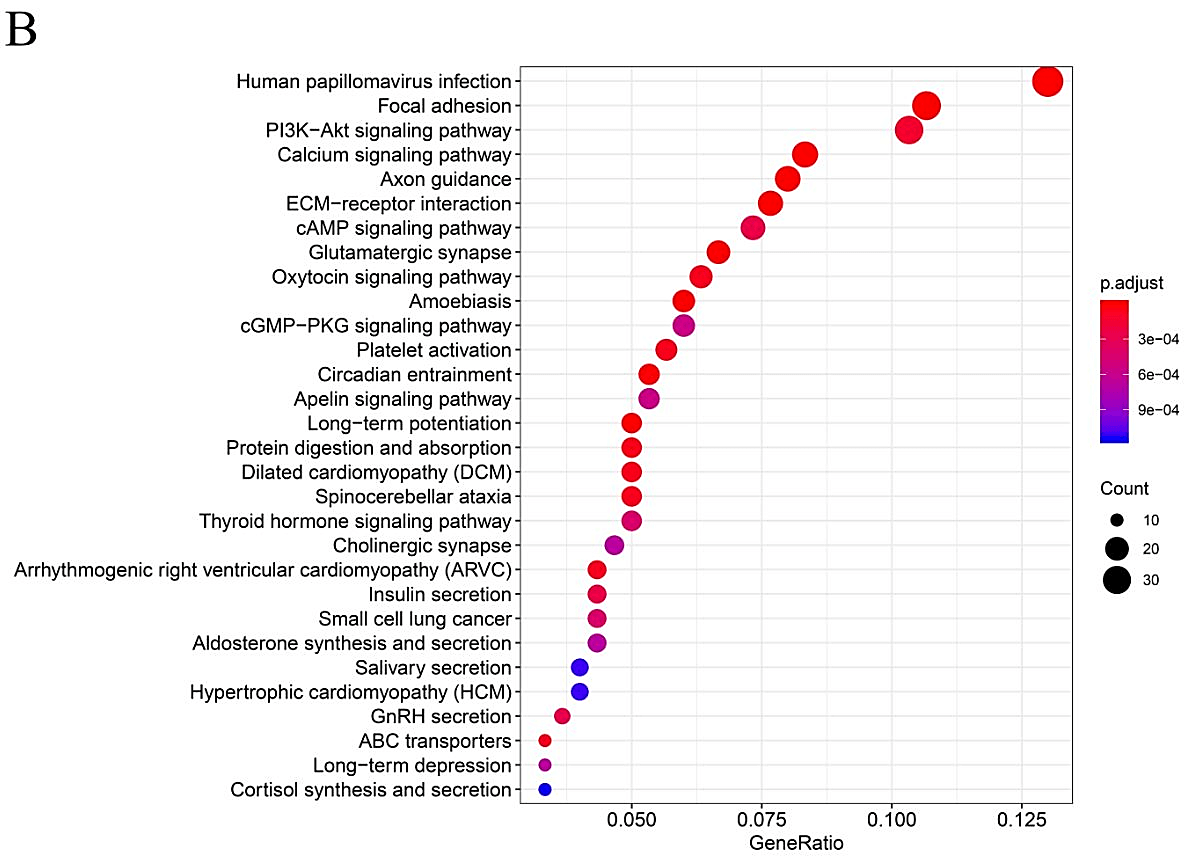
Supplementary Figure 1: Gene Ontology and Pathway analysis of genes that mutated in greater than 15 samples. A) GO term analysis. B) KEGG pathway analysis. Different colors represent different significances, and different sizes represent the number of genes.
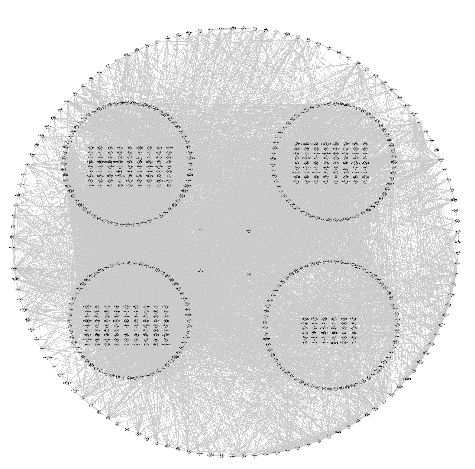
Supplementary Figure 2: Protein-protein interaction network of the genes that mutated in greater than 15 samples.
Supplementary Table 1: The top 10 genes most relevant to FAT1.
|
Gene 1 |
Gene 2 |
Cor |
P-value |
|
FAT1 |
FAT1 |
1 |
0 |
|
FAT1 |
LUZP1 |
0.554 |
3.42E-45 |
|
FAT1 |
PLEC |
0.545 |
1.18E-43 |
|
FAT1 |
ITGB4 |
0.541 |
7.81E-43 |
|
FAT1 |
ANO6 |
0.537 |
3.86E-42 |
|
FAT1 |
CAMSAP2 |
0.521 |
2.22E-39 |
|
FAT1 |
COX7C |
-0.429 |
6.93E-26 |
|
FAT1 |
CCDC12 |
-0.428 |
1.11E-25 |
|
FAT1 |
ATP5PF |
-0.424 |
2.73E-25 |
|
FAT1 |
UQCRQ |
-0.422 |
5.56E-25 |
|
FAT1 |
DBI |
-0.417 |
2.33E-24 |
Supplementary Table 2: The top 10 genes most relevant to KMT2B.
|
Gene 1 |
Gene 2 |
Cor |
P-value |
|
KMT2B |
KMT2B |
1 |
0 |
|
KMT2B |
PROSER3 |
0.941 |
1.13E-258 |
|
KMT2B |
ARHGAP33 |
0.68 |
1.80E-75 |
|
KMT2B |
PSENEN |
0.594 |
2.03E-53 |
|
KMT2B |
LIN37 |
0.592 |
6.29E-53 |
|
KMT2B |
AC002398.1 |
0.567 |
8.10E-48 |
|
KMT2B |
U2AF1L4 |
0.56 |
1.97E-46 |
|
KMT2B |
TOGARAM1 |
0.536 |
6.70E-42 |
|
KMT2B |
PHF21A |
0.492 |
1.32E-34 |
|
KMT2B |
KLHL28 |
0.478 |
1.79E-32 |
|
KMT2B |
TMEM147-AS1 |
0.46 |
6.88E-30 |
Supplementary Table 3: The top 10 genes most relevant to XIRP2.
|
Gene 1 |
Gene 2 |
Cor |
P-value |
|
XIRP2 |
XIRP2 |
1 |
0 |
|
XIRP2 |
C10orf71 |
0.954 |
5.09E-287 |
|
XIRP2 |
ACTN2 |
0.95 |
3.17E-278 |
|
XIRP2 |
NRAP |
0.948 |
1.98E-272 |
|
XIRP2 |
NEB |
0.946 |
2.68E-269 |
|
XIRP2 |
ZNF106 |
0.938 |
8.20E-252 |
|
XIRP2 |
CMYA5 |
0.933 |
7.35E-243 |
|
XIRP2 |
ALPK3 |
0.932 |
4.25E-241 |
|
XIRP2 |
TXLNB |
0.925 |
4.29E-230 |
|
XIRP2 |
TRDN |
0.922 |
1.05E-226 |
|
XIRP2 |
PDE4DIP |
0.918 |
2.15E-220 |
Supplementary Table 4: The top 10 genes most relevant to ZNF347.
|
Gene 1 |
Gene 2 |
Cor |
P-value |
|
ZNF347 |
ZNF347 |
1 |
0 |
|
ZNF347 |
AC022150.2 |
0.64 |
3.23E-64 |
|
ZNF347 |
AC092070.2 |
0.637 |
1.80E-63 |
|
ZNF347 |
ZNF570 |
0.635 |
5.38E-63 |
|
ZNF347 |
ZNF813 |
0.634 |
9.45E-63 |
|
ZNF347 |
ZNF701 |
0.619 |
4.99E-59 |
|
ZNF347 |
ZNF542P |
0.603 |
2.43E-55 |
|
ZNF347 |
ZNF569 |
0.578 |
4.60E-50 |
|
ZNF347 |
ZNF329 |
0.573 |
6.78E-49 |
|
ZNF347 |
ZFP28 |
0.563 |
5.30E-47 |
|
ZNF347 |
ZNF320 |
0.551 |
9.69E-45 |
Article Info
Article Type
Research ArticlePublication history
Received: Mon 04, May 2020Accepted: Wed 20, May 2020
Published: Thu 28, May 2020
Copyright
© 2023 Ren Sheng Wang. This is an open-access article distributed under the terms of the Creative Commons Attribution License, which permits unrestricted use, distribution, and reproduction in any medium, provided the original author and source are credited. Hosting by Science Repository.DOI: 10.31487/j.COCB.2020.01.04
Figures & Tables
Supplementary Table 1: The top 10 genes most relevant to FAT1.
|
Gene 1 |
Gene 2 |
Cor |
P-value |
|
FAT1 |
FAT1 |
1 |
0 |
|
FAT1 |
LUZP1 |
0.554 |
3.42E-45 |
|
FAT1 |
PLEC |
0.545 |
1.18E-43 |
|
FAT1 |
ITGB4 |
0.541 |
7.81E-43 |
|
FAT1 |
ANO6 |
0.537 |
3.86E-42 |
|
FAT1 |
CAMSAP2 |
0.521 |
2.22E-39 |
|
FAT1 |
COX7C |
-0.429 |
6.93E-26 |
|
FAT1 |
CCDC12 |
-0.428 |
1.11E-25 |
|
FAT1 |
ATP5PF |
-0.424 |
2.73E-25 |
|
FAT1 |
UQCRQ |
-0.422 |
5.56E-25 |
|
FAT1 |
DBI |
-0.417 |
2.33E-24 |
Supplementary Table 2: The top 10 genes most relevant to KMT2B.
|
Gene 1 |
Gene 2 |
Cor |
P-value |
|
KMT2B |
KMT2B |
1 |
0 |
|
KMT2B |
PROSER3 |
0.941 |
1.13E-258 |
|
KMT2B |
ARHGAP33 |
0.68 |
1.80E-75 |
|
KMT2B |
PSENEN |
0.594 |
2.03E-53 |
|
KMT2B |
LIN37 |
0.592 |
6.29E-53 |
|
KMT2B |
AC002398.1 |
0.567 |
8.10E-48 |
|
KMT2B |
U2AF1L4 |
0.56 |
1.97E-46 |
|
KMT2B |
TOGARAM1 |
0.536 |
6.70E-42 |
|
KMT2B |
PHF21A |
0.492 |
1.32E-34 |
|
KMT2B |
KLHL28 |
0.478 |
1.79E-32 |
|
KMT2B |
TMEM147-AS1 |
0.46 |
6.88E-30 |
Supplementary Table 3: The top 10 genes most relevant to XIRP2.
|
Gene 1 |
Gene 2 |
Cor |
P-value |
|
XIRP2 |
XIRP2 |
1 |
0 |
|
XIRP2 |
C10orf71 |
0.954 |
5.09E-287 |
|
XIRP2 |
ACTN2 |
0.95 |
3.17E-278 |
|
XIRP2 |
NRAP |
0.948 |
1.98E-272 |
|
XIRP2 |
NEB |
0.946 |
2.68E-269 |
|
XIRP2 |
ZNF106 |
0.938 |
8.20E-252 |
|
XIRP2 |
CMYA5 |
0.933 |
7.35E-243 |
|
XIRP2 |
ALPK3 |
0.932 |
4.25E-241 |
|
XIRP2 |
TXLNB |
0.925 |
4.29E-230 |
|
XIRP2 |
TRDN |
0.922 |
1.05E-226 |
|
XIRP2 |
PDE4DIP |
0.918 |
2.15E-220 |
Supplementary Table 4: The top 10 genes most relevant to ZNF347.
|
Gene 1 |
Gene 2 |
Cor |
P-value |
|
ZNF347 |
ZNF347 |
1 |
0 |
|
ZNF347 |
AC022150.2 |
0.64 |
3.23E-64 |
|
ZNF347 |
AC092070.2 |
0.637 |
1.80E-63 |
|
ZNF347 |
ZNF570 |
0.635 |
5.38E-63 |
|
ZNF347 |
ZNF813 |
0.634 |
9.45E-63 |
|
ZNF347 |
ZNF701 |
0.619 |
4.99E-59 |
|
ZNF347 |
ZNF542P |
0.603 |
2.43E-55 |
|
ZNF347 |
ZNF569 |
0.578 |
4.60E-50 |
|
ZNF347 |
ZNF329 |
0.573 |
6.78E-49 |
|
ZNF347 |
ZFP28 |
0.563 |
5.30E-47 |
|
ZNF347 |
ZNF320 |
0.551 |
9.69E-45 |
References
- Cramer JD, Burtness B, Le QT, Ferris RL (2019) The changing therapeutic landscape of head and neck cancer. Nat Rev Clin Oncol 16: 669-683. [Crossref]
- Kann BH, Hicks DF, Payabvash S, Mahajan A, Du J et al. (2019) Multi-Institutional Validation of Deep Learning for Pretreatment Identification of Extranodal Extension in Head and Neck Squamous Cell Carcinoma. J Clin Oncol 38: 1304-1311. [Crossref]
- Burtness B, Harrington KJ, Greil R, Soulières D, Tahara M et al. (2019) Pembrolizumab alone or with chemotherapy versus cetuximab with chemotherapy for recurrent or metastatic squamous cell carcinoma of the head and neck (KEYNOTE-048): a randomised, open-label, phase 3 study. Lancet 394: 1915-1928. [Crossref]
- Jin Z, Zhao X, Cui L, Xu X, Zhao Y et al. (2019) UBE2C promotes the progression of head and neck squamous cell carcinoma. Biochem Biophys Res Commun 523: 389-397. [Crossref]
- Burtness B, Haddad R, Dinis J, Trigo J, Yokota T et al. (2019) Afatinib vs Placebo as Adjuvant Therapy After Chemoradiotherapy in Squamous Cell Carcinoma of the Head and Neck: A Randomized Clinical Trial. JAMA Oncol 5: 1170‐1180. [Crossref]
- Budach V, Tinhofer I (2019) Novel prognostic clinical factors and biomarkers for outcome prediction in head and neck cancer: a systematic review. Lancet Oncol 20: e313-e326. [Crossref]
- Gatta G, Botta L, Sánchez MJ, Anderson LA, Pierannunzio D et al. (2015) Prognoses and improvement for head and neck cancers diagnosed in Europe in early 2000s: The EUROCARE-5 population-based study. Eur J Cancer 51: 2130-2143. [Crossref]
- Vervoort Y, Linares AG, Roncoroni M, Liu C, Steensels J et al. (2017) High-throughput system-wide engineering and screening for microbial biotechnology. Curr Opin Biotechnol 46: 120-125. [Crossref]
- Duan R, Pak C, Jin P (2007) Single nucleotide polymorphism associated with mature miR-125a alters the processing of pri-miRNA. Hum Mol Genet 16: 1124-1131. [Crossref]
- De Marchi P, Melendez ME, Laus AC, Kuhlmann PA, de Carvalho AC et al. (2019) The role of single-nucleotide polymorphism (SNPs) in toxicity of induction chemotherapy based on cisplatin and paclitaxel in patients with advanced head and neck cancer. Oral Oncol 98: 48-52. [Crossref]
- Zhu Y, Spitz MR, Amos CI, Lin J, Schabath MB et al. (2004) An evolutionary perspective on single-nucleotide polymorphism screening in molecular cancer epidemiology. Cancer Res 64: 2251-2257. [Crossref]
- Bergmann C, Bachmann HS, Bankfalvi A, Lotfi R, Pütter C et al. (2011) Toll-like receptor 4 single-nucleotide polymorphisms Asp299Gly and Thr399Ile in head and neck squamous cell carcinomas. J Transl Med 9: 139. [Crossref]
- Nagalakshmi K, Jamil K, Pingali U, Reddy MV, Attili SS (2014) Epidermal growth factor receptor (EGFR) mutations as biomarker for head and neck squamous cell carcinomas (HNSCC). Biomarkers 19: 198-206. [Crossref]
- Lehnerdt GF, Franz P, Bankfalvi A, Grehl S, Jahnke K et al. (2008) Association study of the G-protein beta3 subunit C825T polymorphism with disease progression an overall survival in patients with head and neck squamous cell carcinoma. Cancer Epidemiol. Biomarkers Prev 17: 3203-3207. [Crossref]
- Tomczak K, Czerwińska P, Wiznerowicz M (2015) The Cancer Genome Atlas (TCGA): an immeasurable source of knowledge. Contemp Oncol (Pozn) 19: A68-A77. [Crossref]
- Szklarczyk D, Gable AL, Lyon D, Junge A, Wyder S et al. (2019) STRING v11: protein-protein association networks with increased coverage, supporting functional discovery in genome-wide experimental datasets. Nucleic Acids Res 47: D607-D613. [Crossref]
- Tang Z, Li C, Kang B, Gao G, Li C et al. (2017) GEPIA: a web server for cancer and normal gene expression profiling and interactive analyses. Nucleic Acids Res 45: W98-W102. [Crossref]
- Liberzon A, Subramanian A, Pinchback R, Thorvaldsdóttir H, Tamayo P et al. (2011) Molecular signatures database (MSigDB) 3.0. Bioinformatics 27: 1739-1740. [Crossref]
- Xiang Y, Li F, Wang L, Zheng A, Zuo J et al. (2017) Decreased calpain 6 expression is associated with tumorigenesis and poor prognosis in HNSCC. Oncol Lett 13: 2237-2243. [Crossref]
- Gao C, Zhuang J, Zhou C, Li H, Liu C et al. (2019) SNP mutation-related genes in breast cancer for monitoring and prognosis of patients: A study based on the TCGA database. Cancer Med 8: 2303-2312. [Crossref]
- Hulpiau P, van Roy F (2011) New insights into the evolution of metazoan cadherins. Mol Biol Evol 28: 647-57. [Crossref]
- Morris LG, Kaufman AM, Gong Y, Ramaswami D, Walsh LA et al. (2013) Recurrent somatic mutation of FAT1 in multiple human cancers leads to aberrant Wnt activation. Nat Genet 45: 253-261. [Crossref]
- Kim KT, Kim BS, Kim JH (2016) Association between FAT1 mutation and overall survival in patients with human papillomavirus-negative head and neck squamous cell carcinoma. Head Neck 38: E2021-E2029. [Crossref]
- Solaini G, Sgarbi G, Baracca A (2011) Oxidative phosphorylation in cancer cells. Biochim Biophys Acta 1807: 534-542. [Crossref]
- Liang X, Li Q, Xu B, Hu S, Wang Q et al. (2019) Mutation landscape and tumor mutation burden analysis of Chinese patients with pulmonary sarcomatoid carcinomas. Int J Clin Oncol 24: 1061-1068. [Crossref]
- Cuevas D, Valls J, Gatius S, Roman Canal B, Estaran E et al. (2019) Targeted sequencing with a customized panel to assess histological typing in endometrial carcinoma. Virchows Arch 474: 585-598. [Crossref]
- Lu H, Yang S, Zhu H, Tong X, Xie F et al. (2018) Targeted next generation sequencing identified clinically actionable mutations in patients with esophageal sarcomatoid carcinoma. BMC Cancer 18: 251. [Crossref]
- Xie N, Yao Y, Wan L, Zhu T, Liu L et al. (2017) Next-generation sequencing reveals lymph node metastasis associated genetic markers in colorectal cancer. Exp Ther Med 14: 338-343. [Crossref]
- Rajkumar SV, Richardson PG, Hideshima T, Anderson KC (2005) Proteasome inhibition as a novel therapeutic target in human cancer. J Clin Oncol 23: 630-639. [Crossref]
- Zhu G, Pei L, Li Y, Gou X (2020) EP300 mutation is associated with tumor mutation burden and promotes antitumor immunity in bladder cancer patients. Aging (Albany NY) 12: 2132-2141. [Crossref]
- Bao Y, Wang L, Shi L, Yun F, Liu X et al. (2019) Transcriptome profiling revealed multiple genes and ECM-receptor interaction pathways that may be associated with breast cancer. Cell Mol Biol Lett 24: 38. [Crossref]
- Andersen MK, Rise K, Giskeødegård GF, Richardsen E, Bertilsson H et al. (2018) Integrative metabolic and transcriptomic profiling of prostate cancer tissue containing reactive stroma. Sci Rep 8: 14269. [Crossref]
- Yan P, He Y, Xie K, Kong S, Zhao W (2018) In silico analyses for potential key genes associated with gastric cancer. PeerJ 6: e6092. [Crossref]
- Shenoy N, Kessel R, Bhagat TD, Bhattacharyya S, Yu Y et al. (2012) Alterations in the ribosomal machinery in cancer and hematologic disorders. J Hematol Oncol 5: 32. [Crossref]
- Li D, Jin L, Alesi GN, Kim YM, Fan J et al. (2013) The prometastatic ribosomal S6 kinase 2-cAMP response element-binding protein (RSK2-CREB) signaling pathway up-regulates the actin-binding protein fascin-1 to promote tumor metastasis. J Biol Chem 288: 32528-32538. [Crossref]
- Sim EU, Chan SL, Ng KL, Lee CW, Narayanan K (2016) Human Ribosomal Proteins RPeL27, RPeL43, and RPeL41 Are Upregulated in Nasopharyngeal Carcinoma Cell Lines. Dis Markers 2016: 5179594. [Crossref]
- Zou ZQ, Zhang XH, Wang F, Shen QJ, Xu J et al. (2009) A novel dual PI3Kalpha/mTOR inhibitor PI-103 with high antitumor activity in non-small cell lung cancer cells. Int J Mol Med 24: 97-101. [Crossref]
- Reimer P (2015) New developments in the treatment of peripheral T-cell lymphoma - role of Belinostat. Cancer Manag Res 7: 145-151. [Crossref]
- Lu P, Gu Y, Li L, Wang F, Yang X et al. (2019) Belinostat suppresses cell proliferation by inactivating Wnt/β-catenin pathway and promotes apoptosis through regulating PKC pathway in breast cancer. Artif Cells Nanomed Biotechnol 47: 3955-3960. [Crossref]
- Reeves PM, Abbaslou MA, Kools FRW, Vutipongsatorn K, Tong X et al. (2017) Ruxolitinib sensitizes ovarian cancer to reduced dose Taxol, limits tumor growth and improves survival in immune competent mice. Oncotarget 8: 94040-94053. [Crossref]