Journals
Should We Have Blind Faith in Liver Volumetry?
A B S T R A C T
Introduction:
Liver volumetry is a routine procedure performed before major hepatectomy or living donor liver transplantation (LDLT) to anticipate the remnant liver volume and prevent liver failure. However, many parameters may impact its accuracy and no large-scale studies have evaluated inter-rater variabilities. We aimed to determine the reliability of volumetric assessments for whole organs in deceased-donor liver transplantations (DDLT) and partial organs in LDLT settings.
Patients & Methods:
Eight operators (four surgeons + four radiologists) analysed 30 preoperative CT scans (15 whole cirrhotic livers in the DDLT group + 15 partial healthy grafts in the LDLT group), using five software systems. The computed volumes were compared with liver weight; liver density being considered as1.
Results:
Inter-rater and inter-software concordances were excellent with coefficients of correlation >0.9. However, calculations overestimated the real volumes in 25 cases by a mean of 249 ± 206 [14-771] cc in the
DDLT group and 138 ± 92cc [39-375] in the LDLT group. The mean calculations were significantly higher than liver weights in the LDLT group only (p=0.04). The radiologists overestimated the surgeons’ assessment in 24 cases, the differences exceeding 6% in some cases. The type of software used significantly impacted results in the DDLTgroup.
Conclusions:
Despite its unanimously recognised utility, we highlight significant discrepancies between estimated and real liver volumes. The global overestimation may lead to leave of too small remnant liver, with potentially dramatic consequences. In case of border-line estimations, we recommend a repetition of the evaluation by another operator (surgeon + radiologist working in concert).
Keywords
Volumetric CT, Hepatectomy, Liver transplantation, Living donor, Computed tomography angiography
Introduction
Liver volumetry has become a worldwide standard of care in modern hepatobiliary surgery, whether it is used to plan a tumour resection or to schedule living donor liver transplantation (LDLT), as the surgical indication depends mainly on the ratio between the future liver remnant (FLR) and body weight [1-5]. This matching is designed to prevent postoperative liver failure [6, 7]. Many open sources or commercial software programs are available, and their accuracy is a prerequisite that is unanimously accepted because numerous studies have reported a strong correlation between estimated and real volumes [8, 9].
However, no quality controls or consensual methodologies are required to perform liver segmentation and many parameters are known to significantly impact the volumetric calculation: type of imaging modality used for volume assessment, presence of cirrhosis, slice thickness of the CT scan, volume calculation from a 2- or 3-dimensional reconstruction and use of manual vs semi-automatic vs automatic software are the most influential determinants [9-18].
Surprisingly, when evaluating pulmonary metastases, some studies have highlighted the discrepancy between software and significant inter-observer variability, so that a message of caution regarding the interpretation of volume/size is recommended and widely accepted in the thoracic surgical community [19-21].
In terms of liver volumetric calculations, some authors have also reported clinically significant inter- and intra-observer variability, but the reliability of this tool remains widely accepted because of the statistically strong correlation between estimates and intraoperative measurements in most series [22, 23]. Given this apparent contradiction (statistical vs clinical significance), our goal was to evaluate the reliability of volumetric assessment in the settings of deceased-donor liver transplantation (DDLT) (cirrhotic livers) and LDLT (healthy livers), aiming to determine the true difference between volumetric estimations and intraoperative measurements.
Patients and Methods
Study Populations
This study reviewed 30 patients who underwent surgery in our tertiary centre (Centre Hépato-Biliaire, Paul Brousse Hospital, Villejuif, AP/HP):
- Fifteen cirrhotic recipients waiting for deceased-donor liver transplantation (LT) were assessed (DDLT group). Their LTs were performed consecutively between September 2016 and December 2016. This cirrhotic group was chosen to evaluate the accuracy of volumetric software since we hypothesised that the “human bias” might be very limited in the case of global volumetric calculations without any section plan being necessary. We also wanted to determine the accuracy of volumetric assessments on pathological parenchyma.
- Fifteen living donors (healthy livers) were evaluated (LDLT group). The LTs were performed between June 2013 and May 2017. We included five right grafts and ten left grafts. This group was selected to assess both software programs and human bias (if any) because the observers were required to define a virtual section plane
The inclusion criteria were: intraoperative graft or liver weight available from medical records, age >18 years, pre-LT CT scan with portal phase available in our picture archiving and communication system (PACS). The latest CT scan performed prior to LT was studied. All patients gave their informed consent to research on their personal and anonymised data.
Surgical Procedures
Deceased donor LT and LDLT were performed using previously described techniques [24,25]. The preoperative main criteria for LDLT acceptance were:
- Right liver (segments V, VI, VII, VIII): donor’s remnant liver volume >30% TLV and/or remnant liver/donor body weight ratio estimated at >0.5.
- Left liver (segments II, III, IV): recipient’s graft volume/body weight ratio estimated at >0.8 (or 0.7 in the absence of portal hypertension).
The livers were weighed by surgeons after explantation, without any vascular inflow. We assumed that liver parenchyma density was 1g/mL (no Wilson disease or hemochromatosis diseases included). The same balance was used for all patients.
Liver Planning Software and Volumetric Assessment (Figure 1)
Despite the retrospective design of this study (inclusion of patients who had already undergone surgery), we re-calculated all the liver volumes and did not consider the volumetric determinations performed at the time of surgical management (before surgery). Five software programs (So) were used during this study for volumetric evaluations of the liver:
So 1: Myrian XP-Liver from Intrasense (France), version 2.3.3
So 2: Visible Patient Lab (France), version 1.0.10
So 3: Hepatic VCAR from General Electric (USA), version 12.3-4.151
So 4: IntelliSpace Portal from Philips (The Netherlands), version 9.0
So 5: Synapse 3D from Fujifilm (Japan), version 4.4 Eu.

Figure 1: Examples of a 3D reconstruction before LDLT (A-B) or DDLT (C-D, note the right hepatic atrophy and signs of portal hypertension) obtained using the Visible Patient software.
IVC: inferior vena cava; MHV: middle hepatic vein; PV: portal vein; RHV: right hepatic vein.
Eight experienced users (four HPB surgeons [Su 1 to Su 4] and four HPB radiologists [Ra 1 to Ra 4]) evaluated the volumetry of the 30 patients included. Each operator only used one software program for the calculations, that usually employed in daily practice (experience with the software >1 year). Two software programs were used by ≥2 operators: So 1 was used by Su 1 and Su 2, and the So 3 was used by Su 3, Ra 2 and Ra 4.
Until 2015, all patients were examined using a Philips Brilliance 40 CT Scanner. Thereafter, a Revolution HD GSI (GE Medical Systems Healthcare, Milwaukee, USA), dual energy CT scan was employed, with a 64-section multi-detector. The volumes were measured on the scans obtained during the hepatic venous phase at 60-70 seconds after administration of 2 ml per kilogram of body weight of non-ionic contrast material. The slice thickness of all the CT scan was of 1.25 mm. Each operator received the same 30 DICOMs files.
Each observer was blinded from the results of initial volumetric evaluations (not assessed during the study), the calculations of other operators and intraoperative measures. They received the same standardised instructions for volumetric measurements, as follows:
- DDLT group: volume of the whole liver, excluding the gallbladder, the main vessels (inferior vena cava, right and left portal veins, hepatic veins) and major fissures. Tumours were included in the TLV.
- LDLT, right liver group: segments V to VIII. Vertical section to the right of the middle hepatic vein, this vein being excluded from the volume calculation. The gallbladder and main vessels were also excluded from the analysis.
- LDLT, left liver group: segments II, III and IV. Vertical section to the right of the middle hepatic vein, this vein being included in the volume calculation. Segment I was excluded from the volumetric calculation, as were the gallbladder and main vessels.
All these software programs ensured a semi-automatic detection of vessels and the surface contour of the liver. However, in the event of poor contrast or aberrant contour delimitation, hand-tracing was applied. The parenchymal transection plane was obtained manually.
Statistical Analysis
To obtain an inter-observer concordance of 0.9 with a standard error of 20%, an α risk of 5%, and a β risk of 20%, the required sample size was of 30 patients.
Quantitative variables were expressed either as a mean ± standard deviation (SD) or as a median (range) for the calculation of variations in volume. Patients were compared using an unpaired Student’s t test for continuous variables with a parametric distribution, and a Mann-Whitney U test for those with a nonparametric distribution. Qualitative variables were expressed as counts (percentage) and compared using a Chi-square test with a Yates correction if appropriate, or Fisher’s exact test.
To determine the concordance between raters in terms of graft volume and total liver volume, the concordances were presented on an inter-rater basis (IRC, inter-observer concordances) and 95% confidence interval (95% CI) and compared using the Wilcoxon Mann Whitney test. The threshold for statistical significance was set at p≤0.05. Statistical analysis was performed using PASW software (version 22.0, SPSS Inc., Chicago, IL).
This study was performed according to the STROBE guidelines.
Results
Features of the study population
In the DDLT group, there were ten men and five women with a mean age of 56 ± 13 years. All these recipients were cirrhotic (alcohol n=9, cryptogenic n=2, primary biliary cirrhosis n=1, non-alcoholic steato-hepatitis n=1, HCV n=1, HBV n=1) and the mean interval between the CT scan and LT was 76 ± 54 days.
In the LDLT group, the donors were ten men and five women, with a mean age was of 43 ± 9 years. All patients had healthy livers. The mean interval between the CT scan and LT was 105 ± 55 days. Characteristics of recipients were not assessed in this group.
Inter-Observer Concordance
As illustrated in (Table 1) (shaded lines), the inter-rater concordance was excellent, whatever the type of observer (surgeons or radiologists). In the DDLT group, the IRC between surgeons or between radiologists or surgeons versus radiologists were respectively 0.994, 0.997 and 0.996. In the LDLT group, the concordances were respectively 0.926, 0.971 and 0.943. In both groups, there was also a strong concordance between the software findings (0.996 and 0.943).
Table 1: Inter-rater concordance
|
Rater |
Inter-rater concordance |
95% confidence interval |
Inter-rater concordance |
95% confidence interval |
|
|
DDLT Group |
LDLT Group |
||
|
Surgeon vs. Surgeon |
0.994 |
0.987 – 0.998 |
0.926 |
0.740 – 0.991 |
|
Surgeon vs. Intraoperative data |
0.967 |
0.930 – 0.988 |
0.931 |
0.777 – 0.992 |
|
Surgeon #1 vs. Intraoperative data |
0.929 |
0.800 – 0.979 |
0.951 |
0.863 – 0.984 |
|
Surgeon #2 vs. Intraoperative data |
0.925 |
0.789 – 0.980 |
0.892 |
0.712 – 0.961 |
|
Surgeon #3 vs. Intraoperative data |
0.901 |
0.726 – 0.973 |
0.908 |
0.750 – 0.964 |
|
Surgeon #4 vs. Intraoperative data |
0.900 |
0.718 – 0.967 |
0.921 |
0.605 – 0.996 |
|
|
|
|
|
|
|
Radiologist vs. Radiologist |
0.997 |
0.994 – 0.999 |
0.971 |
0.939 – 0.989 |
|
Radiologist vs. Intraoperative data |
0.967 |
0.932 – 0.987 |
0.953 |
0.905 – 0.982 |
|
Radiologist #1 vs. Intraoperative data |
0.915 |
0.765 – 0.970 |
0.935 |
0.819 – 0.978 |
|
Radiologist #2 vs. Intraoperative data |
0.911 |
0.756 – 0.969 |
0.893 |
0.712 – 0.963 |
|
Radiologist #3 vs. Intraoperative data |
0.912 |
0.759 – 0.970 |
0.930 |
0.804 – 0.976 |
|
Radiologist #4 vs. Intraoperative data |
0.900 |
0.729 – 0.965 |
0.913 |
0.760 – 0.970 |
|
|
|
|
|
|
|
Software vs. Software |
0.996 |
0.992 – 0.999 |
0.943 |
0.831 – 0.993 |
|
Software #1 vs. Intraoperative data |
0.952 |
0.891 – 0.982 |
0.945 |
0.875 – 0.979 |
|
Software #2 vs. Intraoperative data |
0.915 |
0.765 – 0.970 |
0.935 |
0.819 – 0.978 |
|
Software #3 vs. Intraoperative data |
0.956 |
0.908 – 0.983 |
0.930 |
0.856 – 0.973 |
|
Software #4 vs. Intraoperative data |
0.912 |
0.759 – 0.970 |
0.930 |
0.804 – 0.976 |
|
Software #5 vs. Intraoperative data |
0.900 |
0.718 – 0.967 |
0.921 |
0.605 – 0.996 |
|
|
|
|
|
|
|
Surgeon vs. Radiologist |
0.996 |
0.992 – 0.999 |
0.943 |
0.831 – 0.993 |
Although statistically not significant, (Figure 2) shows the mean differences between the evaluations made by surgeons and radiologists using a more visual and realistic presentation (radar diagram). In some cases (patients 3, 4, 7, 12 and 13), this difference exceeded 6% and the radiologists overestimated liver volumes (by comparison with the surgeons) in 24/30 cases (14 and 10 cases in the DDLT and LDLT groups, respectively).
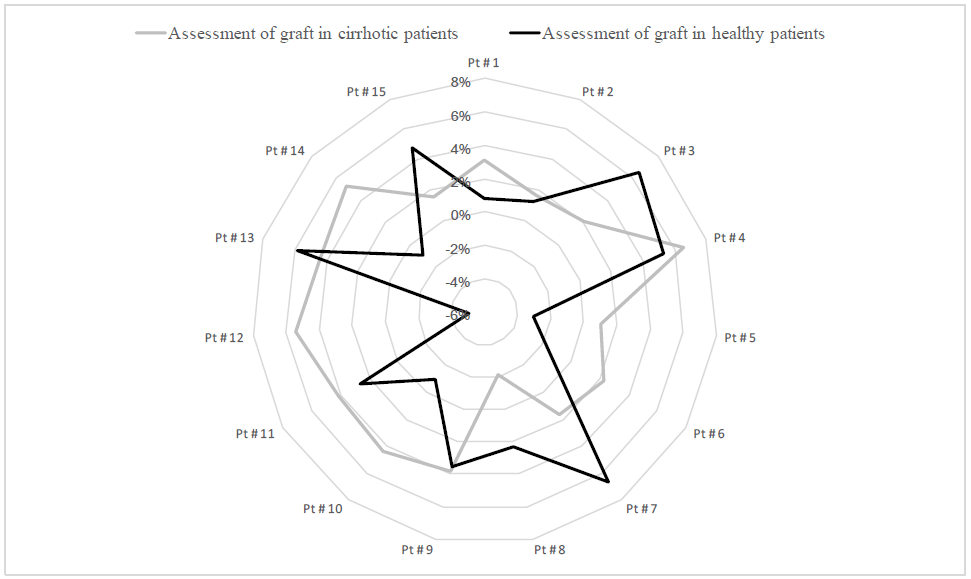
Figure 2: Radar Diagram. Variations in assessments by radiologists when compared with those of surgeons regarding liver volumes in cirrhotic and healthy patients.
For each patient, the difference between the mean assessments obtained by radiologists and surgeons is represented as a percentage. A positive value (>0%) represents an over-estimation by the radiologists when compared to the surgeons.
When the same software was used in the DDLT group, the mean inter-observer difference was 39cc±46 whereas it reached 78±68cc in case of different software (p < 0.05). In the LDLT group, the mean inter-observer difference was 132±83cc if the same software was used and 140±40cc in case of different software (p=0.38).
Accuracy of Estimates (Validity)
By comparing the estimates obtained by each observer with the corresponding intraoperative data (Table 1, white lines), we also demonstrated a relatively good concordance, with most r values >0.9. In the DDLT group, all users achieved a concordance ≥0.9, whereas in the LDLT group, one surgeon (Su 2) and one radiologist (Ra 2) obtained a concordance <0.9.
However, there was a non-negligible discrepancy between the performance of raters in anticipating organ volumes; in particular, Su 1 and Ra 1 achieved the best concordance in both groups, whereas the concordance of Ra 2 with real volumes was poorer.
Measured Versus Estimated Volumes in the Whole Cohort (n=30)
In the DDLT group, the mean estimate of liver volume was 1416 ± 761cc and the mean intraoperative volumes were 1279 ± 591cc (p=0.45). In the LDLT group, the mean estimate of graft volume was 695 ± 281cc, significantly higher than the mean intraoperative volume of 555 ± 207cc (p=0.04). There was no significant difference between the surgical and radiological evaluations, whichever the group.
As shown in (Table 2), the mean overestimation was greater among radiologists than surgeons. The mean overestimation of volumes by all observers (vs real volumes) was 249 ± 206 [14-771] cc in the DDLT group and 138 ± 92cc [39-375] in the LDLT group, and the mean percentage of error [(calculated-weighed volumes) *100/weighed volume] was 19.4% and 23.7%, respectively (p=0.14).
Table 2: Mean differences between estimated and measured volumes according to the operators.
|
|
Assessment by surgeons |
Assessment by radiologists |
|
Liver volume in DDLT group (cc) mean ± SD* |
235.1 ± 201 |
261.5 ± 211 |
|
Graft volume in LDLT group (cc) mean ± SD |
131 ± 91 |
143 ± 93 |
* the difference corresponds to the absolute difference as patients # 1, 6, 8 and 10 had negative average differences with the weighted volume.
SD: standard deviation
As illustrated in Table 3 (LDLT group only), the reliability of volume calculations was significantly poorer for right livers than left livers, with a weaker concordance between estimated and measured right livers (p < 0.05 for right liver only).
Table 3: Comparison between estimated and weighed livers in LDLT group for right or left graft
|
|
Right liver |
Left liver |
||
|
|
Δ |
Concordance |
Δ |
Concordance |
|
Surgeons |
212 ± 110 cc a
[103 - 381] |
0.913
[0.147 – 0.984] |
91 ± 46 cc c
[30 - 181] |
0.949
[0.810 – 0.987] |
|
Radiologists |
237 ± 96 cc b
[122 - 369] |
0.934
[0.420 – 0.994] |
96 ± 45 cc d
[39 - 188] |
0.965
[0.808 – 0.987] |
Δ : difference between estimated and real volumes Statistical analysis compared estimated versus real volumes. a: p=0.012, b: p=0.006, c: p=0.81, d: p=0.71
Measured Versus Estimated Volumes in Individuals
In the whole cohort, the difference between estimated and actual liver volumes exceeded 10% in 77% of all cases. In the DDLT group, for each patient, the mean maximum difference (max. estimation – min. estimation) of TLV observed between operators (equivalent to intra-individual variability in inter-rater interpretations) averaged 14±6% [range: 9-33], or 177±108cc [84-539]. Twelve estimates exceeded the real volume by more than 500cc, or even 800cc in four cases (maximum difference: +1015cc).
At an individual level in the LDLT group, the mean maximum difference in graft volume observed between operators was an average of 26±9% [13-47], or 151±76cc [58-374]. Twenty-two estimates exceeded the real volume by more than 200cc, or even 400cc in four cases (maximum difference: +472cc).
Figures 3 show the quantitative difference between weight estimations and intraoperative data, respectively. For whole livers, an overestimation was seen in 66.7% of cases (10/15) whereas 100% of calculations were overestimated with respect to partial grafts.

Figure 3: Differences between software estimates and real volumes in the DDLT and LDLT groups (positive values mean a preoperative overestimation of weight). Mean ± SD for each patient
Clinical Impact of Variability in Volumetric Assessments
By focusing on the LDLT group only, it was possible to highlight the consequences of a miss-assessment of liver volume. One recipient presented with a graft volume/body weight ratio < 0.7, whichever rater analysed the data. Another recipient presented with a graft volume/body weight ratio < 0.7 or ≥0.7 depending on the rater considered [range: 0.67-0.87]. In both cases, the graft volumes had been evaluated as being sufficient at the pre-LT assessment (ratios >0.8). These two patients developed primary non-function and required an emergency re-LT. Retrospectively, the low graft volume remains the main explanation for these outcomes. One can assume that a better volumetric assessment might have avoided such complications.
In the ten cases of left graft LDLT, we tried to determine whether working in a pair might improve the reliability of estimations (Table 4). We observed that a duo of two surgeons or two radiologists would not significantly improve the calculations, but a surgeon and radiologist working together were able to reduce overestimations in more than 50% of cases.
Table 4: Percentage of improvement in the left liver volume’s calculation per series of cases per rater considering the assessment by another rater (pair working)
|
Type of duo |
Reference: surgeon |
Reference: radiologist |
|
Surgeon + radiologist (n = 32 unique possibilities) |
0 – 14.3% |
51.7 – 100% |
|
Surgeon + surgeon (n = 12 unique possibilities) |
0 – 14.3% |
/ |
|
Radiologist + radiologist (n = 12 unique possibilities) |
/ |
0 – 14.3% |
Discussion
Statement of principal findings
During this study, we were able to confirm the excellent statistical concordance between preoperative liver volumetric estimates and real volumes. The calculations appeared to be reproducible whatever the observer (surgeon or radiologist) and the type of software used. These results are in line with numerous publications and thus justify the widespread use of preoperative volumetric assessment in daily practice [8, 23, 26].
We also demonstrated that the concordance test used in most of the publications to assess the reproducibility of volumetric values appeared to be insufficient and did not adequately reflect reality. Most of the volumetric values tended to overestimate the real volumes, this trend was bigger for radiologists than surgeons but not significant statistically. Although this problem of overestimation is not new and could be explained by a lack of liver perfusion during the intraoperative measurement, it seems to be generally unknown to surgeons, and the routine use of a conversion factor is not applied as a consequence [10, 27].
Moreover, the difference observed between estimated and weighed volumes could not solely be explained by this absence of organ perfusion (thus underestimating the true weight) because:
- the volumes were underestimated in five cases (so the difference would have been even greater using perfused, weighed livers),
- during the volumetric calculations, intravascular volumes were excluded from the analysis so that the assessment should not differ from that of a non-perfused organ.
- the overestimates often exceeded hundreds of cm3, which was much more than the vascular bed content: intrahepatic vessels accounted for only 70-120cm3 in our series (data not shown).
This constant overestimation, associated with the lower inter-rater concordance in this group, could have dramatic consequences when potential living donors are accepted, there being a high risk of small-for-size syndrome [5]. Estimates of right grafts appeared to be less reliable than those of left grafts, but an overestimation of right graft should not lead to serious consequences for the recipient. To the best of our knowledge, the poorer accuracy of partial volume assessments in the LDLT setting has not previously been reported. It should also be noted that underestimates were also found, with mismatches exceeding 400cc in some cases.
One of the major findings of our study remains the extremely broad range of incorrect estimates that were unpredictable and non-correctable using a unique conversion factor, as recommended by Karlo et al. [10]. In the DDLT group, this was all the more surprising because volumetry only concerned TLV calculations, without any segmentation. One might have supposed that TLV estimates would be a reliable procedure. We think that the differences observed could in part be explained by the poor quality of CT scans in cirrhotics because of haemodynamic disturbances (Figure 4). The irregularity of contours and the poor visualisation of inner vessels may have highlighted software performance. Applying a conversion factor would have reduced the differences with true weights in the event of overestimations but increased the gap if there was an underestimation. Moreover, inter-observer variability would have remained very high so that we have no clear explanations for such misevaluations.
We were also able to show that the use of specific distinct software programs had different impacts as a function of group: same inter-rater concordance in the LDLT group whichever software was used, whereas lower concordance in the DDLT group using different software. We can assume that a computational bias was clearly highlighted when only delimiting liver contours (DDLT group) involving little human intervention, whereas in the case of segmentation (right/left in LDLT group), human bias can predominate (determination of the liver cut surface) over any algorithm bias which no longer appeared to be statistically significant.
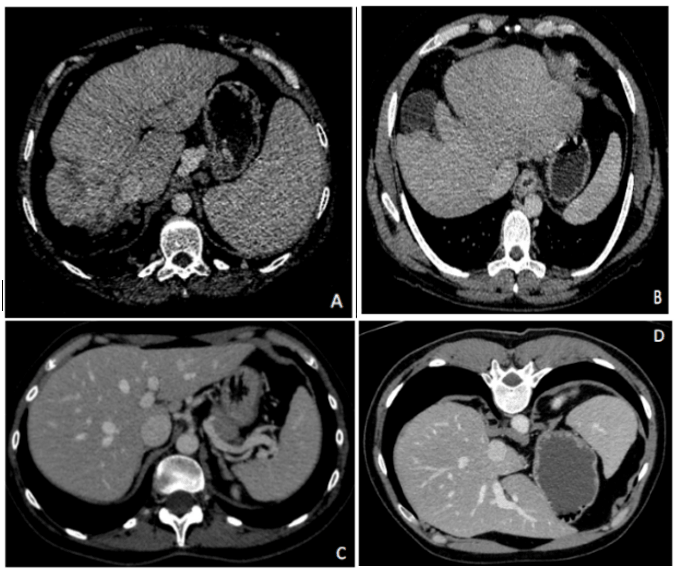
Figure 4: Examples of CT scans from the DDLT group (A, B) and LDLT group (C, D) at the portal phase. Compared with healthy livers, cirrhotic livers present a poor vascular enhancement and automatic contour delimitation is often incorrect, requiring manual intervention.
Interpretation with reference to other studies
In almost all publications, the authors considered the marked concordance between estimated and real liver volumes. We are broadly in agreement with such conclusions and obviously we perform routine volumetric assessments for surgical indications. However, we were struck by the massive margins of error reported by many publications in some patients, but not clearly described: inter-observer variability of >200cc and a difference between measured and estimated volumes of >500cc according to Dello et al., errors affecting semi-automatic segmentation of >200cc in the LDLT described by Hermoye et al., a mean error ratio of 13.4% between actual and estimated FLR volumes (maximum difference: 180cc) found by Itoh et al., an error reaching 700cc for Kitajima et al. using ultrasound assessments, and a graft overestimation of up to 300 cc (meaning a discrepancy of 32%) described by Sakamoto et al. in the LDLT setting [11, 12, 23, 28, 29]. The mean overestimation that we reported therefore seems in agreement with the literature and confirms the risk of an inappropriate decision [30]. There is therefore a risk that operators may be mistaken reassured by volumetric findings and may not perform portal embolization before major hepatectomy or accept procurement from a living donor and transplant a graft that is too small. In our experience, this probably explained two cases of primary non-function during the study period. Clearly, the errors observed in the DDLT group did not have any major consequences (native liver removed), but just highlighted the problem of predicting the volume of cirrhotic livers. These margins of error should be taken into consideration when preparing for elective surgery on cirrhotic patients.
Despite this risk, there is currently no alternative to imaging volumetry so that, for the time being, it remains the gold standard technique. Some authors have tried to estimate TLV based on a patient’s body surface area. The formula proposed by Vauthey et al. appears to be the most widely applied [31]. However, this formula has since been tested and some major errors reported: a difference of up to 1693cc when estimating the TLV and 40% for FLR, and a difference of up to 2000cc for TLV according to Simpson et al. [32, 33]. Currently, volume estimates based on body surface area cannot replace conventional computerised volumetry. In terms of borderline estimates (near to the predefined cut-off points), we therefore propose two options to prevent the risk of small-for-size and postoperative liver failure:
- the results should be verified by another operator, and particularly by an HPB surgeon if the initial evaluation was made by a radiologist,
- a conversion factor (< 1) should be applied. However, in the rare cases of underestimations, this may lead to the exclusion of potentially operable patients.
- the “liver compliance” should be also investigated, particularly in border-line volumetries (small recipient’s graft volume/body weight ratio) and perhaps that volumetric analyses should be performed in enhanced phases to be more realistic in LDLT setting [34].
Strengths and weaknesses of the study
To the best of our knowledge, this is the first study to have evaluated the performance of liver volumetry involving numerous software programs and clinicians (multicentic evaluation) because most previously published studies only compared two or three software used by a few operators [8, 9, 11, 15, 22, 23, 30]. Our work therefore reflects the practices actually applied in French HPB centres. It is also the first report to have compared the accuracy of liver volumetric assessments of normal and pathologic livers, because very few authors have reported studies involving underlying cirrhosis [14, 35].
All the software programs included in this work used semi-automatic delimitation algorithms so that the results given combined both the software and the user’s performances. This is of particular interest because cirrhotic livers often require manual adjustments to liver contours.
One potential criticism of our protocol concerns the weighing of livers without a true volume assessment (water displacement technique). First, it is widely accepted that liver density is close to 1 whatever the quality of the parenchyma. As demonstrated by Goumard et al., severe cirrhotic patients (Meld>15) present a liver density of 0.98(14). In the DDLT cohort, only three patients presented with a lower Meld score, thus justifying our approximation. Secondly, it is well known that a healthy parenchyma has a density of about 1.06 kg/l [36, 37]. For these reasons, we also approximated density in the LDLT group.
Although statistically justified, the small cohort size also limits the scope of the message. At last, the interval elapsing between the CT scans and surgery may appear long. However, only patients with a chronic pathology or healthy liver were studied, and we can honestly assume that their liver volumes remained constant during the few months before surgery.
Conclusion
The computerised calculation of liver volumetry is the only tool available to anticipate the volume of total and remnant liver, as well as graft volume. Concordance of the values found with actual volume is good, but major differences between estimated and real volumes are frequent. This margin of error must be taken into account when taking a decision as to surgery. Working in a pair could, in some cases, reduce these errors and avoid dramatic consequences.
Conflicts of Interest
The authors have no conflicts of interest to declare
Abbreviations:
|
CT scan |
computerised tomography |
|
DDLT |
deceased-donor liver transplantation |
|
FLR |
future liver remnant |
|
HPB |
hepatobiliary |
|
IRC |
inter-rater concordance |
|
LDLT |
living donor liver transplantation |
|
PACS |
picture archiving and communication system |
|
Ra |
radiologist |
|
SD |
standard deviation |
|
So |
software |
|
Su |
surgeon |
|
TLV |
total liver volume |
Contribution of co-authors
N. Golse: study design, data collection and writing manuscript
C. Cosse: statistical analysis, figures and tables creation
B. Gayet, B. Tréchot, A. Rode, M. Lewin, B. Le Roy, A. Gallon : data collection (CT scan analysis)
E. Vibert : supervision of the study, proofreading, scientific advices
Abbreviations:
|
CT scan |
computerised tomography |
|
DDLT |
deceased-donor liver transplantation |
|
FLR |
future liver remnant |
|
HPB |
hepatobiliary |
|
IRC |
inter-rater concordance |
|
LDLT |
living donor liver transplantation |
|
PACS |
picture archiving and communication system |
|
Ra |
radiologist |
|
SD |
standard deviation |
|
So |
software |
|
Su |
surgeon |
|
TLV |
total liver volume |
Article Info
Article Type
Research ArticlePublication history
Received: Tue 08, Jan 2019Accepted: Wed 30, Jan 2019
Published: Tue 12, Feb 2019
Copyright
© 2023 Nicolas Golse. This is an open-access article distributed under the terms of the Creative Commons Attribution License, which permits unrestricted use, distribution, and reproduction in any medium, provided the original author and source are credited. Hosting by Science Repository.DOI: 10.31487/j.SCR.2019.01.003
Author Info
Corresponding Author
Nicolas GolseDepartment of Hepato-Biliary Surgery, Paul-Brousse Hospital, Assistance Publique des Hôpitaux de Paris, Centre Hépato-Biliaire, Villejuif, 94800, France
Figures & Tables
IVC: inferior vena cava; MHV: middle hepatic vein; PV: portal vein; RHV: right hepatic vein.
For each patient, the difference between the mean assessments obtained by radiologists and surgeons is represented as a percentage. A positive value (>0%) represents an over-estimation by the radiologists when compared to the surgeons.
Table 1: Inter-rater concordance
|
Rater |
Inter-rater concordance |
95% confidence interval |
Inter-rater concordance |
95% confidence interval |
|
|
DDLT Group |
LDLT Group |
||
|
Surgeon vs. Surgeon |
0.994 |
0.987 – 0.998 |
0.926 |
0.740 – 0.991 |
|
Surgeon vs. Intraoperative data |
0.967 |
0.930 – 0.988 |
0.931 |
0.777 – 0.992 |
|
Surgeon #1 vs. Intraoperative data |
0.929 |
0.800 – 0.979 |
0.951 |
0.863 – 0.984 |
|
Surgeon #2 vs. Intraoperative data |
0.925 |
0.789 – 0.980 |
0.892 |
0.712 – 0.961 |
|
Surgeon #3 vs. Intraoperative data |
0.901 |
0.726 – 0.973 |
0.908 |
0.750 – 0.964 |
|
Surgeon #4 vs. Intraoperative data |
0.900 |
0.718 – 0.967 |
0.921 |
0.605 – 0.996 |
|
|
|
|
|
|
|
Radiologist vs. Radiologist |
0.997 |
0.994 – 0.999 |
0.971 |
0.939 – 0.989 |
|
Radiologist vs. Intraoperative data |
0.967 |
0.932 – 0.987 |
0.953 |
0.905 – 0.982 |
|
Radiologist #1 vs. Intraoperative data |
0.915 |
0.765 – 0.970 |
0.935 |
0.819 – 0.978 |
|
Radiologist #2 vs. Intraoperative data |
0.911 |
0.756 – 0.969 |
0.893 |
0.712 – 0.963 |
|
Radiologist #3 vs. Intraoperative data |
0.912 |
0.759 – 0.970 |
0.930 |
0.804 – 0.976 |
|
Radiologist #4 vs. Intraoperative data |
0.900 |
0.729 – 0.965 |
0.913 |
0.760 – 0.970 |
|
|
|
|
|
|
|
Software vs. Software |
0.996 |
0.992 – 0.999 |
0.943 |
0.831 – 0.993 |
|
Software #1 vs. Intraoperative data |
0.952 |
0.891 – 0.982 |
0.945 |
0.875 – 0.979 |
|
Software #2 vs. Intraoperative data |
0.915 |
0.765 – 0.970 |
0.935 |
0.819 – 0.978 |
|
Software #3 vs. Intraoperative data |
0.956 |
0.908 – 0.983 |
0.930 |
0.856 – 0.973 |
|
Software #4 vs. Intraoperative data |
0.912 |
0.759 – 0.970 |
0.930 |
0.804 – 0.976 |
|
Software #5 vs. Intraoperative data |
0.900 |
0.718 – 0.967 |
0.921 |
0.605 – 0.996 |
|
|
|
|
|
|
|
Surgeon vs. Radiologist |
0.996 |
0.992 – 0.999 |
0.943 |
0.831 – 0.993 |
Table 2: Mean differences between estimated and measured volumes according to the operators.
|
|
Assessment by surgeons |
Assessment by radiologists |
|
Liver volume in DDLT group (cc) mean ± SD* |
235.1 ± 201 |
261.5 ± 211 |
|
Graft volume in LDLT group (cc) mean ± SD |
131 ± 91 |
143 ± 93 |
* the difference corresponds to the absolute difference as patients # 1, 6, 8 and 10 had negative average differences with the weighted volume.
SD: standard deviation
Table 3: Comparison between estimated and weighed livers in LDLT group for right or left graft
|
|
Right liver |
Left liver |
||
|
|
Δ |
Concordance |
Δ |
Concordance |
|
Surgeons |
212 ± 110 cc a
[103 - 381] |
0.913
[0.147 – 0.984] |
91 ± 46 cc c
[30 - 181] |
0.949
[0.810 – 0.987] |
|
Radiologists |
237 ± 96 cc b
[122 - 369] |
0.934
[0.420 – 0.994] |
96 ± 45 cc d
[39 - 188] |
0.965
[0.808 – 0.987] |
Δ : difference between estimated and real volumes Statistical analysis compared estimated versus real volumes. a: p=0.012, b: p=0.006, c: p=0.81, d: p=0.71
Table 4: Percentage of improvement in the left liver volume’s calculation per series of cases per rater considering the assessment by another rater (pair working)
|
Type of duo |
Reference: surgeon |
Reference: radiologist |
|
Surgeon + radiologist (n = 32 unique possibilities) |
0 – 14.3% |
51.7 – 100% |
|
Surgeon + surgeon (n = 12 unique possibilities) |
0 – 14.3% |
/ |
|
Radiologist + radiologist (n = 12 unique possibilities) |
/ |
0 – 14.3% |
Abbreviations:
|
CT scan |
computerised tomography |
|
DDLT |
deceased-donor liver transplantation |
|
FLR |
future liver remnant |
|
HPB |
hepatobiliary |
|
IRC |
inter-rater concordance |
|
LDLT |
living donor liver transplantation |
|
PACS |
picture archiving and communication system |
|
Ra |
radiologist |
|
SD |
standard deviation |
|
So |
software |
|
Su |
surgeon |
|
TLV |
total liver volume |
References
- Wakabayashi G, Cherqui D, Geller DA, Buell JF, Kaneko H, et al. (2015) Recommendations for laparoscopic liver resection: a report from the second international consensus conference held in Morioka. Ann Surg 261: 619-629. [Crossref]
- Truant S, Oberlin O, Sergent G, Lebuffe G, Gambiez L, et al. (2007) Remnant Liver Volume to Body Weight Ratio ≥0.5%: A New Cut-Off to Estimate Postoperative Risks after Extended Resection in Noncirrhotic Liver. J Am Coll Surg 204: 22-33. [Crossref]
- Manas D, Burnapp L, Andrews PA (2016) Summary of the British Transplantation Society UK Guidelines for Living Donor Liver Transplantation. Transplantation 100: 1184-1190. [Crossref]
- Lo CM, Fan ST, Liu CL, Chan JK, Lam BK, et al. (1999) Minimum graft size for successful living donor liver transplantation. Transplantation 68: 1112-1126. [Crossref]
- Marubashi S, Nagano H, Eguchi H, Wada H, Asaoka T, et al. (2016) Minimum graft size calculated from preoperative recipient status in living donor liver transplantation. Liver Transpl 22: 599-606. [Crossref]
- Rahbari NN, Garden OJ, Padbury R, Brooke-Smith M, Crawford M, et al. (2011) Posthepatectomy liver failure: a definition and grading by the International Study Group of Liver Surgery (ISGLS). Surgery 149: 713-724. [Crossref]
- Golse N, Bucur PO, Adam R, Castaing D, Sa Cunha A, et al. (2013) New paradigms in post-hepatectomy liver failure. J Gastrointest Surg 17: 593-605. [Crossref]
- Kamel IR, Kruskal JB, Warmbrand G, Goldberg SN, Pomfret EA, et al. (2001) Accuracy of volumetric measurements after virtual right hepatectomy in potential donors undergoing living adult liver transplantation. AJR Am J Roentgenol 176: 483-487. [Crossref]
- Lodewick TM, Arnoldussen CWKP, Lahaye MJ, van Mierlo KMC, Neumann UP, et al. (2016) Fast and accurate liver volumetry prior to hepatectomy. HPB (Oxford) 18: 764-772. [Crossref]
- Karlo C, Reiner CS, Stolzmann P, Breitenstein S, Marincek B, et al. (2010) CT- and MRI-based volumetry of resected liver specimen: comparison to intraoperative volume and weight measurements and calculation of conversion factors. Eur J Radiol 75: 107-111. [Crossref]
- Hermoye L, Laamari-Azjal I, Cao Z, Annet L, Lerut J, et al. (2005) Liver segmentation in living liver transplant donors: comparison of semiautomatic and manual methods. Radiology 234: 171-178. [Crossref]
- Kitajima K, Taboury J, Boleslawski E, Savier E, Vaillant JC, et al. (2008) Sonographic preoperative assessment of liver volume before major liver resection. Gastroenterol Clin Biol 32: 382-389. [Crossref]
- Schroeder T, Malagó M, Debatin JF, Goyen M, Nadalin S, et al. (2005) “All-in-one” imaging protocols for the evaluation of potential living liver donors: comparison of magnetic resonance imaging and multidetector computed tomography. Liver Transpl 11: 776-787. [Crossref]
- Goumard C, Perdigao F, Cazejust J, Zalinski S, Soubrane O, et al. (2014) Is computed tomography volumetric assessment of the liver reliable in patients with cirrhosis? HPB (Oxford) 16: 188-194. [Crossref]
- Hori M, Suzuki K, Epstein ML, Baron RL (2011) Computed tomography liver volumetry using 3-dimensional image data in living donor liver transplantation: effects of the slice thickness on the volume calculation. Liver Transpl 17: 1427-1436. [Crossref]
- Sonnemans LJP, Hol JC, Monshouwer R, Prokop M, Klein WM (2016) Correlation Between Liver Volumetric Computed Tomography Results and Measured Liver Weight: A Tool for Preoperative Planning of Liver Transplant. Exp Clin Transplant. Exp Clin Transplant 14: 72-78. [Crossref]
- Lamadé W, Glombitza G, Fischer L, Chiu P, Cárdenas CE, et al. (2000) The impact of 3-dimensional reconstructions on operation planning in liver surgery. Arch Surg 135: 1256-1261. [Crossref]
- Bégin A, Martel G, Lapointe R, Belblidia A, Lepanto L, et al. (2014) Accuracy of preoperative automatic measurement of the liver volume by CT-scan combined to a 3D virtual surgical planning software (3DVSP). Surg Endosc 28: 3408-3412. [Crossref]
- Christe A, Brönnimann A, Vock P (2014) Volumetric analysis of lung nodules in computed tomography (CT): comparison of two different segmentation algorithm softwares and two different reconstruction filters on automated volume calculation. Acta Radiol 55: 54-61. [Crossref]
- de Hoop B, Gietema H, van Ginneken B, Zanen P, Groenewegen G, et al. (2009) A comparison of six software packages for evaluation of solid lung nodules using semi-automated volumetry: what is the minimum increase in size to detect growth in repeated CT examinations. Eur Radiol 19: 800-808. [Crossref]
- Callister MEJ, Baldwin DR, Akram AR, Barnard S, Cane P, et al. (2015) British Thoracic Society guidelines for the investigation and management of pulmonary nodules. Thorax. BMJ 2: 1-54. [Crossref]
- Mussin N, Sumo M, Lee K-W, Choi Y, Choi JY, et al. (2017) The correlation between preoperative volumetry and real graft weight: comparison of two volumetry programs. Ann Surg Treat Res 92: 214-220. [Crossref]
- Dello SA, Stoot JH, van Stiphout RS, Bloemen JG, Wigmore SJ, et al. (2011) Prospective volumetric assessment of the liver on a personal computer by nonradiologists prior to partial hepatectomy. World J Surg 35: 386-392. [Crossref]
- Bismuth H, Chiche L, Adam R, Castaing D, Diamond T, et al. (1993) Liver resection versus transplantation for hepatocellular carcinoma in cirrhotic patients. Ann Surg 218: 145-151. [Crossref]
- Azoulay D, Bhangui P, Andreani P, Salloum C, Karam V, et al. (2011) Short- and long-term donor morbidity in right lobe living donor liver transplantation: 91 consecutive cases in a European Center. Am J Transplant 11: 101-110. [Crossref]
- van der Vorst JR, van Dam RM, van Stiphout RSA, van den Broek MA, Hollander IH, et al. (2010) Virtual liver resection and volumetric analysis of the future liver remnant using open source image processing software. World J Surg 34: 2426-2433. [Crossref]
- Niehues SM, Unger JK, Malinowski M, Neymeyer J, Hamm B, et al. (2010) Liver volume measurement: reason of the difference between in vivo CT-volumetry and intraoperative ex vivo determination and how to cope it. Eur J Med Res 15: 345-350. [Crossref]
- Itoh S, Shirabe K, Taketomi A, Morita K, Harimoto N, et al. (2012) Zero mortality in more than 300 hepatic resections: validity of preoperative volumetric analysis. Surg Today 42: 435–440. [Crossref]
- Sakamoto S, Uemoto S, Uryuhara K, Kim Id, Kiuchi T, et al. (2001) Graft size assessment and analysis of donors for living donor liver transplantation using right lobe. Transplantation 71: 1407-1413. [Crossref]
- D’Onofrio M, De Robertis R, Demozzi E, Crosara S, Canestrini S, et al. (2014) Liver volumetry: Is imaging reliable? Personal experience and review of the literature. World J Radiol 6: 62-71. [Crossref]
- Vauthey J-N, Abdalla EK, Doherty DA, Gertsch P, Fenstermacher MJ, et al. (2002) Body surface area and body weight predict total liver volume in Western adults. Liver Transpl 8: 233-240. [Crossref]
- Martel G, Cieslak KP, Huang R, van Lienden KP, Wiggers JK, et al. (2015) Comparison of techniques for volumetric analysis of the future liver remnant: implications for major hepatic resections. HPB (Oxford) 17: 1051-1057. [Crossref]
- Simpson AL, Geller DA, Hemming AW, Jarnagin WR, Clements LW, et al. (2014) Liver planning software accurately predicts postoperative liver volume and measures early regeneration. J Am Coll Surg 219: 199-207. [Crossref]
- Radtke A, Nadalin S, Sgourakis G, Sotiropoulos GC, Molmenti EP, et al. (2008) Liver “compliance”: a previously unrecognized preoperative predictor of small-for-size syndrome in adult living donor liver transplantation. Transplant Proc 40: 3142-3146. [Crossref]
- Schiano TD, Bodian C, Schwartz ME, Glajchen N, Min AD (2000) Accuracy and significance of computed tomographic scan assessment of hepatic volume in patients undergoing liver transplantation. Transplantation 69: 545-550. [Crossref]
- Yu HC, You H, Lee H, Jin Z-W, Moon JI, et al. (2004) Estimation of standard liver volume for liver transplantation in the Korean population. Liver Transpl 10: 779-783. [Crossref]
- Heinemann A, Wischhusen F, Püschel K, Rogiers X (1999) Standard liver volume in the Caucasian population. Liver Transpl Surg 5: 366-368. [Crossref]