Serum Copeptin Level as a Predictor of One-Year Mortality after Acute Decompensated Heart Failure Hospitalization
A B S T R A C T
Background: Acutely decompensated heart failure patients have variable clinical outcomes. Some predictors of mortality in acute heart failure as resting heart rate, blood pressure, Pro-BNP level, and others have been identified. This study addresses the question whether copeptin may add value in the one-year prognosis in this category of high-risk patients.
Results: To assess the relationship of serum copeptin level with one year mortality, we evaluated serum copeptin at admission and after 72 hours in 106 consecutive patients hospitalized for acute decompensated heart failure between May 2021 and November 2021 in a tertiary care hospital.
Twenty-four patients (23.3%) died during the one-year follow-up period. The mortality was significantly higher in patients with advancing age, male sex, smokers, NYHA class IV heart failure, lower ejection fractions, higher heart rate, higher burden of arrhythmic events, lower creatinine clearance, and higher levels of copeptin at baseline and at day 3.
Copeptin level at day 1 with cutoff value of ˃25.4 pmol/l predicted mortality with sensitivity 87.5% and specificity 70.73% [hazard ratio (95% confidence interval): (0.725 - 0.898), P<0.001], while copeptin level at day 3 with cutoff value ˃ 26.1 pmol/l predicted mortality with sensitivity 100% and specificity 73.17% [hazard ratio (95% confidence interval): (0.876 - 0.981), P<0.001].
Finally, increase in copeptin level from bassline was independently associated with increased mortality. (p˂0.001).
Conclusions: Elevated copeptin level at baseline and 72 hours post-admission is suggested to be a strong predictor of one year mortality in patients with acute decompensated heart failure.
Keywords
Copeptin, heart failure, prognosis, adverse events, vasopressin
Background
Heart failure (HF) is a leading cause of hospital admissions worldwide with high morbidity and mortality [1]. Better prognostic assessment is needed as it may help in identification of patients who benefit from immediate therapeutic interventions. Natriuretic peptides measurement [i.e., N-terminal pro-B-type natriuretic peptide (NT-proBNP)] is frequently used in clinical practice especially when diagnosis of HF is uncertain [2]. Also, measurement of these peptides is valuable in risk stratification, and during follow up there fall correlates with a better prognosis [3-8]. Recently, other biomarkers, like mid-regional pro-adrenomedullin (MR-proADM), mid-regional pro-atrial natriuretic peptide (MR-proANP), and copeptin, were found to be of added prognostic benefits [2, 9]. Copeptin is C-terminal fragment of pre-pro-vasopressin. Unlike vasopressin, it is stable and can be easily measured [10].
Further, serial measurement of biomarkers in hospitalized decompensated HF patients has received growing interest for prediction of HF outcomes [11, 12]. So far, little is known regarding the exact trajectory of these peptides during acute decompensation of heart failure patients [13]. In a previous study, serial measurements of multiple biomarkers in HF were done and it was found that copeptin level at admission with re-measurement at 72 h is the best predictor of 90-day mortality and rehospitalization [14]. However, the usefulness of copeptin for predicting mortality in heart failure patients has not been adequately evaluated in daily clinical practice in egyptian population. The primary aim of this study was to determine the performance and clinical significance of serial in-hospital measurements of copeptin level to predict the twelve-month mortality in acute decompensated HF.
Methods
I Study Population
The study was a single-center prospective study of 106 patients presenting to a tertiary care hospital with a primary diagnosis of acute decompensated HF between May 2021 and November 2021. The institutional ethical committee board approved the study, and all patients gave their written informed consent. Patients were eligible if they had signs and symptoms of HF with dyspnea at rest or with minimal exertion [New York Heart Association (NYHA) class III and IV] and evidence of pulmonary congestion on physical examination or chest imaging. Patients were excluded if having any of the following criteria: severe pulmonary disease either exacerbating bronchial asthma or chronic obstructive pulmonary disease, acute myocardial infarction, cardiogenic shock, sepsis or active infection, life threatening arrhythmias (ventricular tachycardia, complete heart block, atrial fibrillation/flutter with ventricular response of >150 b.p.m.) or end stage renal disease with estimated glomerular filtration rate (eGFR) ≤ 15 ml/min, acute myocarditis, hypertrophic obstructive, restrictive, or constrictive cardiomyopathy; younger than 18 years, or were unable to give an informed consent.
II Laboratory Evaluation
Blood samples were obtained from a vein while the patients were in a supine or sitting position. Copeptin was measured on admission and after 72 hours of hospitalization. The serum samples were separated from blood samples by centrifugation at the speed of 2000-3000 rpm, then stored at -80° C until they were assayed. Copeptin was detected with a double-antibody sandwich enzyme-linked immune sorbent assay (ELISA) using Human Copeptin ELISA Kit (Shanghai Sun-red Biological Technology Co., Ltd. Catalogue No. 201-12-5463) following the manufacturer’s recommendations.
III Follow-Up and Study End Point
The primary outcome of this study was the occurrence of cardiac death within the one-year follow up period. Death was considered cardiac in origin unless other obvious non-cardiac causes could be identified. Follow-up information was obtained by hospital records and/ or telephone contact with the patients or relatives.
IV Statistical Analysis
Data were fed to the computer and analysed using IBM SPSS software package version 20.0 (Armonk, NY: IBM Corp). Categorical data were represented as numbers and percentages; chi-square test was applied to compare between two groups. Alternatively, fisher exact or monte carlo correction test was applied when more than 20% of the cells have expected count less than 5. For continuous data, they were tested for normality by the kolmogorov-smirnov and shapiro-wilk test. Quantitative data were expressed as range (minimum and maximum), mean, standard deviation and median for normally distributed quantitative variables; student t-test was used to compare two groups. On the other hand, for abnormally distributed quantitative variables, mann whitney test was used to compare two groups. Receiver operating characteristic curve (ROC) was used to determine the diagnostic performance of the markers, area more than 50% gives acceptable performance and area about 100% is the best performance for the test, and logistic regression analysis was used to detect the most independent factor for affecting mortality. Significance of the obtained results was judged at the 5% level.
Results
A total of 106 patients (mean age 65 years, 67.9% male, mean left ventricular ejection fraction 37.9%, 51% in NYHA class IV) were enrolled in the study. During the one year follow up period, there were twenty-four deaths representing 23.3% of the total population. Of these 24 deaths, 16 deaths (67%) occurred in the first 90 days post discharge. Table 1 summarizes the different demographic, clinical and laboratory data of the studied population and their distribution among both the died and survived groups. As shown in (Table 1), the mortality was higher among the elderly, male, smokers, those with lower ejection fraction, higher NYHA functional class, patients with higher resting heart rates, lower creatinine clearance, lower mean systolic and diastolic blood pressures, and higher burden of arrhythmic events during hospitalization.
Table
1: Comparison
between the two studied groups according to different demographic, clinical and
laboratory parameters.
|
|
Total
(n=106) |
Died
(n=24) |
Survival
(n=82) |
P
value |
|
Age
(years) |
|
|
|
|
|
Mean
± SD. |
65.1
± 9.4 |
72.7
± 6.3 |
62.8
± 9.1 |
<0.001* |
|
Sex |
|
|
|
|
|
Male |
72
(67.9%) |
22
(91.7%) |
50
(61%) |
0.005* |
|
Female |
34
(32.1%) |
2
(8.3%) |
32
(39%) |
|
|
Smoking |
|
|
|
|
|
Non
smoker |
52
(49.1%) |
2
(8.3%) |
50
(61%) |
<0.001* |
|
Smoker |
54
(50.9%) |
22
(91.7%) |
32
(39%) |
|
|
IHD |
75
(70.8%) |
20
(83.3%) |
55
(67.1%) |
0.124 |
|
HTN |
62
(58.5%) |
11
(45.8%) |
51
(62.2%) |
0.152 |
|
DM |
37
(34.9%) |
6
(25%) |
31
(37.8%) |
0.247 |
|
Dyslipidemia
|
40
(37.7%) |
11
(45.8%) |
29
(35.4%) |
0.352 |
|
NYHA |
|
|
|
|
|
III |
52
(49.1%) |
0
(0%) |
52
(63.4%) |
<0.001* |
|
IV |
54
(50.9%) |
24
(100%) |
30
(36.6%) |
|
|
Systolic
BP |
|
|
|
|
|
Mean
± SD. |
139
± 19.5 |
129.2
± 24.5 |
141.8
± 16.9 |
0.005* |
|
Diastolic
BP |
|
|
|
|
|
Mean
± SD. |
89.7
± 12.6 |
81.7
± 14.3 |
92.1
± 11.1 |
<0.001* |
|
HR |
|
|
|
|
|
Mean
± SD. |
79.5
± 13.1 |
92.5
± 14.5 |
75.6
± 9.8 |
<0.001* |
|
EF
% |
|
|
|
|
|
<40 |
66
(62.3%) |
23
(95.8%) |
43
(52.4%) |
<0.001* |
|
≥40 |
40
(37.7%) |
1
(4.2%) |
39
(47.6%) |
|
|
Mean
± SD. |
37.9
± 10.7 |
29
± 8.1 |
40.5
± 9.9 |
<0.001* |
|
Median
(Min. - Max.) |
35
(11 - 65) |
30
(11 - 55) |
36
(30 - 65) |
|
|
Arrythmias |
|
|
|
|
|
Negative |
78
(73.6%) |
9
(37.5%) |
69
(84.1%) |
MCp |
|
AF |
14
(13.2%) |
12
(50%) |
2
(2.4%) |
|
|
PVCs |
14
(13.2%) |
3
(12.5%) |
11
(13.4%) |
|
|
Valvular
disease |
|
|
|
|
|
Negative |
51
(48.1%) |
12
(50%) |
39
(47.6%) |
MCp= |
|
AS |
12
(11.3%) |
2
(8.3%) |
10
(12.2%) |
|
|
AR |
15
(14.2%) |
6
(25%) |
9
(11%) |
|
|
MR |
28
(26.4%) |
4
(16.7%) |
24
(29.3%) |
|
|
Hb
level, g/dl |
|
|
|
|
|
Mean
± SD. |
10.6
± 1.4 |
10.7
± 0.8 |
10.6
± 1.5 |
0.619 |
|
CrCL,
ml/min |
|
|
|
|
|
Mean
± SD. |
47.5
± 12.5 |
35.7
± 8.7 |
50.9
± 11.2 |
<0.001* |
|
Na |
|
|
|
|
|
Mean
± SD. |
139.6
± 2.1 |
139.5
± 2.4 |
139.6
± 2 |
0.806 |
|
K |
|
|
|
|
|
Mean
± SD. |
3.6
± 0.3 |
3.7
± 0.4 |
3.6
± 0.3 |
0.533 |
SD:
Standard deviation
p:
p value for comparing between the two studied groups.
*:
Statistically significant at p ≤ 0.05.
AF:
atrial fibrillation, AR: aortic regurgitation, AS: aortic stenosis, BP: blood
pressure, Crcl: creatinine clearance, DM: Diabetes Mellitus, EF: ejection
fraction, Hb: haemoglobin, HR: heart rate, HTN: hypertension, IHD: ischaemic
heart disease, K: potassium, MR: mitral regurgitation, Na: sodium, NYHA: New
York heart association, PVC: premature ventricular complex.
Regarding serum copeptin, we found serum copeptin level significantly elevated in the group who reached the study endpoints compared to the survived group (Table 2). On admission, mean serum copeptin among the studied population was 27 ± 8.2 pmol/L. The mean level was higher in the group who reached the end point compared to survived group (32.9 ± 14.5 pmol/L versus 25.2 ± 3.5 pmol/L respectively, P<0.001).
After 72 hours, mean serum copeptin among the studied population reached 30.5 ± 12.3 pmol/L. The mean level was again higher in the group who reached the end point compared to survived group (44.1 ± 18.7 pmol/L versus 26.5 ± 5 pmol/L respectively, P<0.001). This reflects how serum copeptin level changed significantly in patients who died at the end of follow up period compared to those who survived. Serum copeptin increased by 11.2 ± 10.8 pmol/L (38.1 ± 38.6 % from baseline) in patients who died, compared to 1.2 ± 6.1 pmol/L (6.5 ± 23.1 % from baseline) in survived patients, P <0.001. The prognostic value for copeptin to predict mortality at the end of one year follow up is presented with the ROC curve in (Figure 1).
Table
2: Comparison
between the two studied groups according to serum copeptin level and percentage
of change in serum copeptin level.
|
Copeptin |
Total
(n = 106) |
Died
(n = 24) |
Survival
(n = 82) |
p |
|
Admission
level |
|
|
|
|
|
Mean
± SD. |
27
± 8.2 |
32.9
± 14.5 |
25.2
± 3.5 |
<0.001* |
|
Median
(Min. - Max.) |
25.3
(15 - 80.1) |
27.9
(24 - 80.1) |
24.6
(15 - 42) |
|
|
72
h level |
|
|
|
|
|
Mean
± SD. |
30.5 ± 12.3 |
44.1 ± 18.7 |
26.5 ± 5 |
<0.001* |
|
Median
(Min. - Max.) |
26
(17 - 110) |
38
(27.4 - 110) |
25
(17 - 36) |
|
|
Increase |
|
|
|
|
|
Mean
± SD. |
3.5
± 8.5 |
11.2 ± 10.8 |
1.2 ± 6.1 |
<0.001* |
|
Median
(Min. - Max.) |
0.6
(-21 - 34.4) |
10.1
(-7 - 34.4) |
0.1
(-21 - 12) |
|
|
%
of Increase |
|
|
|
|
|
Mean
± SD. |
13.6 ± 30.2 |
38.1
± 38.6 |
6.5
± 23.1 |
<0.001* |
|
Median
(Min. - Max.) |
2.4
(-50 - 134.4) |
36
(-18.4 - 134.4) |
0.4
(-50 - 50) |
SD:
Standard deviation
p:
p value for comparing between the two studied groups.
*:
Statistically significant at p ≤ 0.05.
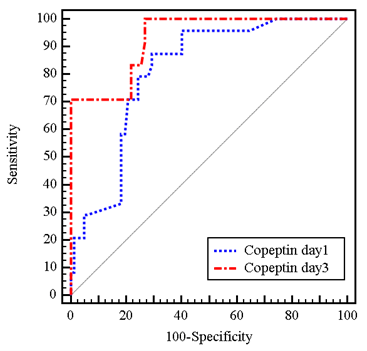
Figure 1: ROC curve for copeptin in day 1 and day 3 to predict mortality.
(n= 24 vs. n=82).
When defining a copeptin threshold of >25.5 pmol/L at baseline, the positive and negative predictive values of mortality were 46.7% and 95.1%, respectively. Likewise, sensitivity and specificity for this cut-off were 87.5% and 70.73% [hazard ratio (95% confidence interval): (0.725 - 0.898), P<0.001]. After 72 hours, a cut-off value of more than 26.1 pmol/L had 52.2% positive predictive value of mortality and 100% negative predictive value of mortality. The sensitivity and the specificity for this cut-off were 100% and 73.13%, respectively [hazard ratio (95% confidence interval): (0.876 - 0.981), P<0.001] (Table 3).
Table
3: Prognostic
performance for copeptin in Day 1 and Day 3 to predict mortality (n= 24 vs.
n=82).
|
Copeptin |
AUC |
p |
95%
C.I |
Cut
off# |
Sensitivity |
Specificity |
PPV |
NPV |
|
Day
1 |
0.811 |
<0.001* |
0.725
- 0.898 |
>25.4 |
87.50 |
70.73 |
46.7 |
95.1 |
|
Day
3 |
0.928 |
<0.001* |
0.876
- 0.981 |
>26.1 |
100.0 |
73.17 |
52.2 |
100.0 |
AUC:
Area Under a Curve; p value: Probability value; CI: Confidence Intervals; NPV:
Negative predictive value; PPV: Positive predictive value.
*:
Statistically significant at p ≤ 0.05.
#Cut
off was choose according to youden index.
Table 4 shows the logistic regression analysis of the significant factors affecting the mortality among the studied population. In multivariate analysis of these factors, only higher resting heart rate, high day 1 serum copeptin, and the percentage of increase in serum copeptin from day1 to day 3 were independent predictors of mortality. Odds ratio for mortality were 1.677 (1.110 - 2.533 95% confidence interval), 1.589 (1.068 - 2.362 95% confidence interval), and 1.120 (1.019 - 1.230 95% confidence interval) respectively.
Table
4: Univariate
and multivariate logistic regression analysis for the parameters affecting
mortality (n = 24 vs. 82).
|
|
Univariate |
#Multivariate |
||
|
p |
OR
(LL - UL 95% C.I) |
p |
OR
(LL - UL 95%C.I) |
|
|
Age
(years) |
<0.001* |
1.165
(1.081 - 1.257) |
0.431 |
1.125
(0.840 - 1.506) |
|
Male |
0.012* |
7.040
(1.549 - 31.996) |
0.931 |
0.067
(1.62´10-28 - 2.76´1025) |
|
HR |
<0.001* |
1.164
(1.081 - 1.253) |
0.014* |
1.677
(1.110 - 2.533) |
|
EF
% |
<0.001* |
0.788
(0.692 - 0.897) |
0.078 |
0.397
(0.142 - 1.108) |
|
0.002* |
1.223 (1.079 -
1.385) |
0.022* |
1.589 (1.068 - 2.362) |
|
|
%
of Increase in Copeptin |
<0.001* |
1.036
(1.017 - 1.055) |
0.019* |
1.120 (1.019 - 1.230) |
OR:
Odd`s ratio.
C.I:
Confidence interval; LL: Lower limit; UL: Upper Limit.
#:
All variables with p<0.05 was included in the multivariate.
*:
Statistically significant at p ≤ 0.05.
EF:
ejection fraction; HR” heart rate.
Discussion
The major conclusion of the present study was that increased concentrations of serum copeptin determined in patients with acute decompensated heart failure at the time of initial presentation and after 72 hours of admission indicated an increased risk of mortality. It was also noted that, patients with mild change in serum copeptin level had better survival compared to patients with more increased levels from baseline to 72 hours later, addressing the benefit of the serial measurements of serum copeptin level and its correlation with prognosis.
Multiple earlier studies had showed that higher serum copeptin level was an independent predictor of mortality and heart failure hospitalization. In a small study of 40 patients in NYHA class III and IV hospitalized for decompensated heart failure, they found copeptin and MR-proANP appear to have potential for monitoring acute responses to therapy. Only copeptin and BNP contributed to risk stratification in this cohort of advanced HF patients, but the conjoint use of BNP or NT-proBNP does not appear to impact the prognostic value of copeptin alone. Copeptin levels were higher in post hospitalized non-survivors and associated with increased mortality (p =0.04) [15].
Additionally, Gegenhuber et al. -who studied the level of BNP, MR-proANP, MR-proADM, and copeptin plasma concentrations in 137 patients with acute destabilized heart failure- demonstrated that increased levels of copeptin, BNP, MR-proANP, and MR-proADM in patients with HF at admission independently indicated an increased risk of 1 year mortality [5]. In the BACH (Biomarkers in Acute Heart Failure) study- that was a 15-center, diagnostic and prognostic study - 557 patients with acute HF were included in the analysis. It showed significantly increased 90-day mortality, heart failure readmissions, and emergency department visits in patients with elevated serum copeptin [2].
Y. Yoshikawa et al. evaluated serum copeptin at admission in consecutive 107 patients hospitalized for HF and found high serum copeptin was an independent predictor for all-cause mortality and heart failure hospitalization [16]. A total of 5,989 participants from 17 prospective studies were included in a large meta-analysis that showed significant association between circulating copeptin levels and risk of all-cause death in patients with HF [17]. In a more recent meta-analysis, copeptin level was higher in patients with HF-related death and hospitalization vs. stable patients (31.3 ± 23.7 vs. 20.4 ± 12.8; MD= -13.06; 95% CI: -25.28 to -0.84; p = 0.04) [18].
Regarding the importance of serial in-hospital measurements of serum copeptin, our study showed that the increase in serum copeptin level is a strong independent predictor of mortality with odds ratio of 1.120, in other words, each 1% increase in serum copeptin from the admission level increases the mortality by 12%. These results are in line with that of MOLITOR study which demonstrated that persistently elevated copeptin levels during hospitalization, from admission to 72 hours later were associated with worse outcome [14].
In another study, it was demonstrated that acute hospitalized HF patients with high levels of copeptin at both hospital admission and discharge had significantly increased risk of developing events (death or rehospitalization) at 90 days. They also demonstrated that there was a better 90-day prognosis in acute HF patients with a higher decrease of copeptin from admission to discharge compared with patients who showed a lower decrease of copeptin addressing again the value of change in copeptin level rather than a single admission level [19].
Conclusion
Copeptin is a strong novel biomarker in prognosis of acute heart failure, higher circulating copeptin levels were positively associated with the risk of mortality in patients with acute decompensated HF. Also, we recommend serial in-hospital measurements of copeptin as a rising pattern of copeptin is an independent predictor of mortality. This pattern could be a target for therapy before discharge and could highlight those who are at higher risk and may need more extended follow up.
Study Limitations
Despite the data we had, we think our study was limited by the small number of patients and the lack of more extended follow up. Another limitation is that we focused only on the acute hospitalized heart failure patients, and we did not include those with chronic compensated heart failure patients.
Ethics Approval and Consent to Participate
All procedure aspects were approved by the local ethics committee (ethics committee of the faculty of medicine, Alexandria University). All participants gave written informed consent for participation in the study and for publication of data.
Consent for Publication
A consent was obtained from each patient for publication.
Availability of Data and Material
The datasets used and/or analysed during the current study are available from the corresponding author on reasonable request.
Competing Interests
None.
Funding
None.
Acknowledgements
Not applicable.
Abbreviations
AF: Atrial fibrillation
AS: Aortic stenosis
AR: Aortic regurgitation
BP: Blood Pressure
bpm: Beats per minute
CrCl: Creatinine clearance
DM: Diabetes Mellitus
EF: Ejection fraction
Hb: Haemoglobin
HF: Heart failure
HR: Heart rate
HTN: Hypertension
IHD: Ischaemic heart disease
MR: Mitral regurgitation
NT-proBNP: N-terminal pro-B-type natriuretic peptide
MR-proADM: Mid-regional pro-adrenomedullin
MR-proANP: Mid-regional pro-atrial natriuretic peptide
PVCs: Premature ventricular contractions
Article Info
Article Type
Research ArticlePublication history
Received: Wed 04, Oct 2023Accepted: Mon 13, Nov 2023
Published: Fri 29, Dec 2023
Copyright
© 2023 Ahmed Mahmoud El Amrawy. This is an open-access article distributed under the terms of the Creative Commons Attribution License, which permits unrestricted use, distribution, and reproduction in any medium, provided the original author and source are credited. Hosting by Science Repository.DOI: 10.31487/j.JICOA.2023.02.02
Figures & Tables
Table
1: Comparison
between the two studied groups according to different demographic, clinical and
laboratory parameters.
|
|
Total
(n=106) |
Died
(n=24) |
Survival
(n=82) |
P
value |
|
Age
(years) |
|
|
|
|
|
Mean
± SD. |
65.1
± 9.4 |
72.7
± 6.3 |
62.8
± 9.1 |
<0.001* |
|
Sex |
|
|
|
|
|
Male |
72
(67.9%) |
22
(91.7%) |
50
(61%) |
0.005* |
|
Female |
34
(32.1%) |
2
(8.3%) |
32
(39%) |
|
|
Smoking |
|
|
|
|
|
Non
smoker |
52
(49.1%) |
2
(8.3%) |
50
(61%) |
<0.001* |
|
Smoker |
54
(50.9%) |
22
(91.7%) |
32
(39%) |
|
|
IHD |
75
(70.8%) |
20
(83.3%) |
55
(67.1%) |
0.124 |
|
HTN |
62
(58.5%) |
11
(45.8%) |
51
(62.2%) |
0.152 |
|
DM |
37
(34.9%) |
6
(25%) |
31
(37.8%) |
0.247 |
|
Dyslipidemia
|
40
(37.7%) |
11
(45.8%) |
29
(35.4%) |
0.352 |
|
NYHA |
|
|
|
|
|
III |
52
(49.1%) |
0
(0%) |
52
(63.4%) |
<0.001* |
|
IV |
54
(50.9%) |
24
(100%) |
30
(36.6%) |
|
|
Systolic
BP |
|
|
|
|
|
Mean
± SD. |
139
± 19.5 |
129.2
± 24.5 |
141.8
± 16.9 |
0.005* |
|
Diastolic
BP |
|
|
|
|
|
Mean
± SD. |
89.7
± 12.6 |
81.7
± 14.3 |
92.1
± 11.1 |
<0.001* |
|
HR |
|
|
|
|
|
Mean
± SD. |
79.5
± 13.1 |
92.5
± 14.5 |
75.6
± 9.8 |
<0.001* |
|
EF
% |
|
|
|
|
|
<40 |
66
(62.3%) |
23
(95.8%) |
43
(52.4%) |
<0.001* |
|
≥40 |
40
(37.7%) |
1
(4.2%) |
39
(47.6%) |
|
|
Mean
± SD. |
37.9
± 10.7 |
29
± 8.1 |
40.5
± 9.9 |
<0.001* |
|
Median
(Min. - Max.) |
35
(11 - 65) |
30
(11 - 55) |
36
(30 - 65) |
|
|
Arrythmias |
|
|
|
|
|
Negative |
78
(73.6%) |
9
(37.5%) |
69
(84.1%) |
MCp |
|
AF |
14
(13.2%) |
12
(50%) |
2
(2.4%) |
|
|
PVCs |
14
(13.2%) |
3
(12.5%) |
11
(13.4%) |
|
|
Valvular
disease |
|
|
|
|
|
Negative |
51
(48.1%) |
12
(50%) |
39
(47.6%) |
MCp= |
|
AS |
12
(11.3%) |
2
(8.3%) |
10
(12.2%) |
|
|
AR |
15
(14.2%) |
6
(25%) |
9
(11%) |
|
|
MR |
28
(26.4%) |
4
(16.7%) |
24
(29.3%) |
|
|
Hb
level, g/dl |
|
|
|
|
|
Mean
± SD. |
10.6
± 1.4 |
10.7
± 0.8 |
10.6
± 1.5 |
0.619 |
|
CrCL,
ml/min |
|
|
|
|
|
Mean
± SD. |
47.5
± 12.5 |
35.7
± 8.7 |
50.9
± 11.2 |
<0.001* |
|
Na |
|
|
|
|
|
Mean
± SD. |
139.6
± 2.1 |
139.5
± 2.4 |
139.6
± 2 |
0.806 |
|
K |
|
|
|
|
|
Mean
± SD. |
3.6
± 0.3 |
3.7
± 0.4 |
3.6
± 0.3 |
0.533 |
SD:
Standard deviation
p:
p value for comparing between the two studied groups.
*:
Statistically significant at p ≤ 0.05.
AF:
atrial fibrillation, AR: aortic regurgitation, AS: aortic stenosis, BP: blood
pressure, Crcl: creatinine clearance, DM: Diabetes Mellitus, EF: ejection
fraction, Hb: haemoglobin, HR: heart rate, HTN: hypertension, IHD: ischaemic
heart disease, K: potassium, MR: mitral regurgitation, Na: sodium, NYHA: New
York heart association, PVC: premature ventricular complex.
Table
2: Comparison
between the two studied groups according to serum copeptin level and percentage
of change in serum copeptin level.
|
Copeptin |
Total
(n = 106) |
Died
(n = 24) |
Survival
(n = 82) |
p |
|
Admission
level |
|
|
|
|
|
Mean
± SD. |
27
± 8.2 |
32.9
± 14.5 |
25.2
± 3.5 |
<0.001* |
|
Median
(Min. - Max.) |
25.3
(15 - 80.1) |
27.9
(24 - 80.1) |
24.6
(15 - 42) |
|
|
72
h level |
|
|
|
|
|
Mean
± SD. |
30.5 ± 12.3 |
44.1 ± 18.7 |
26.5 ± 5 |
<0.001* |
|
Median
(Min. - Max.) |
26
(17 - 110) |
38
(27.4 - 110) |
25
(17 - 36) |
|
|
Increase |
|
|
|
|
|
Mean
± SD. |
3.5
± 8.5 |
11.2 ± 10.8 |
1.2 ± 6.1 |
<0.001* |
|
Median
(Min. - Max.) |
0.6
(-21 - 34.4) |
10.1
(-7 - 34.4) |
0.1
(-21 - 12) |
|
|
%
of Increase |
|
|
|
|
|
Mean
± SD. |
13.6 ± 30.2 |
38.1
± 38.6 |
6.5
± 23.1 |
<0.001* |
|
Median
(Min. - Max.) |
2.4
(-50 - 134.4) |
36
(-18.4 - 134.4) |
0.4
(-50 - 50) |
SD:
Standard deviation
p:
p value for comparing between the two studied groups.
*:
Statistically significant at p ≤ 0.05.
Table
3: Prognostic
performance for copeptin in Day 1 and Day 3 to predict mortality (n= 24 vs.
n=82).
|
Copeptin |
AUC |
p |
95%
C.I |
Cut
off# |
Sensitivity |
Specificity |
PPV |
NPV |
|
Day
1 |
0.811 |
<0.001* |
0.725
- 0.898 |
>25.4 |
87.50 |
70.73 |
46.7 |
95.1 |
|
Day
3 |
0.928 |
<0.001* |
0.876
- 0.981 |
>26.1 |
100.0 |
73.17 |
52.2 |
100.0 |
AUC:
Area Under a Curve; p value: Probability value; CI: Confidence Intervals; NPV:
Negative predictive value; PPV: Positive predictive value.
*:
Statistically significant at p ≤ 0.05.
#Cut
off was choose according to youden index.
Table
4: Univariate
and multivariate logistic regression analysis for the parameters affecting
mortality (n = 24 vs. 82).
|
|
Univariate |
#Multivariate |
||
|
p |
OR
(LL - UL 95% C.I) |
p |
OR
(LL - UL 95%C.I) |
|
|
Age
(years) |
<0.001* |
1.165
(1.081 - 1.257) |
0.431 |
1.125
(0.840 - 1.506) |
|
Male |
0.012* |
7.040
(1.549 - 31.996) |
0.931 |
0.067
(1.62´10-28 - 2.76´1025) |
|
HR |
<0.001* |
1.164
(1.081 - 1.253) |
0.014* |
1.677
(1.110 - 2.533) |
|
EF
% |
<0.001* |
0.788
(0.692 - 0.897) |
0.078 |
0.397
(0.142 - 1.108) |
|
0.002* |
1.223 (1.079 -
1.385) |
0.022* |
1.589 (1.068 - 2.362) |
|
|
%
of Increase in Copeptin |
<0.001* |
1.036
(1.017 - 1.055) |
0.019* |
1.120 (1.019 - 1.230) |
OR:
Odd`s ratio.
C.I:
Confidence interval; LL: Lower limit; UL: Upper Limit.
#:
All variables with p<0.05 was included in the multivariate.
*:
Statistically significant at p ≤ 0.05.
EF:
ejection fraction; HR” heart rate.
(n= 24 vs. n=82).
References
1. McDonagh TA, Metra
M, Adamo M, Gardner RS, Baumbach A et al. (2021) 2021 ESC Guidelines for the
diagnosis and treatment of acute and chronic heart failure: Developed by the
Task Force for the diagnosis and treatment of acute and chronic heart failure
of the European Society of Cardiology (ESC) With the special contribution of
the Heart Failure Association (HFA) of the ESC. Eur Heart J 42:
3599-3726. [Crossref]
2. Maisel A, Mueller
C, Nowak RM, Peacock WF, Ponikowski P et al. (2011) Midregion prohormone
adrenomedullin and prognosis in patients presenting with acute dyspnea: results
from the BACH (Biomarkers in Acute Heart Failure) trial. J Am Coll Cardiol
58: 1057-1067. [Crossref]
3. Blanche P,
Dartigues JF, Jacqmin Gadda H (2013) Estimating and comparing time-dependent
areas under receiver operating characteristic curves for censored event times
with competing risks. Stat Med 32: 5381-5397. [Crossref]
4. Hartmann O, Schuetz
P, Albrich WC, Anker SD, Mueller B et al. (2012) Time-dependent Cox regression:
serial measurement of the cardiovascular biomarker proadrenomedullin improves
survival prediction in patients with lower respiratory tract infection. Int
J Cardiol 161: 166-173. [Crossref]
5. Gegenhuber A,
Struck J, Dieplinger B, Poelz W, Pacher R et al. (2007) Comparative evaluation
of B-type natriuretic peptide, mid-regional pro-A-type natriuretic peptide,
mid-regional pro-adrenomedullin, and Copeptin to predict 1-year mortality in
patients with acute destabilized heart failure. J Card Fail 13: 42-49. [Crossref]
6. Tentzeris I, Jarai
R, Farhan S, Perkmann T, Schwarz MA et al. (2011) Complementary role of
copeptin and high-sensitivity troponin in predicting outcome in patients with
stable chronic heart failure. Eur J Heart Fail 13: 726-733. [Crossref]
7. Balling L, Kistorp
C, Schou M, Egstrup M, Gustafsson I et al. (2012) Plasma copeptin levels and
prediction of outcome in heart failure outpatients: relation to hyponatremia
and loop diuretic doses. J Card Fail 18: 351-358. [Crossref]
8. Alehagen U,
Dahlström U, Rehfeld JF, Goetze JP (2011) Association of copeptin and
N-terminal proBNP concentrations with risk of cardiovascular death in older
patients with symptoms of heart failure. JAMA 305: 2088-2095. [Crossref]
9. Maisel A, Xue Y,
Shah K, Mueller C, Nowak R, et al. (2011) Increased 90-day mortality in
patients with acute heart failure with elevated copeptin: secondary results
from the Biomarkers in Acute Heart Failure (BACH) study. Circ Heart Fail
4: 613-620. [Crossref]
10. Jia J, Chang GL,
Qin S, Chen J, He WY et al. (2017) Comparative evaluation of copeptin and
NT-proBNP in patients with severe acute decompensated heart failure, and
prediction of adverse events in a 90-day follow-up period: a prospective
clinical observation trial. Exp Ther Med 13: 1554-1560. [Crossref]
11. Yalta K, Yalta T,
Sivri N, Yetkin E (2013) Copeptin and cardiovascular disease: a review of a
novel neurohormone. Int J Cardiol 167: 1750-1759. [Crossref]
12. Gottlieb SS, Kukin
ML, Ahern D, Packer M et al. (1989) Prognostic importance of atrial natriuretic
peptide in patients with chronic heart failure. J Am Coll Cardiol 13:
1534-1539. [Crossref]
13. Loncar G, Omersa D,
Cvetinovic N, Arandjelovic A, Lainscak M Emerging biomarkers in heart failure
and cardiac cachexia. Int J Mol Sci 15: 23878-23896. [Crossref]
14. Düngen HD, Tscholl
V, Obradovic D, Radenovic S, Matic D et al. (2018) Prognostic performance of
serial in-hospital measurements of copeptin and multiple novel biomarkers among
patients with worsening heart failure: results from the MOLITOR study. ESC Heart Fail 5: 288-296. [Crossref]
15. Miller WL, Hartman
KA, Hodge DO, Hartman S, Struck J et al. (2009) Response of novel biomarkers to
BNP infusion in patients with decompensated heart failure: a multimarker
paradigm. J Cardiovasc Transl Res 2: 526-535. [Crossref]
16. Yoshikawa Y, Shiomi
H, Kuwahara K, Sowa N, Yaku N et al. (2019) Utility of copeptin for predicting
long-term clinical outcomes in patients with heart failure. J Cardiol
73: 379-385. [Crossref]
17. Zhang P, Wu X, Li
G, Sun H, Shi J (2017) Prognostic role of copeptin with all-cause mortality
after heart failure: a systematic review and meta-analysis. Ther Clin Risk
Manag 13: 49-58. [Crossref]
18. Zimodro JM, Gasecka A, Jaguszewski M, Amanowicz S, Szkiela M et al. (2022) Role of copeptin in diagnosis and outcome prediction in patients with heart failure: a systematic review and meta-analysis. Biomarkers 27: 720-726. [Crossref]
19. Vetrone F, Santarelli S, Russo V, Lalle I, De Berardinis B, et al. (2014) Copeptin decrease from admission to discharge has favorable prognostic value for 90-day events in patients admitted with dyspnea. Clin Chem Lab Med 52: 1457-1464. [Crossref]