Physiological and Pharmacological Studies on Cervical Motor Neurons in Slices Prepared from Neonatal and Aged Mice
A B S T R A C T
The effects of age on the physiological properties of cervical motor neurons were examined in slices made from an excised spinal cord graft of ICR mice from the second day after birth to age 350 days. The membrane potential of post-natal day 2 (PD2) to PD350 was about -65 mV and did not change greatly with age, although it was slightly higher at PD2. However, there were significant changes in membrane resistance, which increased with age from about 15 to 30 MΩ. The depolarization induced by the excitatory amino acid agonists, kainic acid, NMDA and AMPA, decreased with aging in spite of the increase in membrane resistance. The motor neurons of the aged mice showed delayed recovery from excitation caused by excitatory amino acid agonists. By injecting Lucifer yellow CH into motor neurons, it was observed that the dendrite trees become thin, and some of the dendrite branches were missing in older animals.
Keywords
Aging, membrane potential, membrane resistance, lucifer yellow CH, spinal slice, amino acids
Introduction
Neurodegenerative diseases such as amyotrophic lateral sclerosis (ALS) are due to the death of neurons, in the case of ALS of motor neurons. A number of different mutant genes have been found to be associated with ALS, including several different genes of superoxide dismutase 1 (SOD1) [1]. Some of these genes have been introduced into mice, and they have been used for ethology, histological and physiological study as a model of the ALS [2]. The ALS-like manifestation in the SOD1 mouse develops around 100 days after birth as increasing weakness and ultimate paralysis. Essential background for the electrophysiologic study of these mutant mice requires that one understand how the electrical properties of mouse motor neurons change with age. That is the goal of the present study.
The spinal cord slice is a convenient preparation for measurements of membrane potential, membrane resistance, and response to excitatory amino acid agonists. The in vitro slice allows manipulation of the extracellular environment in ways not possible in the intact animal. We have succeeded in preparing viable spinal slices from both rats and mice [3, 4]. In this report, we describe membrane properties of cervical motor neurons obtained from normal ICR mice of different ages, which will serve as controls for study of motor neurons from the SOD1 mutant mice. Intracellular recordings from motor neurons of various ages were performed, and changes in neuronal morphology with age were observed by intracellular injection of Lucifer yellow. Neuronal responses to excitatory amino acid agonists, kainate (KA), N-methyl-D-aspartic acid (NMDA), and amino-3-hydroxy-5-methylisoxazole-4-propionic acid (AMPA) were recorded.
Materials and Methods
This work was approved by the Animal Ethical Review Board in the Graduate School of Medical Sciences, Kyushu University, Fukuoka, Japan, and the University at Albany, USA. Four hundred and fifty µm thickness slices were prepared from the cervical spinal cord (around C-5) from about 100 males of the wild type of the SOD1 transgenic mice (ICR) in ages ranging from PD2 to PD360. Animals were deeply anaesthetized with pentobarbital (60 mg/Kg, i.p.), and the skin and muscles on the back were removed until the thoracic vertebra were roughly exposed. The calvarium overlying the cerebellum was immediately removed to expose the cervical spinal cord. Prior to removing the cord, the midbrain was transected between the colliculi and a suture passed around the rostral end of the piece containing the lower brainstem and spinal cord. The suture was carefully lifted with a micromanipulator. The medulla, together with approximately 7 to 15 mm of the spinal cord was slowly elevated, the dorsal and ventral roots were cut with a pair of ophthalmic micro-scissors under an operating microscope. Throughout the dissection the cord was continuously bathed with cold modified Krebs-Ringer solution bubbled with 95% O2 /5% CO2 through small tubing. The modified Krebs-Ringer solution replaced all NaCl with sucrose, and the composition was 212.5 mM sucrose, 3.5 mM KCl, 2.4 mM CaCl2, 1.3 mM MgSO4, 26 mM NaHCO3, 1.2 mM KH2PO4 and 10 mM glucose [3].
Great care was taken to avoid tension to the spinal cord while dissecting its attached roots. Approximately a 7 mm length of the cervical spinal cord, including the biggest part (C-5), was removed to a Petri dish circulated with the above cold solution. The cord was carefully freed from remnants of surrounding dura mater and the long ventral and dorsal roots were shortened. The cord was laid into a slot of a chilled agar block (2.5% agar in 0.9% NaCl). The cord was sandwiched by a second chilled agar block and these blocks with the spinal cord were fixed on the stage in the chamber set on a slicer. The cord was sectioned transversely at 400 to 450 µm. Slices were incubated for about one hour in the oxygenated modified Krebs-Ringer solution described above at 33°C. Slices were then transferred to normal Krebs-Ringer solution (125 mM NaCl, 3.5 mM KCl, 2.4 mM CaCl2, 1.3 mM MgSO4, 26 mM NaHCO3, 1.2 mM KH2PO4 and 10 mM glucose) and incubated for at least an additional one hour.
I Electrophysiological Measurements
We made cervical slices from mice ranging in age from post-natal day (PD) 2 to PD350 and identified motor neurons by antidromic stimulation of ventral root or by local stimulation. We measured the membrane resistance by application of small hyperpolarizing and depolarizing pulses of current (less than 20 mV and 10 mV, respectively) through the micro-electrode.
Recordings were carried out in the submerged recording chamber perfused with normal Krebs-Ringer solution circulating at about 5 ml/min at 32°C. Drugs (NMDA, AMPA, KA) were perfused with normal Ringer solution. The recording chamber was small, so that the Ringer solution in the chamber was replaced within 50 sec. Electrical membrane properties of motor neurons were measured in the slice preparations by using conventional glass microelectrodes connected to a DC amplifier (Neuro Data) with a bridge circuit. Intracellular fine glass microelectrodes (100-150 MΩ) were made from tubing (OD; 1.2 mm, ID; 0.6 mm) using a Fleming-Brown Micropipette Puller. The microelectrode was filled with 3 M K acetate and keep for up to one week in a refrigerator in a moisture bottle that was sealed. This procedure reduces the changes in resistance of electrodes with time.
II Morphological Study
For morphological analysis, Lucifer yellow CH (Sigma, 10% in distilled water) was injected into motor neurons in slices through a special recording electrode made from tubing with an OD of 1.5 mm and an ID of 0.9 mm and an input resistance of 30-50 MΩ by application of 2 nA negative current pulses of 250 ms duration at 2 Hz for 1.5-2 min.
Results
Figure 1A shows the morphology of a cervical motor neuron and the placement of the microelectrode for measurement of the membrane potential and resistance. The measurement of the membrane resistance is shown in (Figure 1B). Figure 1C shows the I-V curve, the slope of which is the measure of membrane resistance. Figure 2 shows a histogram of membrane potential (Figure 2A) and resistance (Figure 2B) of cervical motor neurons of various ages. There is little change in membrane potential with age except that it is was slightly higher at PD2. However, the membrane resistance clearly increased with age. This is despite the increase in cell size with growth, which would be expected to result in reduced input resistance if nothing else had changed. Figure 3 shows fluorescence photomicrographs of motor neurons filled with Lucifer Yellow from PD2, PD14, and PD150 mice. At PD2, the neuron shows many fine dendrites. At PD14 many of the small dendrites have disappeared. It is likely that two motor neurons were labeled in this photo as indicated by the arrows. At PD150 there is a single neuron that has a long, thin dendrite. The photograph at the lower right shows an enlarged section and the beading or blebbing observed in dendrites (arrows).
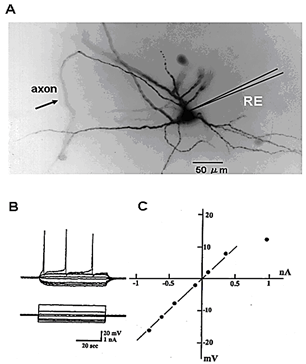
Figure 1: A) Structure of cervical motor neurons with intracellular injection of Lucifer Yellow. B) The methods of recording membrane and procedure of measuring membrane resistance. C) Membrane potential changes (upper traces) induced by outward and inward current (lower traces). The current-voltage (I-V) curve.
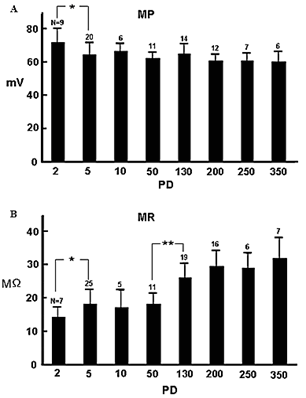
Figure 2: Histogram of membrane A) potentials and B) resistances. Ages range from PD2 to PD350. The PD2 group includes PD1 to PD3; the PD5 group includes PD4 to PD6’ the PD10 group includes PD8 to PD12; the PD50 group include PD40 to PD70; the PD130 group include PD110 to PD150; the PD200 group includes PD180 to PD220; the PD300 group includes PD280 to PD310 and the PD 350 group includes PD340 to PD360. The number (n) of each bar graph is the numbers of recorded neurons. Standard deviation for (MP) * p < 0.017; for (MR) * P < 0.013, ** p < 0.004.
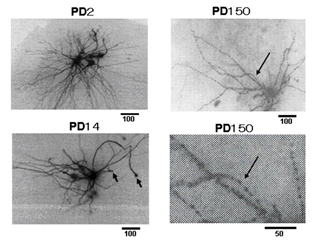
Figure 3: Morphological observation. Lucifer yellow CH was injected into motor neurons in slices prepared from PD2, PD14 and PD150 mice. Arrowheads in the PD14 cell show the cut end of axons. An arrowhead near the cell body may be a collateral axon to an interneuron. The lower picture of PD150 is a magnified view of the site in the upper picture (around the long arrow) showing blebbing.
Figure 4A shows typical age-related changes induced by perfusion of NMDA (10-5 M), KA (10-5 M), and AMPA (10-5 M). Responses were recorded from motor neurons in slices prepared from animals at PD2, PD130, and PD300, where the slices were perfused with the drugs for 3 minutes. Neurons at PD130 and PD300 were insensitive to NMDA. Figure 4B shows a histogram of the peak depolarization by these amino acids. The depolarization decreases with aging, but the excitability increases. Figure 5 shows age-related activity changes in response to AMPA (10-5 M) of motor neurons between PD2 to PD290. The arrow in the beginning under each trace indicates the onset of the neurotransmitter perfusion and the later arrow when the perfusion was returned to normal Ringer solution. Figure 5B shows a histogram of the peak membrane depolarization evoked by bath application of AMPA. The depolarization decreases with age, but the excitability increases.

Figure 4: Age related activity change by NMDA (10-5 M), KA (10-5 M) and AMPA (10-5 M). A) Typical time course of induced by perfused transmitters. Responses were recorded from motor neurons in slices prepared from PD2, PD130 and PD300 animals after a 3-minute amino acids perfusion. Neurons of PD130 and PD300 were insensitive to NMDA. B) Histogram of depolarized peak membrane potential by those amino acids. Data of group PD2 were recorded from PD1 to PD4; the group PD130 includes cells from PD120-PD140 and the PD300 group includes cells from PC290 to PD310. Standard deviation: * p < 0.03, ** p < 0.01, *** p <0.0004, **** p < 0.02.
Figure 6 shows recovery from depolarization after bath application of NMDA and AMPA. Time to recovery increased with age and was longer for KA than for NMDA and AMPA, which took several minutes. Therefore, the subsequent transmitter application after the previous dosage was delayed for this experiment for at least five minutes. Figure 6A1 shows intracellular responses obtained from a single motor neuron of the neonatal mouse (PD5) to bath application of NMDA (a) and AMPA (b). Figure 6A2 shows the I-V curve from the conventional method from a neuron in (Figure 6A1). The triangles (CONT) show the membrane resistance before bath application of NMDA and AMPA. The squares show the resistance after the recovery of the NMDA response and the circles show the recovery to the control level after AMPA. Thus, in the neonatal mouse motor neuron there is no residual change in membrane resistance after perfusion of excitatory amino acid agonists. However, in the aged motor neuron, response to bath application of AMPA (Figure 6B1) and most of the increased membrane resistance did not recover to the original level (Figure 6B2). Similarly, bath application of KA caused depolarization that lasted for a long time (Figure 6C1) and most of the increased membrane resistance did not recover to the original level (Figure 6C2). Figure 6C4 is a histogram of the change of the membrane resistance after bath application of KA.

Figure 5: Age related potential change by 10-5 M AMPA perfusion. A) Typical potential change by 3 min perfusion. Onset and out were indicated by arrows. B) Histogram of peak depolarizing membrane potential. Data for group PD2 were included from PD2 and PD3; the PD5 group includes cells from PD4 to PD6, the PD10 group includes cells from PD7 to PD11; the PD50 group includes cells from PD50 and 52PD; the PD120 group includes cells from PD110 to PD125 and the PD200 group includes cells from PD190, PD200 and PD202. Numbers on the bars show the number of neurons. * No significant, ** p < 0.05, *** p < 0.04.

Figure 6: Typical figures of residual effects of perfused amino acids (10-5 M NMDA, 10-5 M AMPA and 10-6 M KA). A1) Responses (a1 and a2) were recorded from a single neuron by 3 min perfusion of NMDA and AMPA (5PD). Response (b) was recorded 15 min after (a). A2) I-V curve (NMDA; closed square, CONT; closed triangle, AMPA; closed circle). B1) Response to 3 min perfusion of AMPA (PD122). B2) I-V curve recorded before perfusion of AMPA (closed circle) and after 25 min (closed triangle). C1) Response to 3 min perfusion of KA (PD122). C2) I-V curve (KA); closed circle, CONT; closed triangle, (KA). C4) % histogram of increased resistance by KA perfusion. The number indicates the number of recorded neurons.
Discussion
The mouse spinal cord slice has significant potential for the study of healthy and diseased motor neurons with aging. We have had limited success in the preparation of spinal slices from rats more than PD100 (less than 50%) due to it being hard to remove the vertebra without damaging the spinal cord, and it is not easy to remove remnants of the surrounding dura mater. However, because mice are smaller, it is easy to cool the spinal cord to suppress metabolism, and the vertebra surrounding the spinal cord is not as hard as in the rat. Even in an aged mouse, it is not so difficult to take out the spinal cord without damage and obtain intracellular recordings with normal membrane potential and resistance for a relatively long time.
There were no major differences in membrane potentials from PD5 to PD350. The membrane potential at PD2 was somewhat greater, which may reflect development and the smaller cell size. The dendritic configuration at this stage is much more extensive, as shown in (Figure 3) [4]. Membrane resistance, however, increases with age. By retrograde-labeling with injections of cholera toxin, it has been shown that the number and size of primary dendrites of hypoglossal motor neurons decreases significantly with age [5]. The input resistance of motor neurons also increases in old cats with no change in resting membrane potential or spike amplitude [6]. The increase in input resistance appears to depend upon both an increase in specific membrane resistance and a decrease in total cell surface area [7]. It is difficult or impossible to determine specific membrane resistance measurements in dendrites. For example, the dendritic architecture is totally different between hippocampal CA3 and dentate neurons, but the membrane resistance of the cells is almost the same [8]. So, it is thought that the change of the membrane resistance of the aged neuron depends on the cell membrane itself. As shown in (Figure 4), the electronic potential produced by passing current decreases with aging, which might be related to a reduction in membrane capacitance. It has been reported that membrane capacitance of adult rat dentate gyrus neurons decreases with age [9].
The depolarization resulting from activation of receptors for the excitatory amino acids, NMDA, AMPA, and KA, also decreased with age, but excitability does not appear to change. This implies that the threshold for action potential generation decreases. This is seen in the effects of AMPA in (Figure 5). This must reflect a structural change of the membrane ion channel because a change of resting membrane potential was not seen. As shown in (Figure 6), the other change with aging is the time of recovery after excitation by the transmitter. There is a much more rapid recovery of both membrane potential and resistance in the young animal, which may reflect a greater ability to restore ionic concentration gradients quickly.
There was a complete loss of response to NMDA in older motor neurons. This has also been seen in the hippocampus, striatum, and frontal cortex [10]. This is of particular interest because NMDA receptors have a crucial role in neuronal plasticity, which decreases with age [11]. We have previously shown that NMDA receptors are lost in rat motor neurons undergoing death [4]. There may also be changes in the distribution of inhibitory transmitter receptors for GABA and glycine, but we have not investigated these receptors in the present study [12]. There is also an increase in dendritic blebbing seen in the older animals. The functional implications of blebbing are unclear but may influence neural transmission both with aging and in diseases such as ALS.
Conclusion
In mouse cervical motor neurons, membrane potential does not change significantly with age after PD2, but membrane resistance increases. The extent of the dendritic tree is slightly reduced in older animals, and the speed of recovery from excitatory amino acid-induced depolarization is decreased.
Article Info
Article Type
Research ArticlePublication history
Received: Mon 16, Aug 2021Accepted: Tue 31, Aug 2021
Published: Thu 30, Sep 2021
Copyright
© 2023 David O. Carpenter. This is an open-access article distributed under the terms of the Creative Commons Attribution License, which permits unrestricted use, distribution, and reproduction in any medium, provided the original author and source are credited. Hosting by Science Repository.DOI: 10.31487/j.JBN.2021.01.02
Figures & Tables
References
1.
Huai J, Zhang Z (2019) Structural Properties and
Interaction Partners of Familial ALS-Associated SOD1 Mutants. Front Neurol
10: 527. [Crossref]
2.
Rosen DR, Siddique T, Patterson D, Figlewicz DA,
Sapp P et al. (1993) Mutations in Cu/Zn superoxide dismutase gene are
associated with familial amyotrophic lateral sclerosis. Nature 362:
59-62. [Crossref]
3.
Hori N, Tan Y, Strominger NL, Carpenter DO (2001)
Intracellular activity of rat spinal cord motoneurons in slices. J Neurosci
Methods 112: 185-191. [Crossref]
4.
Hori N, Tan Y, Strominger NL, Carpenter DO (2002)
Rat motoneuron cell death in development correlates with loss of
N-methyl-D-aspartate receptors. Neurosci Lett 330: 131-134. [Crossref]
5.
Schwarz EC, Thompson JM, Connor NP, Behan M (2009)
The effects of aging on hypoglossal motoneurons in rats. Dysphagia 24:
40-48. [Crossref]
6.
Chase MH, Morales FR, Boxer PA, Fung SJ (1985) Aging
of motoneurons and synaptic processes in the cat. Exp Neurol 90:
471-478. [Crossref]
7.
Liu RH, Yamuy J, Engelhardt JK, Xi MC, Morales FR et
al. (1996) Cell size and geometry of spinal cord motoneurons in the adult cat
following the intramuscular injection of adriamycin: comparison with data from
aged cats. Brain Res 738: 121-130. [Crossref]
8.
Biscoe TJ, Duchen MR (1985) An intracellular study
of dentate, CA1 and CA3 neurones in the mouse hippocampal slice. Q J Exp
Physiol 70: 189-202. [Crossref]
9.
Ambrogini P, Lattanzi D, Ciuffoli S, Agostini D, Bertini L et al. (2004) Morpho-functional characterization of neuronal cells at different
stages of maturation in granule cell layer of adult rat dentate gyrus. Brain
Res 1017: 21-31. [Crossref]
10. Castorina M, Ambrosini AM, Pacific L, Ramacci MT, Angelucci L (1994)
Age-dependent loss of NMDA receptors in hippocampus, striatum, and frontal
cortex of the rat: prevention by acetyl-L-carnitine. Neurochem Res 19:
795-798. [Crossref]
11. Martin SJ, Grimwood PD, Morris RG (2000) Synaptic plasticity and memory: an evaluation of the hypothesis. Annu Rev Neurosci 23: 649-711. [Crossref]
12. Caspary DM, Milbrandt JC, Helfert RH (1995) Central auditory aging: GABA changes in the inferior colliculus. Exp Gerontol 30: 349-360. [Crossref]