Journals
p53 Binding Loci Database (p53BLD): a repository for the genome-wide binding loci of human TP53
A B S T R A C T
Background
Recent advances in ChIP-seq technologies have led to the identification of thousands of TP53 binding loci in various cell types, providing unmatched opportunities for analysis and comparison of the TP53 genome-wide binding patterns under different experimental conditions. These ChIP-seq datasets provide valuable resources for studying the function of TP53. However, there are currently no databases available for easily comparing and analyzing TP53 genome-wide binding patterns derived from different cell lines. Moreover, the TP53 ChIP-seq datasets are scattered among different papers, so extensive work is required to collect and process them for further analysis.
Description
To solve these problems, we comprehensively collected 13 publicly available TP53 ChIP-seq datasets derived from various cell lines. We re-mapped these 13 ChIP-seq datasets to the most updated reference human genome hg38 and identified the binding peaks (regions with significant enrichment of TP53 binding) and the target genes of TP53 in the human genome using the same data processing pipeline. Note that processing these 13 ChIP-seq datasets using the same pipeline is very crucial because it makes comparing the identified peaks and target genes of TP53 from different datasets possible. Finally, we developed a web-based platform (called the p53BLD), which provides a browse mode to visualize the binding loci of TP53 in the genome and a search mode to retrieve genes whose promoters are bound by TP53. The search mode is very powerful. Users can apply union, intersect, and/or difference operations on the 13 ChIP-seq datasets to generate a list of TP53 binding target genes that satisfies the users’ specifications. The generated gene list can then be downloaded for further analysis. Therefore, the p53BLD can also be regarded as a discovery tool that helps users to generate interesting gene lists for studying TP53.
Conclusions
Here we presented the first p53 Binding Loci Database (p53BLD). In the case study, we showed that using p53BLD can identify novel TP53 binding targets (KAT6A and KMT2A) in specific cancer cell lines. We believe that p53BLD is a useful resource for studying the function of TP53 in different cancer cell lines. P53BLD is available online at link1/, link2/, or link3/
Keywords
Human,TP53,p53,ChIP-seq,binding targets,binding loci,database
Background
The importance of TP53 is evidenced by the fact that TP53 is the gene most commonly found to be mutated in cancers [1, 2]. The tumor suppressor TP53 responds to numerous stress stimuli, including DNA damage and hypoxia [3, 4]. It acts as a transcription factor and regulates the expression of a variety of genes, leading to enhanced DNA repair, control of the cell cycle, and apoptosis [5]. TP53 contains a DNA binding domain that binds to a specific consensus sequence RRRCWWGYYY (R=A/G, W=A/T, Y=C/T) [6]. The sequencing technologies combined with chromatin immunoprecipitation (ChIP-seq) have been used to identify TP53 binding loci and have revealed that more than 3000 genes are bound by TP53 in their promoter regions [7-12]. While the majority of these genes were identified in some cell lines, only about 60 were identified as common targets [13]. It remains unclear how TP53 discriminates among these binding targets in different cell types, especially in terms of the binding differences between normal cells and cancer cells.
So far, nearly 2000 different single missense mutations in TP53 have been reported in tumor cells [14]. Mutations in the DNA binding domain of TP53, such as R273H, R248Q, R248W, and R249S are associated with more aggressive malignancies and could confer novel phenotypes in vivo, including an increased metastatic capacity and resistance to chemotherapies [15, 16]. Specific TP53 mutants which acquire these phenotypes are generally referred to as gain-of-function (GOF) mutants. As TP53 binds to the specific consensus sequence, it remains unclear how these GOF mutants change the binding specificity and target genes to promote tumorigenesis.
Recently, the number of genome-wide ChIP-seq datasets of TP53 derived from different normal and cancer cell lines harboring the wild-type or mutant GOF TP53 has rapidly increased [7-12]. These datasets provide unmatched opportunities for analysis and comparison of the genome-wide TP53 binding patterns under different experimental conditions and in different cell types. However, several issues needed to be solved before these ChIP-seq datasets can be integrated to study the function of p53. First, several ChIP-seq datasets only provide raw reads data. Neither TP53 binding loci nor TP53 target genes are available. Second, most ChIP-seq datasets were mapped to the old reference human genome hg19 but not the most updated hg38. Third, different ChIP-seq datasets were processed using different pipelines in the original papers, so the identified TP53 binding loci or target genes from different ChIP-seq datasets cannot be compared. Fourth, there are currently no databases available for easily comparing and analyzing TP53 genome-wide binding patterns derived from different cell lines. The existing p53 databases, such as the TP53 website [14], are focused on collections of TP53 mutations derived from various cancer samples and phenotypes related to these mutations.
To solve all these problems, it is urgent to provide the TP53 research community a database which comprehensively collects the publicly available TP53 ChIP-seq datasets and processes all of them using the same pipeline for further analysis and comparison. Therefore, in this study, we developed a novel database of the genome-wide binding loci of human TP53, called the p53 Binding Loci Database (p53BLD). We collected 13 publicly available TP53 ChIP-seq datasets derived from different normal and cancer cell lines harboring either the wild type or mutant GOF TP53 [7-12]. As these published ChIP-seq datasets were originally mapped to the earlier reference human genome hg18 (2006 assembly), in order to keep up with the current reference human genome, we re-mapped these ChIP-seq datasets to the most updated reference human genome hg38 (2013 assembly) and identified the binding peaks (regions with significant enrichment of TP53 binding) and the target genes of TP53 in the human genome using the same data processing pipeline. Note that processing different ChIP-seq datasets using the same pipeline is very crucial because it makes comparing the identified peaks and target genes of TP53 from different datasets possible. The p53BLD provides a browse mode to visualize the binding loci of TP53 in the genome and a search mode to retrieve genes whose promoters are bound by TP53. The search mode is very powerful. Users can apply union, intersect, and/or difference operations on the 13 ChIP-seq datasets to generate a list of TP53 binding target genes that satisfies the users’ specifications. The generated gene list can then be downloaded for further analysis. Therefore, the p53BLD can also be regarded as a discovery tool that helps users to generate interesting gene lists for studying TP53.
Construction & contents
Collection of 13 human TP53 ChIP-seq datasets
We comprehensively collected 13 human TP53 ChIP-seq datasets from the Gene Expression Omnibus (GEO) [7-12]. As shown in (Table 1), the collected human TP53 ChIP-seq datasets include two normal cell lines (neonatal foreskin keratinocytes and human lung fibroblast IMR90), four cancer cell lines harboring the wild type TP53 (colon cancer cell line HCT116, osteosarcoma cell line U2OS, and breast cancer cell lines MCF7 and MDA-MB-175VII), and four cancer cell lines harboring the mutant GOF TP53 (Li-Fraumeni fibroblast MDA-H087 and three breast cancer cell lines, namely, HCC70, BT-549 and MDA-MB-468).
ChIP-seq data processing pipeline
Several tools were used to process the ChIP-seq data downloaded from the GEO. First, SRAtoolkit.2.3.4 (https://www.ncbi.nlm.nih.gov/sra/docs/toolkitsoft/) was used to transform the ChIP-seq reads from sra format into fastq format. Second, Bowtie.1.0.0 (https://sourceforge.net/projects/bowtie-bio/files/bowtie/1.0.0/) was used to map the read data to the reference human genome (hg38 downloaded from UCSC) to generate the map file. Third, Homer v4.9 (http://homer.ucsd.edu/homer/) was used to transform the map file into the bedgraph file and to generate a list of binding peaks (regions with significant enrichment of TP53 binding). The bedgraph file contains the density of reads at each nucleotide in the human genome and the peak list contains all the peak regions in the human genome. For visualization, the PHP GD library was used to implement a genome browser which can show the information contained in the bedgraph file and the peak list.
Peak annotation
Following Smeenk et al.’s definition, we define the promoter region as the transcription start site (TSS) flanking region encompassing core promoters as well as the broader promoter-enhancer region, 10 kb up- or downstream from the TSS [10]. Then a peak in the peak list was annotated to a gene if it overlapped with the promoter region of that gene. The 23666 human genes (GRCh38.p10) which have both an NCBI gene ID and HGNC symbol were downloaded from Ensembl. In this study, the TSS of the longest transcript of a gene was used as the TSS of that gene.
Table 1: The 13 collected human TP53 ChIP-seq datasets
|
Dataset |
GEO accession number |
Cell line |
TP53 |
Treatment |
|
D1 |
Neonatal foreskin keratinocytes |
WT |
None |
|
|
D2 |
Neonatal foreskin keratinocytes |
WT |
Adrimycin |
|
|
D3 |
Neonatal foreskin keratinocytes |
WT |
Cisplatin |
|
|
D4 |
Normal human lung fibroblast (IMR90) |
WT |
5FU |
|
|
D5 |
Colon cancer cell line (HCT116) |
WT |
5FU |
|
|
D6 |
Osteosarcoma cell line (U2OS) |
WT |
Actinomycin D |
|
|
D7 |
Osteosarcoma cell line (U2OS) |
WT |
Etoposide |
|
|
D8 |
Breast cancer cell line (MCF7) |
WT |
None |
|
|
D9 |
GSM1429754 |
Breast cancer cell line (MDA-MB-175VII) |
WT |
None |
|
D10 |
Breast cancer cell line (HCC70) |
R248Q |
None |
|
|
D11 |
Breast cancer cell line (BT-549) |
R249S |
None |
|
|
D12 |
Breast cancer cell line (MDA-MB-468) |
R273H |
None |
|
|
D13 |
Li-Fraumeni fibroblast (MDA-H087) |
R248W |
None |
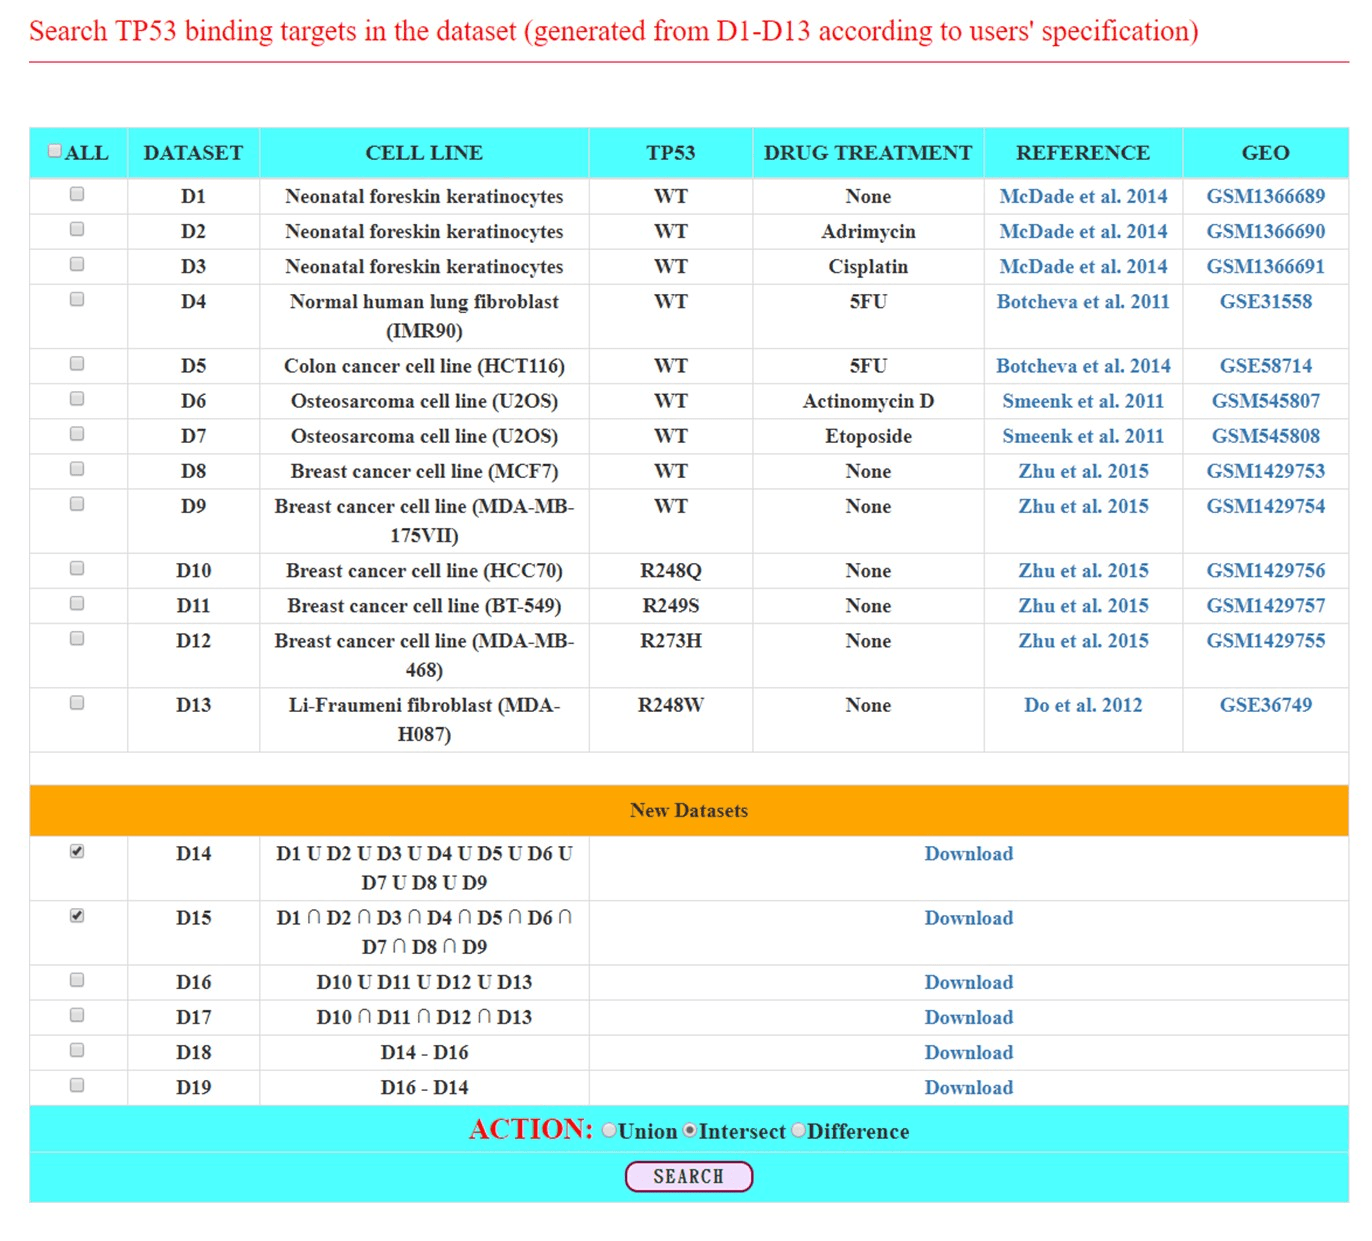
Figure 1: The input page of the search mode
Implementation of the web interface of the p53BLD
The web interface of the p53BLD was constructed using the PHP language with the CodeIgniter MVC framework. The bedgraph files and the peak lists of the 13 ChIP-seq datasets were deposited in MySQL and can be easily downloaded from the download page of p53BLD. Tables were produced by the JavaSscript and feature-rich JavaScript libraries (jQuery and DataTables). Figures were generated using the GD library of PHP.
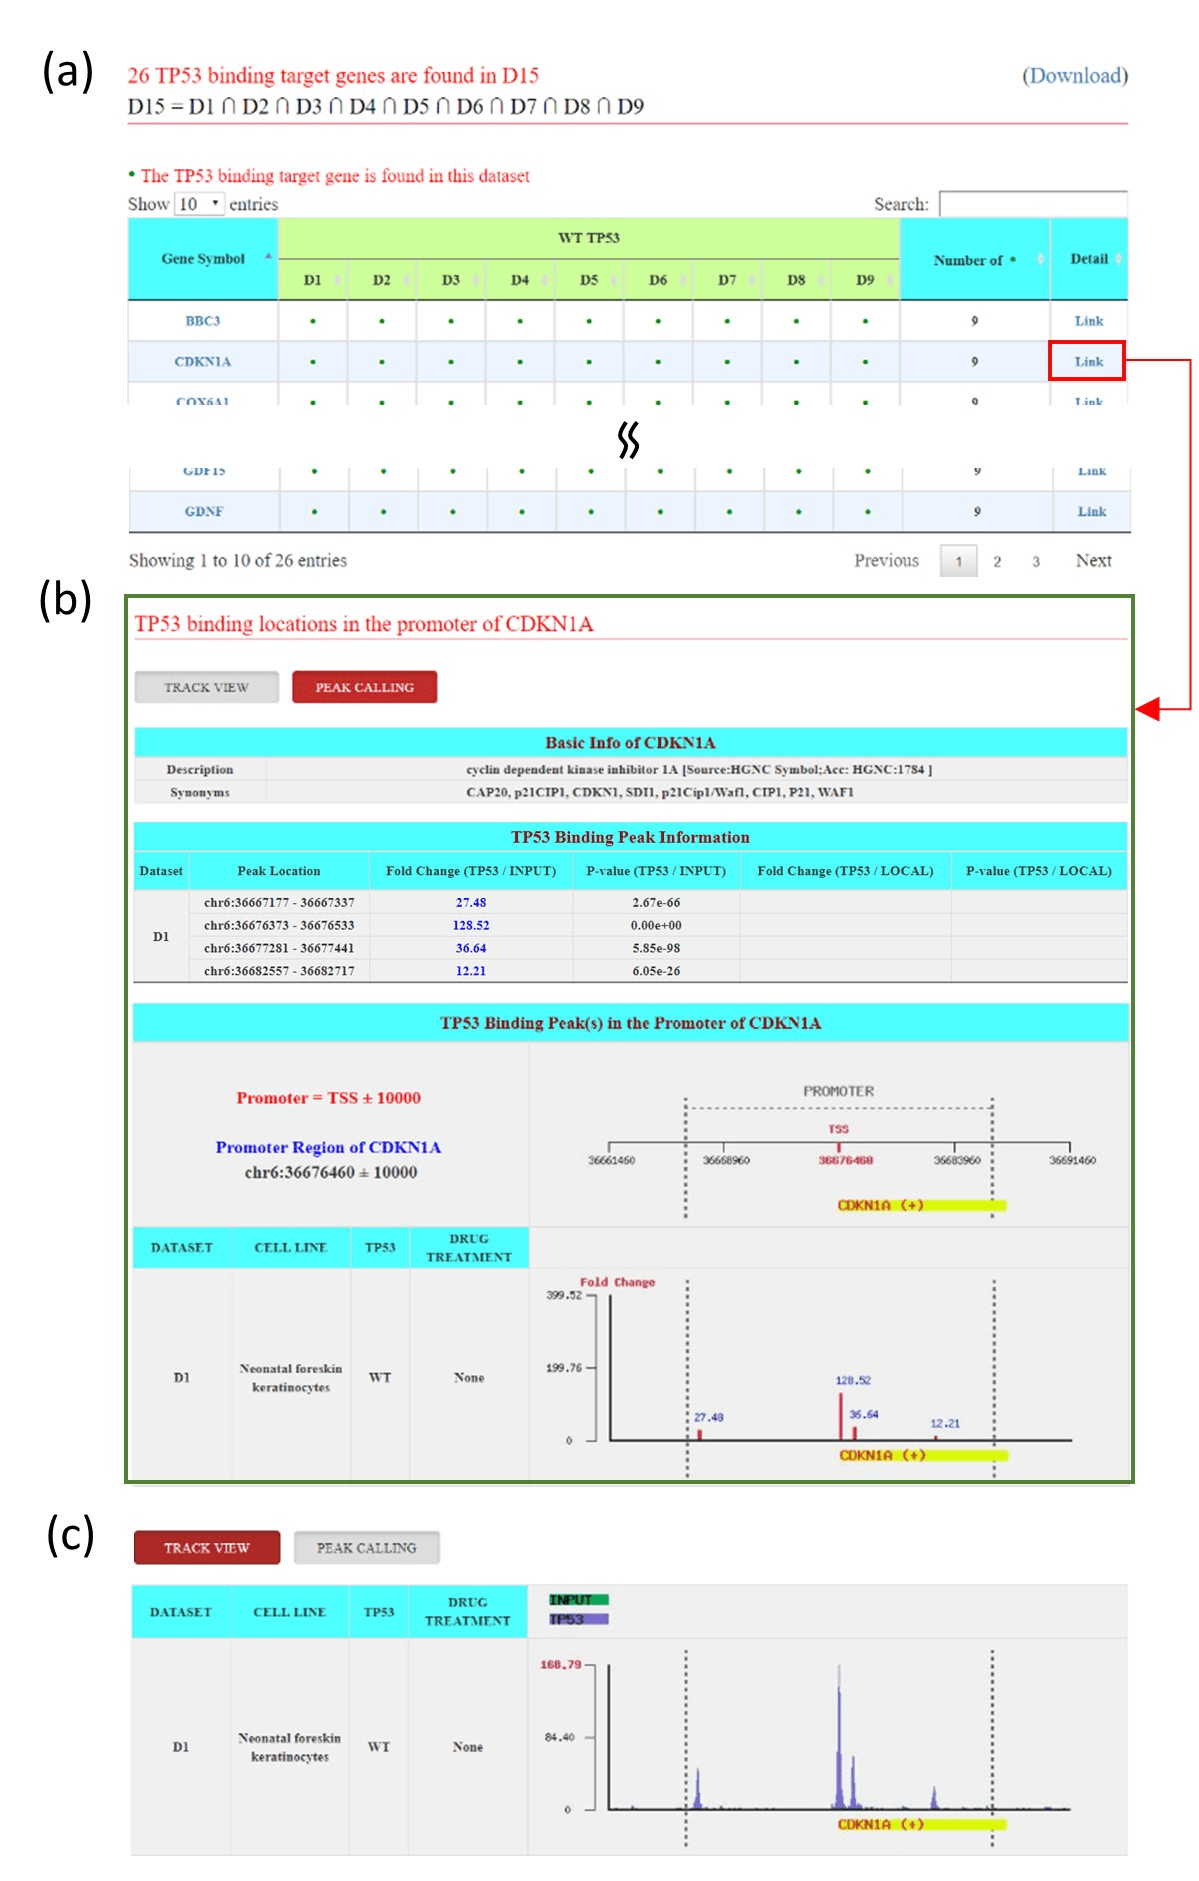
Figure 2: The output page of the search mode (a) The output page contains a list of TP53 binding target genes that satisfy the user’s settings. (b) The peak calling view of CDKN1A. (c) The track view of CDKN1A.
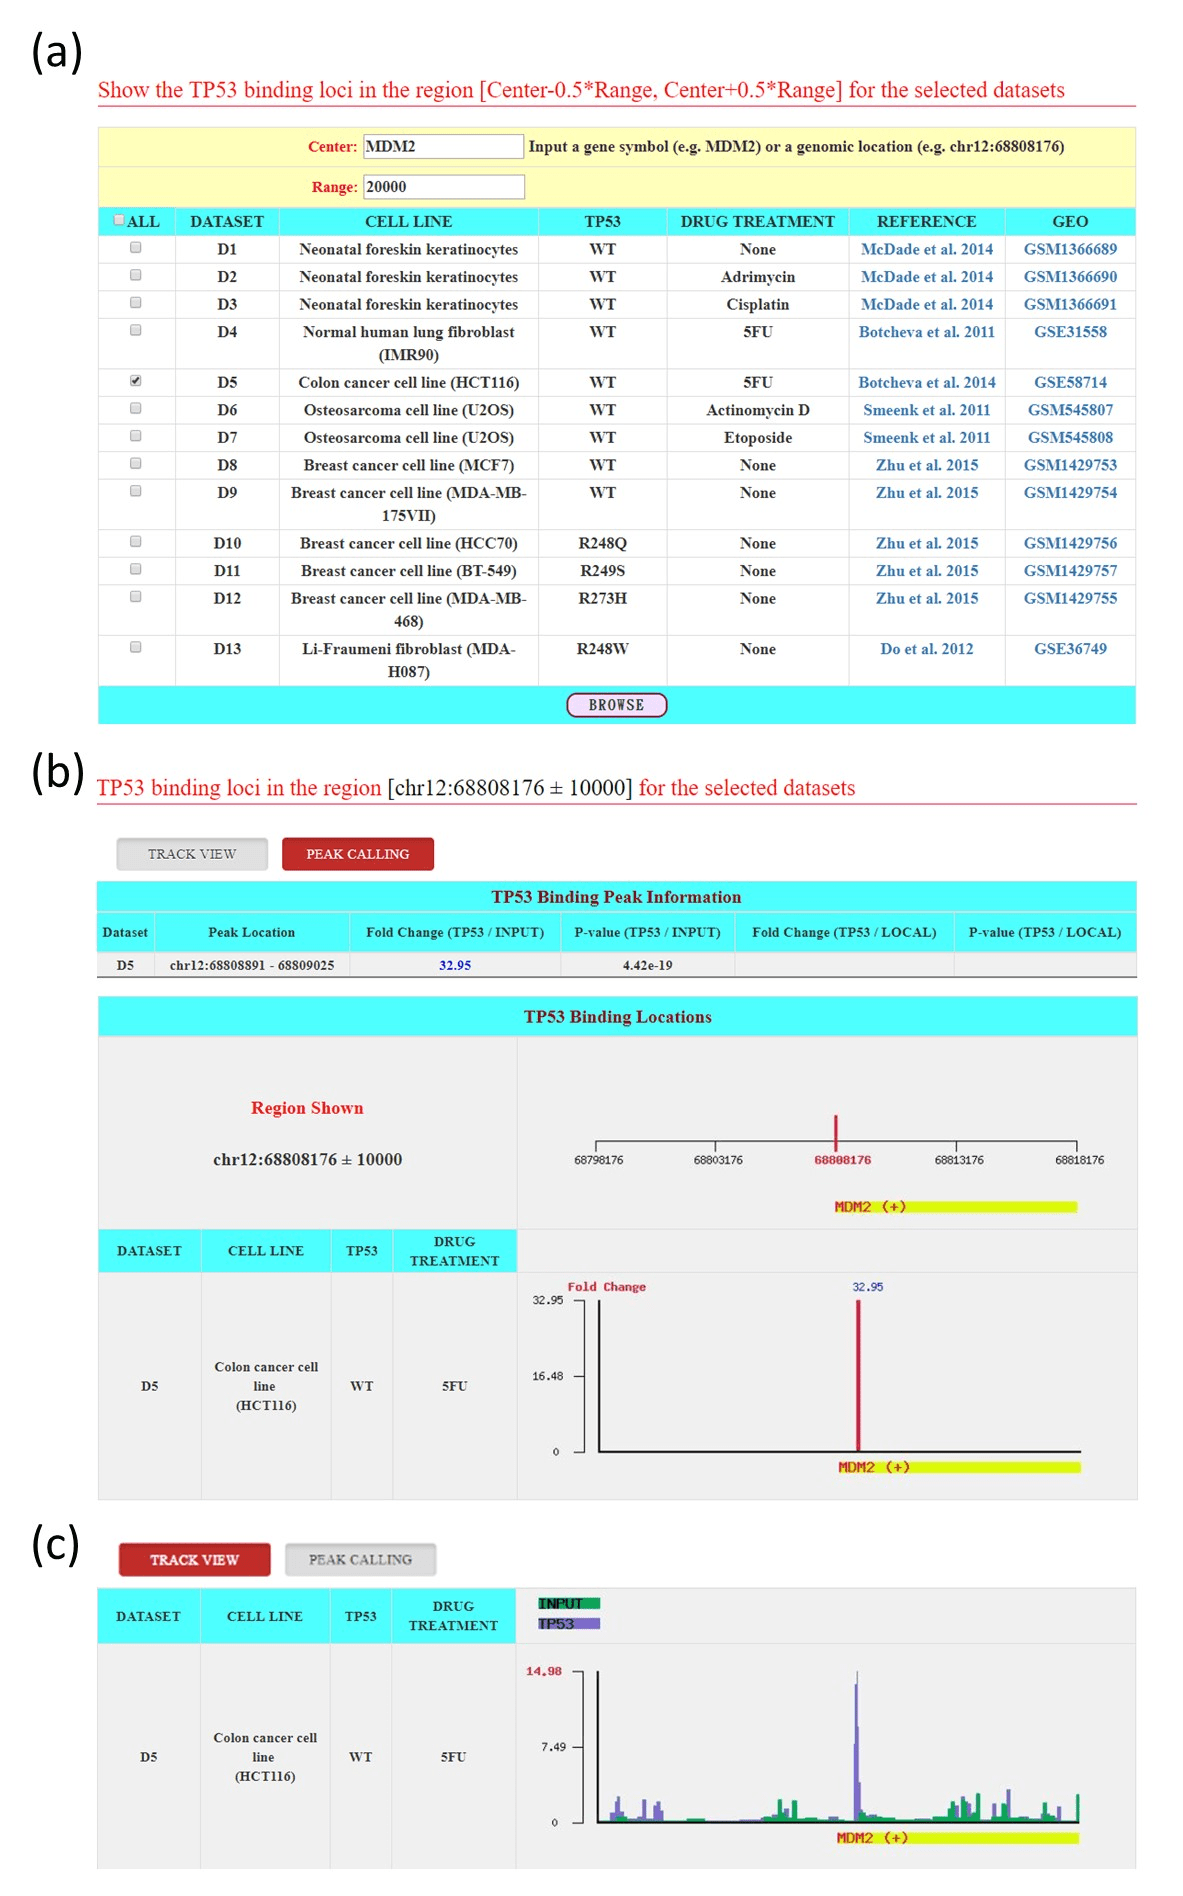
Figure 3: The input and output pages of the browse mode (a) The input page (b) The output page provides the peak calling view of MDM2. (c) The output page provides the track view of MDM2.
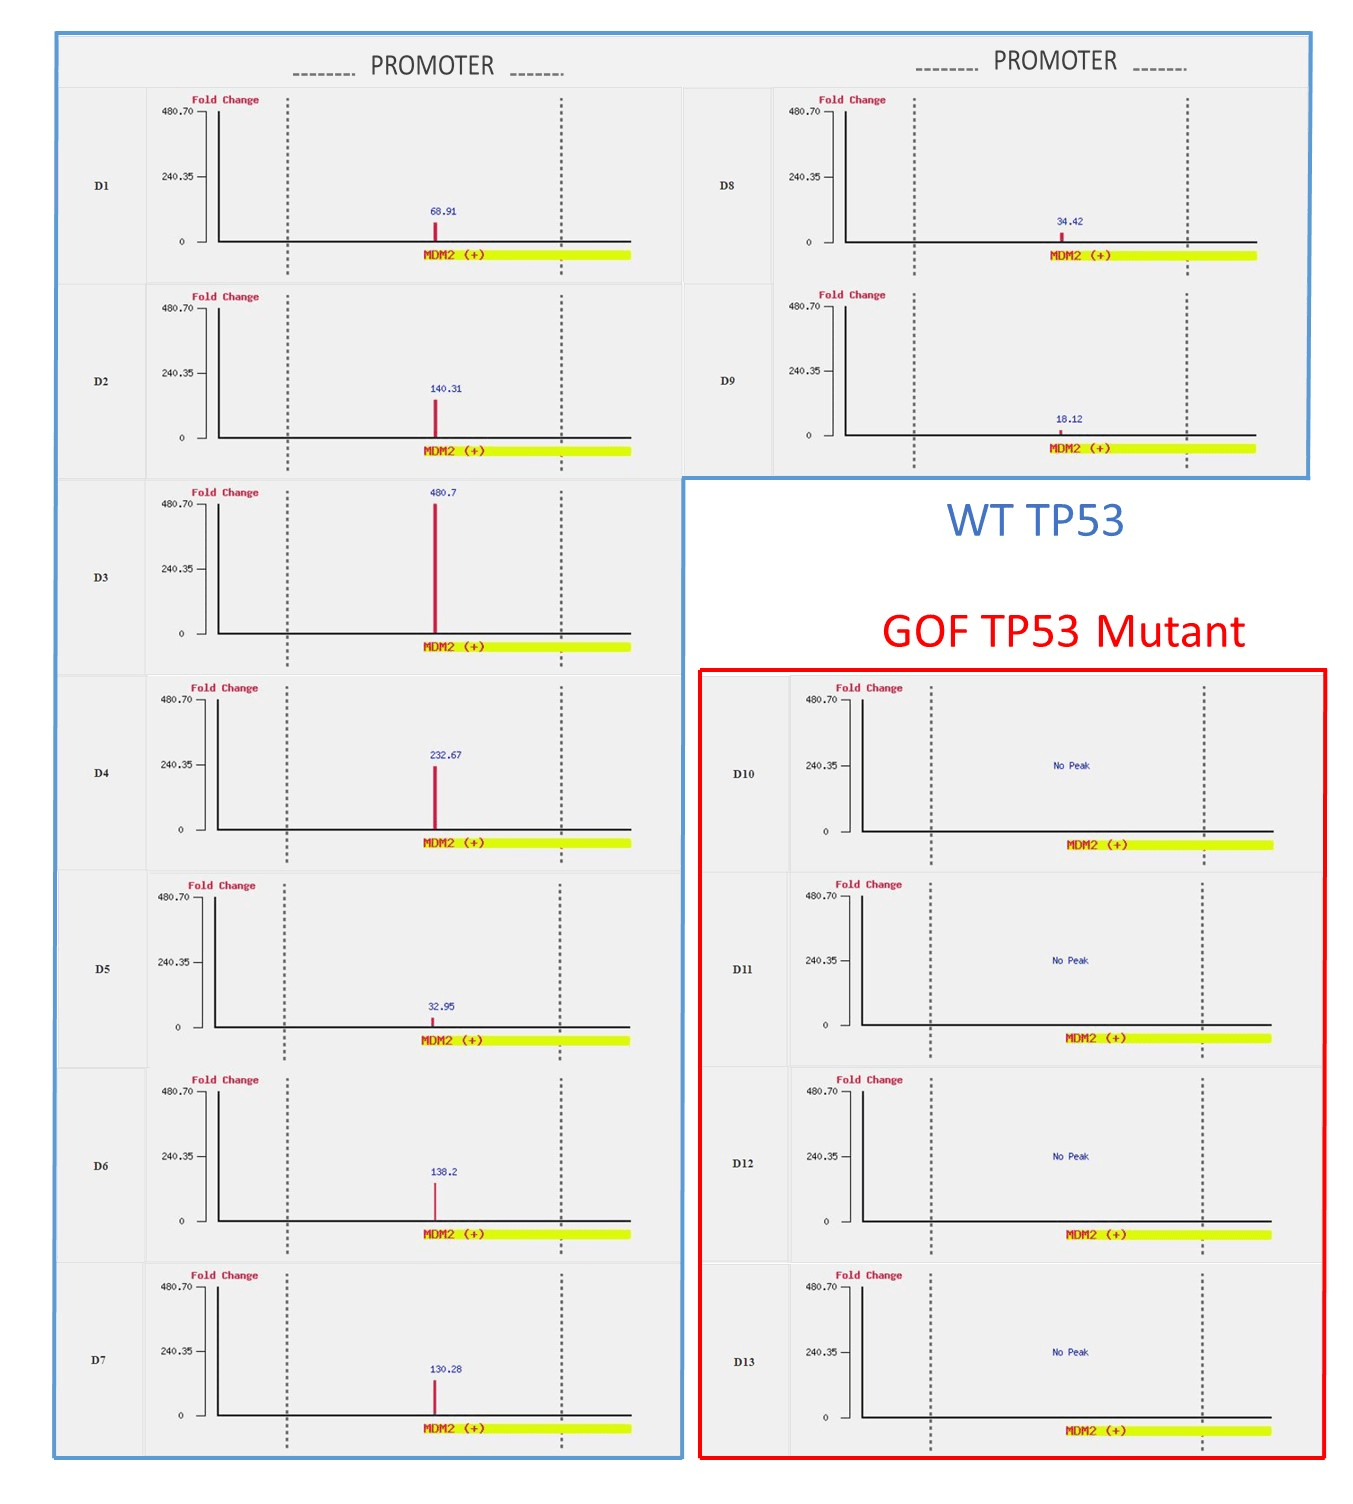
Figure S1: MDM2 is targeted by WT TP53 but not by mutant TP53.
Utility and discussion
Database interface
The p53BLD provides both a search mode and a browse mode. In the search mode, users can survey the TP53 binding target genes derived from different cell lines by selecting the ChIP-seq datasets of interest. Applying the union, intersect, and difference operations, users can identify TP53 binding target genes that occur in at least one dataset, that occur in all datasets, and that are specific to certain datasets, respectively (Figure 1). After submission, the p53BLD returns a result page containing a list of TP53 binding target genes that satisfy the user’s settings (Figure 2a). When clicking the “Detail Link” of a particular gene (e.g., CDKN1A), a result page consisting of two parts (“Peak Calling” and “Track View”) is given. The “Peak Calling” contains the basic information of CDKN1A, including the peaks found in the promoter of CDKN1A with peak locations, peak fold enrichments and p-values for each chosen ChIP-seq dataset (Figure 2b). High peak fold enrichments and low p-values indicate the highly statistical significance of TP53 binding. The “Track View” contains the density of reads at each nucleotide in the promoter of CDKN1A for each chosen ChIP-seq dataset (Figure 2c).
In the browse mode, users have to select the ChIP-seq datasets of interest and specify the “Center” and the “Range” to be shown (Figure 3a). For the “Center” specification, users can input a genomic coordinate (e.g., chr12:68808176) or a gene name (e.g., MDM2) whose TSS coordinate will be used. After that input is submitted, the p53BLD returns a result page containing the locations and fold enrichments of the peaks in the region [Center-0.5*Range, Center+0.5*Range] for each chosen ChIP-seq dataset (“Peak Calling”, Figure 3b) and the density of reads at each nucleotide in the region [Center-0.5*Range, Center+0.5*Range] for each chosen ChIP-seq dataset (“Track View”, Figure 3c).
Case studies
Here we use several case studies to demonstrate that both the search mode and the browse mode of the p53BLD can provide biologically meaningful information. In the search mode, we implemented the union, intersect, and difference operations to help users to identify the TP53 binding target genes that occurred in at least one dataset, that occurred in all datasets, and that are specific to certain datasets, respectively. For example, we surveyed the nine datasets derived from cell lines harboring wild type TP53 by selecting datasets D1 to D9. By using the union operation, we identified 4057 TP53 binding target genes (denoted as the dataset D14 in Figure 1) that occurred in at least one of the nine datasets. By using the intersect operation, we identified 26 genes (denoted as the dataset D15 in Figure 1) that occurred in all nine datasets. While 4057 genes were identified in at least one of the nine datasets, only 26 genes were found in all nine datasets. This indicates that many TP53 binding target genes may be cell type specific and treatment dependent. The 26 common genes in all nine datasets include well-known wild-type TP53 binding target genes related to cell cycle control, apoptosis, and DNA repair, such as CDKN1A, BBC3, DDB2, REV3L, and MDM2 [13].
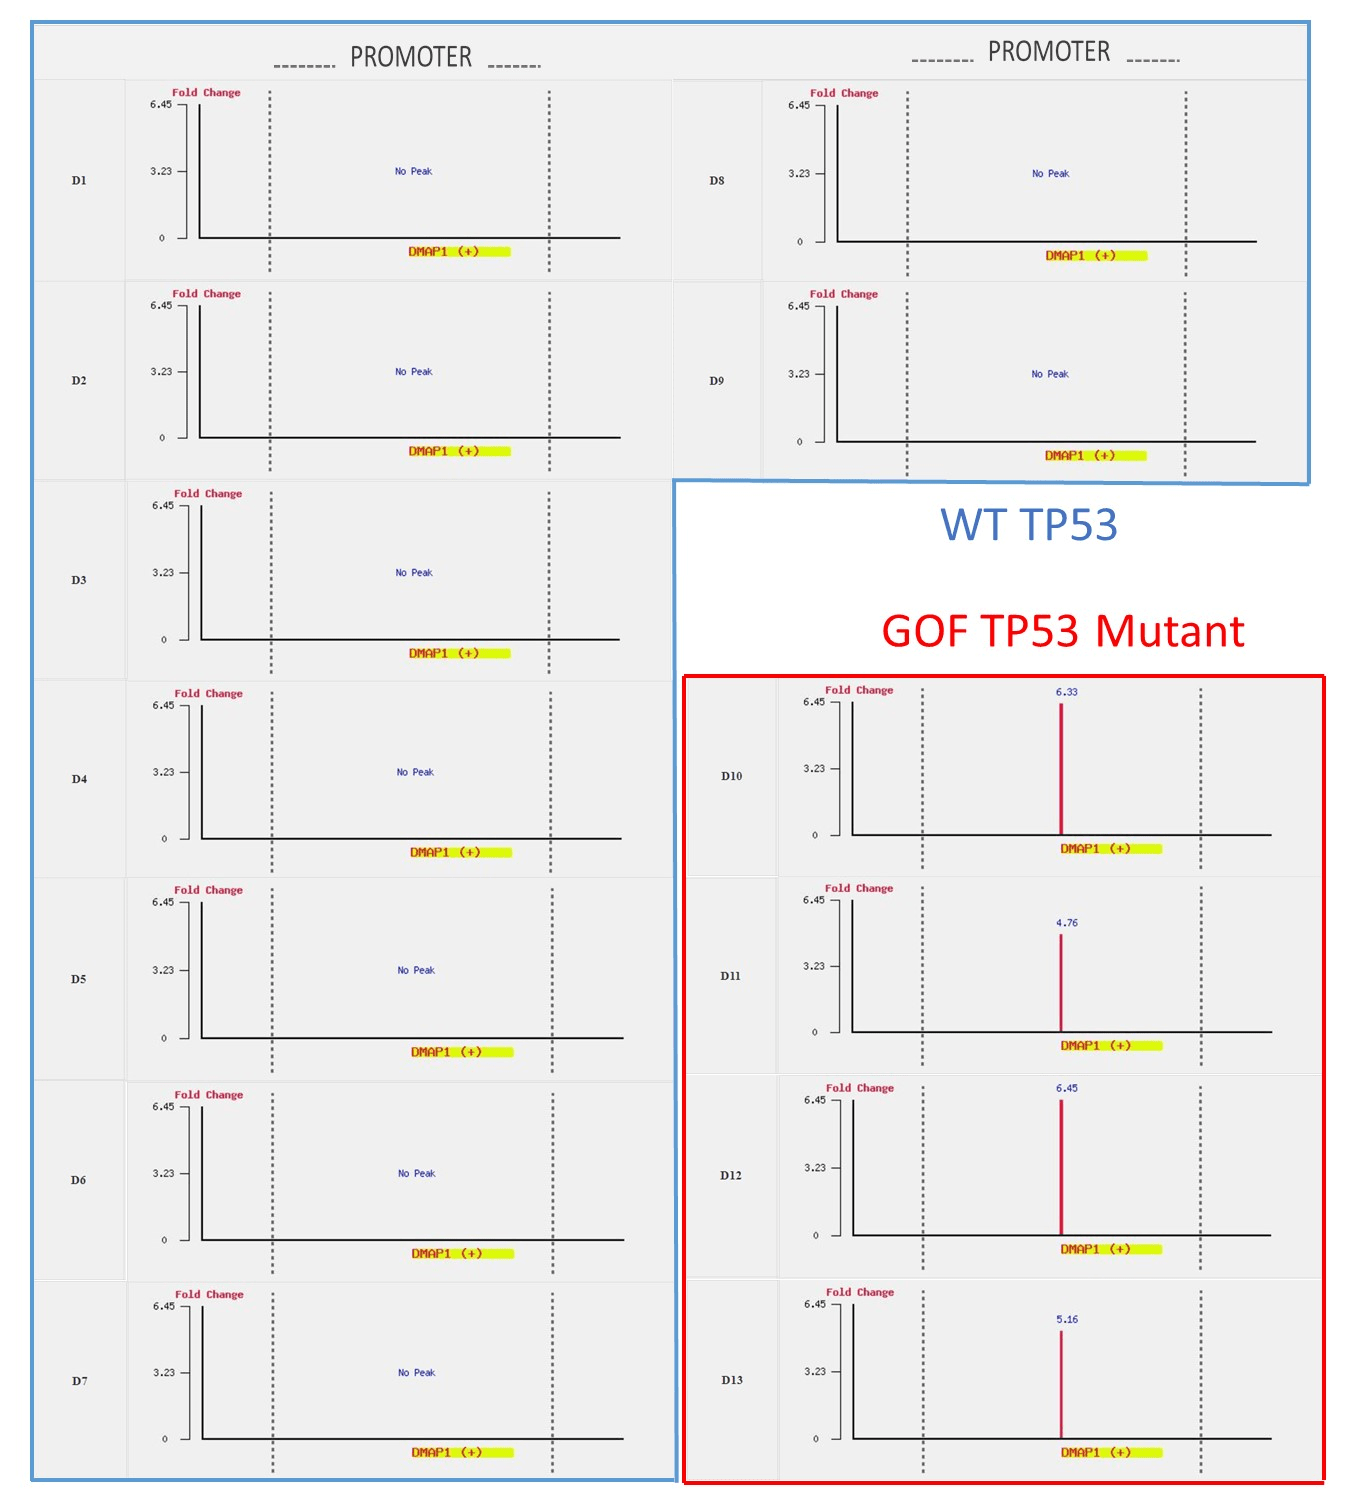
Figure S2: DMAP1 is targeted by mutant TP53 but not by WT TP53.
By contrast, we surveyed the four datasets derived from cancer cell lines harboring different GOF TP53 mutants by selecting datasets D10 to D13. By using the union operation, we identified 6739 genes (denoted as the dataset D16 in Figure 1) that occurred in at least one of the four datasets. By using the intersect operation, only 63 genes (denoted as the dataset D17 in Figure 1) were identified in all of the four datasets. These 63 common genes include several genes related to epigenetic regulation and transcription factors, such as KMT2A, JMJD4, KDM1A, DRAP1, MTF2, GTF3C3, TCEA1, and NFAT5 [13].
The binding patterns of wild type TP53 and mutant GOF TP53 are very different. The differences can be accessed by using the difference operation on the dataset D14 (genes bound by wild type TP53) and the dataset D16 (genes bound by GOF TP53). We found that 2347 genes (denoted as the dataset D18 in Figure 1) were specifically targeted by wild type TP53 but not GOF TP53. The D18 dataset includes well-known wild type TP53 binding target genes related to cell cycle control, apoptosis, and DNA repair, such as BTG2, RRM2B, AEN, XPC, GDF15, and MDM2 [13]. On the other hand, 5029 genes (denoted as the dataset D19 in Figure 1) are specifically targeted by GOF TP53 but not wild type TP53. The D19 dataset includes several genes related to epigenetic regulation and transcription factors, such as JMJD4, KDM1A, DMAP1, ATR, TCEA1, and NFAT5 [13].
These differences in binding patterns can also be accessed in the browser mode. In the browse mode, users can observe the binding patterns of TP53 at a specific gene or a locus, simply by inputting the gene symbol or chromosome position. By selecting all 13 datasets (D1 to D13), users can see some genes (e.g. MDM2, AEN, GDF15, RRM2B, and BTG2) bound by wild type TP53 but not by mutant TP53 (see Figure S1). In contrast, some genes (e.g., JMJD4, KDM1A, DMAP1, ATR, TCEA1, and NFAT5) are bound by mutant TP53 but not by WT TP53 (see Figure S2).
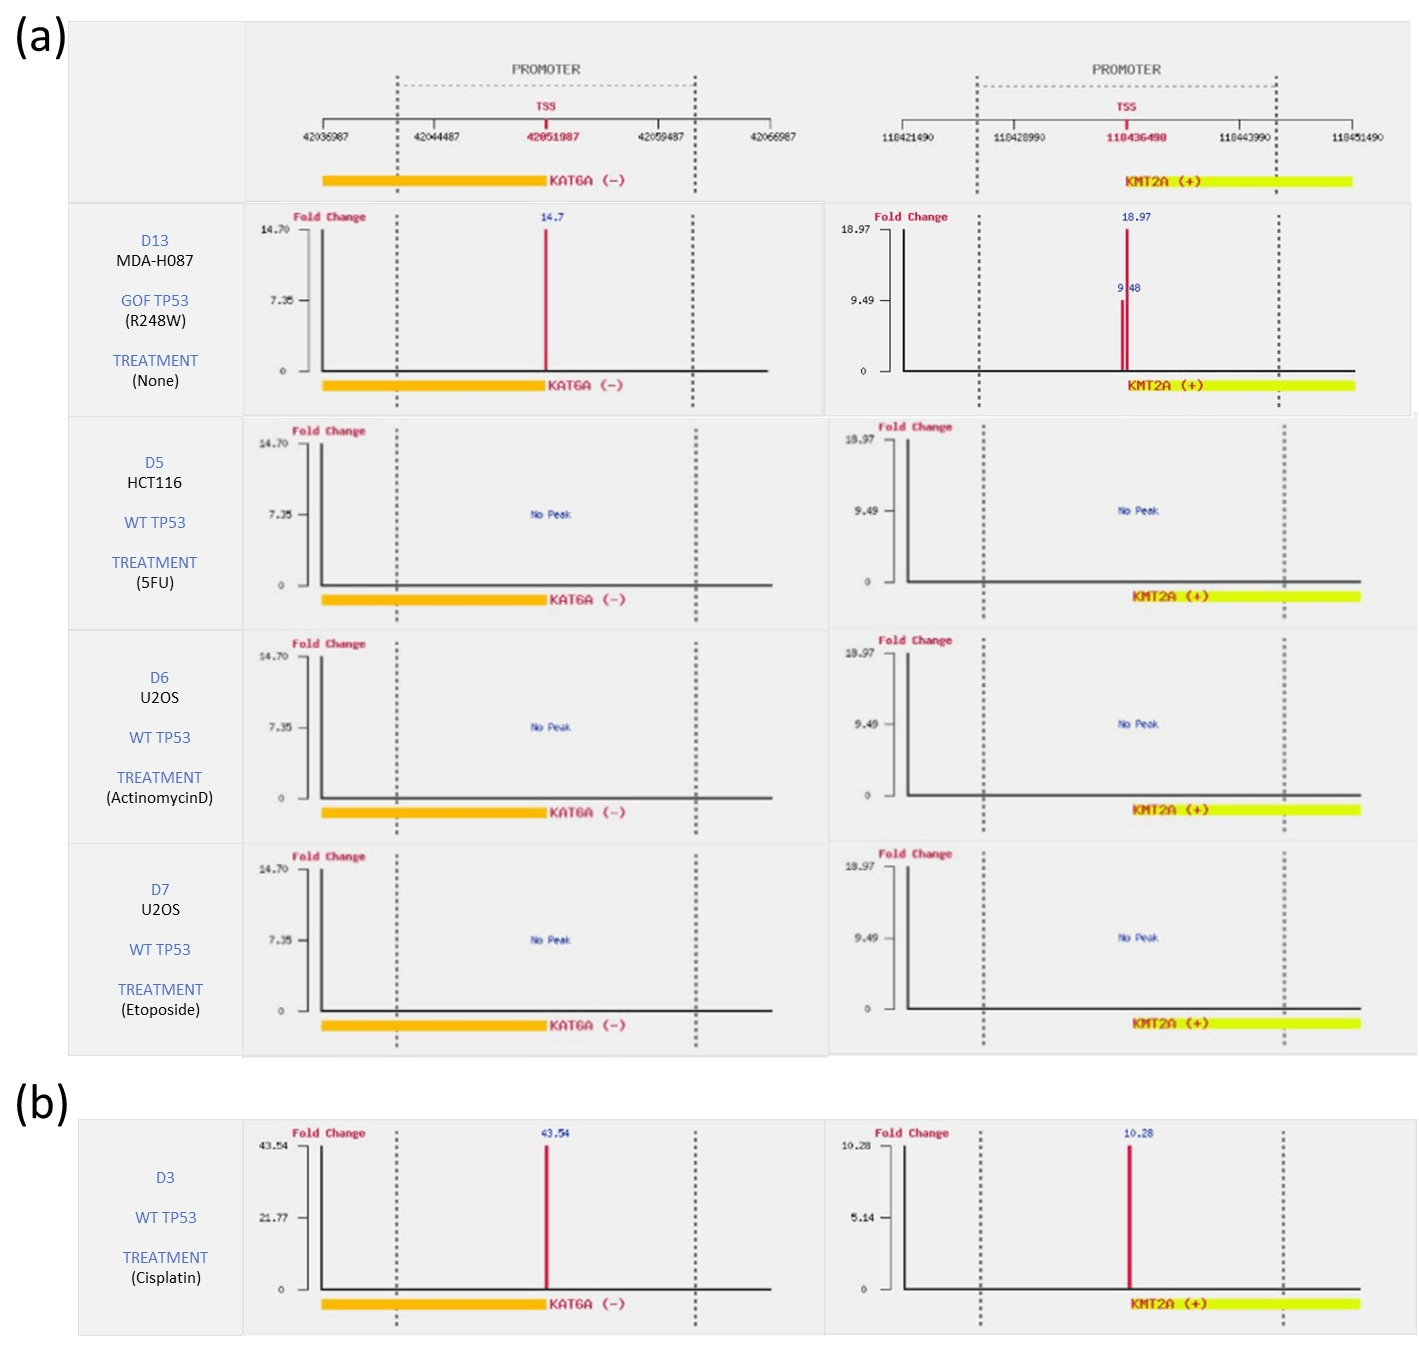
Figure 4: Investigation of TP53 binding in the promoters of KAT6A and KMT2A (a) KAT6A and KMT2A are targeted by GOF TP53 derived from Li-Fraumeni fibroblast MDA-H087, but not targeted by wild type TP53 in the colon cancer cell line HCT116 and osteosarcoma cell line U2OS. (b) KAT6A and KMT2A are targeted by wild type TP53 in normal cells (Neonatal foreskin keratinocytes) following treatment with the DNA damaging agent cisplatin.
Two chromatin modification genes, KAT6A and KMT2A, caught our attention. KAT6A and KMT2A were previously identified as being targeted by GOF TP53, but not by wild-type TP53 in breast cancer cell lines [11]. Here, by comparing the binding profiles of TP53 derived from the 13 datasets, we further extend these findings to other cancer cell lines. Specifically, we found that KAT6A and KMT2A are targeted by GOF TP53 derived from Li-Fraumeni fibroblast MDA-H087, but not targeted by wild type TP53 in colon cancer cell line HCT116 and osteosarcoma cell line U2OS (Figure 4a). More strikingly, we discovered that KAT6A and KMT2A are also targeted by wild-type TP53 in normal cells (Neonatal foreskin keratinocytes) following treatment with the DNA damaging agent cisplatin (Figure 4b). KAT6A belongs to the MYST family of acetyltransferases and it acetylates H3K9, while KMT2A is a methyltransferase targeting H3K4 and functions as a transcriptional coactivator that plays an essential role in regulating gene expression during early development and hematopoiesis. This indicates that wild type TP53 plays an important role in the regulation of the expression of KAT6A and KMT2A in response to DNA damage in normal cells, and therefore, might prevent the development of cancer cells from normal cells. On the other hand, the regulation of KAT6A and KMT2A by GOF TP53 could remodel the chromatin structure, resulting in the disruption of properly regulated gene networks and leading to cancer development.
In summary, we developed a powerful database of TP53 binding loci in the human genome. The search mode of our p53BLD helps users to extract interesting TP53 binding target genes that meet users’ specifications. The browse mode helps users to see the binding patterns of TP53 around a gene of interest.
Conclusions
The tumor suppressor TP53 is a transcription factor that controls cell cycle progression and apoptosis. Mutations in TP53 are frequently found in human cancers. Most mutations which occur in the DNA binding domain of TP53 disrupt its tumor suppressive function and lead to a gain-of-function (GOF) phenotype that promotes tumorigenesis. In order to gain insight into the aberrant binding patterns of TP53 in cancer cells, we developed a web-based platform called the p53 Binding Loci Database (p53BLD), which comprehensively collected 13 published chromatin immunoprecipitation-sequencing (ChIP-Seq) datasets derived from normal and cancer cells harboring either the wild-type TP53 or GOF TP53 mutants. These 13 ChIP-seq datasets were processed using the same pipeline to map to the most recent human genome reference hg38 and to identify the binding peaks (regions with significant enrichment of TP53 binding) and the target genes of TP53 in the human genome. Note that processing these 13 ChIP-seq datasets using the same pipeline is very crucial because it makes comparing the identified peaks and target genes of TP53 from different datasets possible. The p53BLD provides a browse mode to visualize the binding loci of TP53 in the genome and a search mode to retrieve genes whose promoters are bound by TP53. Therefore, the p53BLD provides an excellent tool for analyzing and comparing TP53 genome-wide binding target genes in normal and various cancer cells. As shown in the case study, using p53BLD gives us novel findings that both WT TP53 and GOF TP53 regulate the two chromatin modification genes (KAT6A and KMT2A). More specifically, wild type TP53 plays an important role in the regulation of the expression of KAT6A and KMT2A in response to DNA damage in normal cells, and therefore, might prevent the development of cancer cells from normal cells. On the other hand, the regulation of KAT6A and KMT2A by GOF TP53 could remodel the chromatin structure, resulting in the disruption of properly regulated gene networks and leading to cancer development. In conclusion, we believe that the p53BLD is a valuable resource for the TP53 research community. The p53BLD will be routinely updated if new TP53 ChIP-seq datasets are reported.
List of abbreviations
p53BLD: p53 Binding Loci Database
Ethics approval and consent to participate
Not applicable
Consent for publication
Not applicable
Availability of data and material
All data generated or analysed during this study are included in p53BLD website. p53BLD is available at http://cosbi4.ee.ncku.edu.tw/p53BLD/, http://cosbi5.ee.ncku.edu.tw/p53BLD/ or http://cosbi2.ee.ncku.edu.tw/p53BLD/.
Competing interests
The authors declare that they have no competing interests.
Funding
This work was supported by National Cheng Kung University and Ministry of Science and Technology of Taiwan [MOST-106-2311-B-006-003, MOST-105-2221-E-006-203-MY2, MOST-106-2628-E-006-006-MY2, and MOST-107-2221-E-006-225-MY3].
Authors’ contributions
WSW and HJL conceived the research topic and provided the essential guidance. WSW and HJL collected the original datasets, designed the configuration of p53BLD and wrote the manuscript. YXJ, JWC, YHC constructed the website of p53BLD and prepared all the figures in the manuscript. All authors have read and approved the final manuscript.
Acknowledgements
We wish to thank Torbjörn E.M. Nordling for giving comments and Yau-Wen Yang for helping the analysis of the ChIP-seq datasets.
Article Info
Article Type
Case ReportPublication history
Received: Mon 19, Nov 2018Accepted: Sat 16, Mar 2019
Published: Fri 19, Jul 2019
Copyright
© 2023 Wei-Sheng Wu. This is an open-access article distributed under the terms of the Creative Commons Attribution License, which permits unrestricted use, distribution, and reproduction in any medium, provided the original author and source are credited. Hosting by Science Repository.DOI: 10.31487/j.CMR.2018.01.01
Author Info
Corresponding Author
Wei-Sheng WuDepartment of Electrical Engineering, National Cheng Kung University, Tainan, 70101, Taiwan
Figures & Tables
Table 1: The 13 collected human TP53 ChIP-seq datasets
|
Dataset |
GEO accession number |
Cell line |
TP53 |
Treatment |
|
D1 |
Neonatal foreskin keratinocytes |
WT |
None |
|
|
D2 |
Neonatal foreskin keratinocytes |
WT |
Adrimycin |
|
|
D3 |
Neonatal foreskin keratinocytes |
WT |
Cisplatin |
|
|
D4 |
Normal human lung fibroblast (IMR90) |
WT |
5FU |
|
|
D5 |
Colon cancer cell line (HCT116) |
WT |
5FU |
|
|
D6 |
Osteosarcoma cell line (U2OS) |
WT |
Actinomycin D |
|
|
D7 |
Osteosarcoma cell line (U2OS) |
WT |
Etoposide |
|
|
D8 |
Breast cancer cell line (MCF7) |
WT |
None |
|
|
D9 |
GSM1429754 |
Breast cancer cell line (MDA-MB-175VII) |
WT |
None |
|
D10 |
Breast cancer cell line (HCC70) |
R248Q |
None |
|
|
D11 |
Breast cancer cell line (BT-549) |
R249S |
None |
|
|
D12 |
Breast cancer cell line (MDA-MB-468) |
R273H |
None |
|
|
D13 |
Li-Fraumeni fibroblast (MDA-H087) |
R248W |
None |
References
- Lawrence MS, Stojanov P, Mermel CH, Robinson JT, Garraway LA et al. (2014) Discovery and saturation analysis of cancer genes across 21 tumour types. Nature 505: 495-501. [Crossref]
- Patricia AJ Muller, Karen H Vousden (2014) Mutant p53 in cancer: new functions and therapeutic opportunities. Cancer Cell 25: 304-317. [Crossref]
- Vogelstein B, Lane D, Levine AJ (2000) Surfing the p53 network. Nature 408: 307-310. [Crossref]
- Horn HF, Vousden KH (2007) Coping with stress: multiple ways to activate p53. Oncogene 26: 1306-1316. [Crossref]
- Riley T, Sontag E, Chen P, Levine A (2008) Transcriptional control of human p53-regulated genes. Nat Rev Mol Cell Biol 9: 402-412. [Crossref]
- el-Deiry WS, Kern SE, Pietenpol JA, Kinzler KW, Vogelstein B (1992) Definition of a consensus binding site for p53. Nat Genet 1: 45-49. [Crossref]
- McDade SS, Patel D, Moran M, Campbell J, Fenwick K et al. (2014) Genome-wide characterization reveals complex interplay between TP53 and TP63 in response to genotoxic stress. Nucleic Acids Res 42: 6270-6285. [Crossref]
- Botcheva K, McCorkle SR, McCombie WR, Dunn JJ, Anderson CW (2011) Distinct p53 genomic binding patterns in normal and cancer-derived human cells. Cell Cycle 10: 4237-4249. [Crossref]
- Botcheva K, McCorkle SR (2014) Cell context dependent p53 genome-wide binding patterns and enrichment at repeats. PLoS One 9: e113492. [Crossref]
- Smeenk L, van Heeringen SJ, Koeppel M, Gilbert B, Janssen-Megens E et al. (2011) Role of p53 serine 46 in p53 target gene regulation. PLoS One 6: e17574. [Crossref]
- Zhu J, Sammons MA, Donahue G, Dou Z, Vedadi M et al. (2015) Gain-of-function p53 mutants co-opt chromatin pathways to drive cancer growth. Nature 525: 206-211. [Crossref]
- Do PM, Varanasi L, Fan S, Li C, Kubacka I et al. (2012) Mutant p53 cooperates with ETS2 to promote etoposide resistance. Genes Dev 26: 830-845. [Crossref]
- Fischer M (2017) Census and evaluation of p53 target genes. Oncogene 36: 3943-3956. [Crossref]
- Leroy B, Fournier JL, Ishioka C, Monti P, Inga A et al. (2013) The TP53 website: an integrative resource centre for the TP53 mutation database and TP53 mutant analysis. Nucleic Acids Res 41: D962-D969. [Crossref]
- Brosh R, Rotter V (2009) When mutants gain new powers: news from the mutant p53 field. Nat Rev Cancer 9: 701-713. [Crossref]
- Peart MJ, Prives C (2006) Mutant p53 gain of function: the NF-Y connection. Cancer Cell 10: 173-174. [Crossref]