On the Importance of Metabolic Stability to Achieve High Oral Exposures for Cyclic Peptides
A B S T R A C T
Following up on a previous publication in which we reported a high liver first pass effect in rats for the cyclic peptide (1) [Ala-Leu-NMe-D-Leu-NMe-Leu-Leu-D-Pro], we decided to investigate the type of metabolites formed and to suggest solutions to this problem. As a result of a bile duct cannulation study in rats and subsequent derivatization of this peptide by an isolated Cyp-enzyme, several hydroxylated variants were identified. Cyclopropyl-Ala (Cpa) residues as surrogates for Leu alleviated metabolism at these particular side chains. Significant progress was achieved, when in addition the D-Pro residue was exchanged by 4,4 difluoro-D-Pro (DiF-D-Pro). Albeit the Ala was kept constant in this process, in the corresponding in-vivo studies in rats, peptide (6) [Ala-Cpa-NMe-D-Cpa-NMe-Cpa-Cpa-4,4 difluro-D-Pro] exhibited mM exposures at 3mg/kg and an absolute oral bioavailability of > 90%. Thus, we emphasize the importance of controlling metabolism to achieve significant systemic exposure upon oral administration and suggest the Cpa- and DiF-D-Pro residues as metabolically stable isosteres for Leu, and D-Pro respectively.
Keywords
Cyclic peptides, permeability, metabolism, in-vivo oral bioavailability, pharmacokinetics
Introduction
In our previous publication, we reported on the very high clearance as a result of a first pass effect of 77% for peptide (1) (Figure 1) [1]. This result was particularly intriguing, since a closely related cyclic peptide carrying an a-Abu (or alpha-Abu) residue (plus one methylene group with respect to Ala) instead of the Ala side chain showed only minor effects with respect to liver metabolism. We speculated Cytochrome P450 enzymes (CYPs) to be responsible for this phenomenon and decided to investigate in more detail. In the case of peptide (1), liver metabolism definitely limited the exposure upon oral administration, although in addition the reduced concentration for this peptide in the portal vein indicated a somewhat lower permeability. The latter in-vivo result corresponded to a lower MCDK value as reported earlier. However, first pass effects were dominant, and thus we were aiming to better understand the metabolism. Therefore, we started out by performing a bile duct cannulation to learn which metabolites are generated in-vivo. Following up, we investigated the modifications in more detail in-vitro. Finally, alternative but closely related derivatives to Leu and D-Pro could be identified, which did significantly improve exposure upon oral administration due to the elimination of metabolic hotspots.
Materials and Methods
I Synthesis
Amino acids, reagents and solvents were purchased from Bachem or Aldrich. Cyclic peptides were synthesized with the first Fmoc amino acid linked to a chloro-trityl polystyrene resin (TentaGel S Trt Cl from RAPP Polymere GmbH) or alternatively, 2-Chlorotrityl chloride resin (100 – 200 mesh, 1% DVB, 1.0 – 1.6 mmol Cl/g, from ABCR). Syntheses were carried out manually or alternatively automatic syntheses were run on an Initiator + Alstra microwave peptide synthesizer from Biotage or a Symphony synthesizer from PTI. Peptides were prepared utilizing a synthetic strategy involving attachment of the Fmoc protected C-terminal amino acid, e.g. Fmoc-D-Pro residue via the C-terminal carboxy group to the 2-Cl-Trt-resin and subsequent assembly of the linear peptide on the resin. Peptides were prepared, cleaved from the resin, subsequently cyclized in solution and purified by preparative HPLC. Typically, peptides were synthesized as follows: Fmoc removal was performed using 4-methylpiperidine/DMF 1:4 (2 x 5min, 5 mL). The resin was washed with DMF (x 3) and DCM (x 4) for 10 mins each. Coupling of AAs was performed using 2 eq. of Fmoc-AA-OH, 2.0 eq. of HATU and 8.0 eq. of DIPEA at room temperature. Subsequently, the resin was washed with DMF (x 3) and DCM (x 4). The linear peptide resin was cleaved from the resin by shaking at room temperature for 3 x 10 min then 1 x 5 min with HFIP/DCM (25:75) (6 mL each time). The resin was then washed with DCM (x 2) and the cleavage and washing solutions were filtered off then concentrated to dryness in vacuo. Subsequent to cleavage, cyclization was carried out in solution.
Typically, a 500 mL round-bottomed flask was equipped with a magnetic stirrer and stirring was carried out at 45°C for several hours. Preparative reversed phase purification was carried out as follows: Column: Waters XBridge Prep C18 5 μm OBD, 30 x 250 mm; Waters Part No 186004025; Eluent A: 0.1% TFA in water; Eluent B: AcN; Flow: 30 ml/min; Gradient : 30% B linearly increasing in 30 min to 100% B, fractions collected with a Waters 2767 Sample Manager and UV detection with a Waters 2996 Photo Diode Array Detector linked to a Waters 2525 Binary Gradient Module Pump. Analytical UPLC-MS was carried out as follows: Peptide standard method: Waters Synapt G2; column: Acquity UPLC CSH C18, 1.7 μm, 2.1x100 mm at 80°C, Eluent A: H2O + 0.05 % TFA, B: AcN + 0.05 % TFA, Gradient: hold 5% B for 0.2min; from 5 to 98% B in 9.2min, flow: 0.5 mL/min. Peptide non-polar method: Waters Synapt G2; column: Acquity UPLC BEH C4, 1.7μm, 2.1x100mm at 80°C, Eluent A: H2O + 0.05 % TFA, B: AcN + 0.05 %TFA, Gradient: hold 5% B for 0.2min; from 5 to 98% B in 4.8min, flow: 0.5 mL/min.
Synthesis of peptide (1): [Ala-Leu-NMe-D-Leu-NMe-Leu-Leu-D- Pro]: Cyclization procedure
A solution of H2N-Ala-Leu-NMe-D-Leu-NMe-Leu-Leu-D-Pro-OH (133 mg, 0.200 mmol), HOAt (40.8 mg, 0.300 mmol), HATU (304 mg,0.800 mmol) and 2,6-lutidine (0.699 mL, 6.00 mmol) in DCM (200 mL) was stirred at RT for 2 h. After UPLC-MS analysis, the reaction mixture was concentrated to dryness in vacuo. The crude cyclic peptide was purified by preparative HPLC and pure fractions were combined and lyophilized providing pure cyclic peptide (38.0 mg, 0.058 mmol, 29.0 % yield, purity 98.8% HPLC tR = 7.3 min, UPLC-MS tR = 3.36 min, purity 100%, (M+H)+ = 649.5) as a white lyophilisate.
Synthesis of peptide (2): [Ala-Leu-NMe-D-Leu-NMe-Leu-Cpa-D- Pro]: Cyclization procedure
The linear peptide H2N-Ala-Leu-NMe-D-Leu-NMe-Leu-Cpa-D-Pro- OH (118.8 mg, 0.179 mmol) was dissolved in a solution of HATU (204 mg, 0.536 mmol) and collidine (0.143 mL, 1.072 mmol) in AcN (60 mL) heated at 40°C. Subsequently, a solution of HATU (204 mg, 0.536 mmol) and collidine (0.048 mL, 0.357 mmol) in AcN (8 mL) was slowly added in 9 min. The reaction mixture was then stirred at 40°C for 30 min. UPLC-MS showed completion of the reaction. The reaction mixture was concentrated to dryness in vacuo. The residue was partitioned between DCM (50 ml) and 5% NaHCO3 (5 ml). The organic layer was washed with 5% NaHCO3 (2 x 5 ml), brine (5 ml), passed through a phase separator column and concentrated to dryness in vacuo to yield 181 mg of a pale-yellow oil. The crude residue was purified by preparative HPLC, eluting from 40% AcN / water to 70% AcN / water in 30 min. The pure fractions were evaporated and lyophilised providing the pure cyclic peptide (14.6 mg, 0.021 mmol, 11.8% yield, tR = 5.71 min, 93% purity (M+H)+ =647.4, HPLC tR = 6.94 min, 96% purity) as a white lyophilisate.
Synthesis of peptide (3): [Ala-Leu-NMe-D-Leu-NMe-Cpa-Leu-D- Pro]: Cyclization procedure
The linear peptide H2N-Ala-Leu-NMe-D-Leu-NMe-Cpa-Leu-D-Pro- OH (199 mg, 0.299 mmol) was dissolved in a solution of HATU (341 mg, 0.898 mmol) and collidine (0.239 mL, 1.796 mmol) in AcN (100 mL) and heated at 40°C. Subsequently a solution of HATU (341 mg, 0.898 mmol) and collidine (0.080 mL, 0.599 mmol) in AcN (10 mL) was added slowly in 14 min. The reaction mixture was then stirred at 40°C for 30 min. UPLC/MS showed completion of the reaction. The reaction mixture was concentrated to dryness in vacuo. The residue was partitioned between DCM (50 ml) and 5% NaHCO3 (5 ml). The organic layer was washed with 5% NaHCO3 (2 x 5 ml), brine (5 ml), passed through a phase separator column and concentrated to dryness in vacuo to yield a pale-yellow oil. The residue was purified by preparative HPLC, eluting from 40% AcN / water to 70% AcN / water in 30 min. The desired fractions were evaporated and lyophilised providing pure cyclic peptide (28.6 mg, 0.043 mmol, 14.3% yield, UPLC-MS tR = 5.74 min, (M+H)+ = 647.4, 97% purity, HPLC, tR = 7.09 min, 98% purity) as a white lyophilisate.
Synthesis of peptide (4): [Ala-Leu-NMe-D-Leu-NMe-Cpa-Cpa-D- Pro]: Cyclization procedure
The linear peptide H2N-Ala-Leu-NMe-D-Leu-NMe-Cpa-Cpa-D-Pro- OH (133 mg, 0.201 mmol) was dissolved slowly in a solution of collidine (0.053 mL, 0.401 mmol) in AcN (8 mL) and was then added within 9 min to a solution of HATU (229 mg, 0.602 mmol) and collidine (0.160 mL, 1.204 mmol) in AcN (65 mL). The reaction mixture was then stirred at 40°C for 1h, when UPLC-MS showed completion of the reaction. The reaction mixture was concentrated to dryness in vacuo. The residue was partitioned between DCM (50 ml) and 5% NaHCO3 (5 ml). The organic layer was washed with 5% NaHCO3 (2 x 5 ml), brine (5 ml), passed through a phase separator column and concentrated to dryness in vacuo to yield 187.5 mg of a pale-yellow oil. The residue was purified in two parts by preparative HPLC, eluting from 40% AcN / water to 70% AcN/ water in 30 min. The desired fractions were evaporated and lyophilised providing pure cyclic peptide (4.6 mg, 6.71 mmol, 3.34% yield, 94% purity UPLC-MS tR = 5.22 min, (M+H)+ = 645.3, HPLC tR = 6.09 min,93% purity) as a white lyophilisate.
Synthesis of peptide (5): [Ala-Cpa-NMe-D-Cpa-NMe-Cpa-Cpa-D- Pro]: Cyclization procedure
The linear peptide H2N-Ala-Cpa-NMe-D-Cpa-NMe-Cpa-Cpa-D-Pro- OH (264 mg, 0.401 mmol) and collidine (0.107 mL, 0.801 mmol) in AcN (8 mL) were added slowly in 11 min to a solution of of HATU (457 mg,1.202 mmol) and collidine (0.320 mL, 2.404 mmol) in AcN (130 mL) and the reaction mixture was stirred and heated at 40°C for 30 min. UPLC/MS showed completion of the reaction. The reaction mixture was concentrated to dryness in vacuo. The residue was partitioned between DCM (50 ml) and 5% NaHCO3 (5 ml). The organic layer was washed with 5% NaHCO3 (2 x 5 ml), brine (5 ml), passed through a phase separator column and concentrated to dryness in vacuo to yield a pale- yellow oil. The residue was purified by preparative HPLC, eluting from 45% AcN / water to 90% AcN / water in 30 min. The desired fractions were evaporated and lyophilised to afford pure cyclic peptide (110.4 mg,0.167 mmol, 41.7% yield, UPLC-MS tR = 5.30 min, (M+H)+ =6 41.4, purity 97%, UPLC tR = 5.13 min, 98% purity) as a white lyophilisate.
Synthesis of peptide (6): [Ala-Cpa-NMe-D-Cpa-NMe-Cpa-Cpa-DiF- D-Pro]: Cyclization procedure
The linear peptide H2N-Ala-Cpa-NMe-D-Cpa-NMe-Cpa-Cpa-DiF-D- Pro-OH (80.0 mg, 0.115 mmol) and collidine (0.031 mL, 0.230 mmol) in AcN (8 mL) were slowly added to a solution of HATU (131 mg, 0.345 mmol) and collidine (0.092 mL, 0.691 mmol) in AcN (40 mL) and heated at 40°C in 9 min. The reaction mixture was then stirred at 40°C for 30 min. UPLC/MS showed completion of the reaction. The reaction mixture was concentrated to dryness in vacuo. The residue was partitioned between DCM (50 ml) and 5% NaHCO3 (5 ml). The organic layer was washed with 5% NaHCO3 (2 x 5 ml), brine (5 ml), passed through a phase separator column and concentrated to dryness in vacuo to yield a pale-yellow oil. The residue was purified by preparative HPLC, eluting from 45% AcN / water to 90% AcN / water in 30 min. The desired fractions were evaporated and lyophilised to provide the pure cyclic peptide (6.3 mg, 9.12 mMol, 7.9% yield, UPLC-MS tr = 4.48 min, (M+H)+ = 677.4, 98% purity) as a white lyophilisate.
Synthesis of precursor Boc-NMe-Cpa-OH
To a solution of (S)-2-((tert-butoxycarbonyl)amino)- 3-cyclopropylpropanoic acid (2 g, 8.72 mmol) in THF (30 mL) cooled at 0°C was added NaH (1.396 g, 34.9 mmol) portionwise. The reaction mixture was stirred at 0°C for 30 min. A solution of iodomethane (4.34 mL, 69.8 mmol) in THF (5 mL) was added and the reaction mixture was stirred at 0°C for 30 min and was then allowed to reach room temperature for 2h. The reaction mixture was quenched with water (10 mL) and extracted with AcOEt. The aqueous phase was then acidified to pH = 2 with 10% KHSO4 solution and extracted with AcOEt. The combined organic extracts were washed with brine, purified by passing through a phase separator column and evaporated in vacuo to yield a yellow oil (1.6 g, 72% yield, UPLC-MS_2_min_reaction_monitoring tR = 0.90 min, purity > 99%, (M+H)+ = 244.1, 1H NMR, DMSO-d6, purity > 95%).
Synthesis of precursor Fmoc-NMe-Cyp-Ala-OH
The synthesis of Fmoc-NMe-Cyp-Ala-OH was carried out by WuXi (China) providing the target compound (7.0 g, purity 92%, UPLC-MS Standard-method tR = 5.32 min, (M+Na)+ = 388.2). For examples of analytical results, please refer to supplementary information.
II Bioreactions
i Analytical CYP Screening
In order to identify suitable CYP enzymes for the synthesis of oxidized metabolites, peptide (1) was subjected to screening experiments with human, mammalian and bacterial CYP enzymes recombinantly expressed in E. coli cells. The genetic constructs were generated at the Biomedical Research Centre of the University of Dundee, Scotland, UK in the course of an academia/industry collaboration [2, 3]. The recombinant E. coli were cultivated as described previously [2] and stored in 0.5 mL aliquots in 2 mL Eppendorf tubes at -80°C. For every CYP isoform one reaction tube was thawed and 5 µL of a 10 mg/mL peptide (1) stock solution and 25 µL of isocitrate 46% (w/v) were added to each tube. Final concentration of peptide (1) was 0.1 mg/mL . Tubes were closed with a cotton plug and incubated at 30°C and 1100 rpm on an Eppendorf shaker. Samples were taken after 1, 6 and 24 hours by adding 60 µL of the biotransformation mixture to 60 µL AcN/MeOH 1:1, mixing for 5 minutes and centrifugation at 15000 rpm for 5 min to remove cell debris. The supernatant was transferred into HPLC microvials and analyzed by UPLC-MS.
ii Fermentation & Preparative Conversion
Fermentation
From a frozen glycerol stock of recombinant E. coli expressing human CYP3A5 and CYP reductase some material was used to inoculate a pre- culture consisting of 6*200 mL TB medium (Table S1) in 500 mL shake flasks containing ampicillin and chloramphenicol in a concentration of 100 µg/L and 50 µg/L, respectively. The pre-culture was incubated over night at 30°C and 180 rpm. The following main culture was performed in 35 L TB medium supplemented with ampicillin and chloramphenicol at 30°C. Further information can be found in the supplementary information.
III Assays for Permeability and Solubility
Protocols for high-throughput equilibrium solubility, PAMPA and cellular permeability by the MDCK-LE and MDCK-MDR1 assays were followed as reported earlier [4, 5]. The values relate to single experiments run in triplicates. For the MDCK assay, the LLOQ (lower limit of quantification) was 5 nM, and for PAMPA 2 nM, respectively. For both PAMPA and MDCK, the standard deviation in log units for those assays is 0.2 (1.6-fold on a linear scale). This has been estimated by looking at independent replicates across the assay dynamic range. For the determination of apparent passive permeabilities, Papp, apical to basolateral was determined using MDCK-Low efflux cells (Sigma #8412903) and for the determination of efflux ratios Papp, apical to basolateral, and basolateral to apical, MDCK-MDR1 cells (Netherland Cancer Institute) were used.
IV Microsomal Stability Assays
300 μL incubation contains 1μM test compound, <0.5% AcN, 0.01% DMSO, 0.5 mg microsomal protein per mL, 25 μg of alamethicin per mg protein, 1.0 mM NADPH, 1.0 mM UDPGA, and 2 mM magnesium chloride. Aliquots are removed from the incubation at 0, 10, 20 and 30 min and combined with quench/extraction solution. The samples are centrifuged, and the supernatants analyzed by LC-MS/MS. The percentage of test compound remaining relative to 0 minutes is converted into in vitro elimination-rate constant (kmic), in vitro half-life (t1/2) and in vitro intrinsic clearance (CLint) parameters.
V SAPSA
Molecular dynamics simulations were performed over 100 ns for every peptide using an implicit solvent model of water generating a set of 100000 conformations for each as previously reported [4, 6]. The initial 3-dimensional structures were generated using the program Corina [7]. The presence of amide bonds in trans configuration and of type II’’ turns was ensured by interactive modelling using the program ICM [8]. Before starting data collection, the peptides were minimized for 400 steps and heated to 300 K by performing 10 ps Langevin dynamics. A water model was applied for the dynamics, rather than a model representing the membrane interior (e.g., chloroform), since this leads to faster transitions between conformations in the simulations and better sampling of conformation space [9]. For every structure thus obtained, we computed the 3-dimensional solvent-accessible polar surface area. By averaging over the conformations of the last 95 ns, we determined the time- averaged, solvent accessible surface area (SAPSA) of the peptides. Conformational changes and the dynamic formation of hydrogen bonds were facilitated by a high dielectric constant of 80 representing water as the solvent, and a low friction constant of 1/ps for performing constant temperature Langevin dynamics [10]. The SAPSA for each frame is determined as the area covered by the center of a solvent probe sphere with a radius of 1.4 Å in contact with oxygen, nitrogen, and their bonded hydrogens [11]. For the solute atoms, we employ the same Bondi radii as are used to compute the conventional polar surface area (PSA) [12].
VI SFC
Conditions for analytical supercritical fluid chromatography (SFC) were taken from previous publications [13, 14]. The Pirkle chiral stationary phase Chirex 3014, a silica bonded (S)-valine and (R)-1-(α-naphthyl) ethylamine with a urea linkage, was selected. A mobile phase of 15% methanol in supercritical CO2 enabled adequate separation in combination with a low-slope gradient. High retention times were mitigated by increasing the percentage of methanol in the eluent and the addition of the relatively weak salt pair ammonium formate. In the resulting chromatographic system, differences in retention depend upon hydrophobic interactions, the ability for hydrogen bonding, the presence of dipoles, and van der Waals interactions of the solutes with the stationary phase [13, 14].
VII NMR Spectroscopy
i Sample Preparation
1-2 mg of the metabolites were dissolved in 40 μl d6-DMSO. Vortexed for 20s, the obtained clear solution was transferred into a 1.7 mm NMR sample tube and placed on a SampleJet sample changer prior to acquisition.
Data Acquisition & Processing
1H detected 1D and 2D NMR spectra were obtained using a Bruker 600 MHz AVANCE III HD spectrometer equipped with a 1.7mm TCI cryo probe and a z-gradient system. 1D proton spectra were recorded with a standard one-pulse sequence (30 degree flip angle) with a relaxation delay of 1s and an acquisition time of 2.73s. 16 scans of 65536 points covering 12019.23 Hz were recorded. Data was zero-filled to 65536 complex points and an exponential window function was applied with a line-broadening factor of 0.3 Hz prior to Fourier transformation.
All 2D experiments for NMR assignment were recorded at a temperature of 300K with a relaxation delay of 1.5s. For gradient COSY spectra a data matrix of 512 x 2048 points covering 6602.1 x 6602.1 Hz was recorded with 1 scan for each increment [15, 16]. Data was linear predicted to 1024 x 2048 points using 32 coefficients and zero filled to 2048 x 2048 points. A sine square bell shaped window function was applied in F2 and a cosine square bell shaped window function in F1, respectively, prior to magnitude mode type 2D Fourier transformation. For edited coherence order selective gradient HSQC spectra using adiabatic inversion pulses on the carbon channel, a data matrix of 256 x 2048 points covering 24901 x 8417.5 Hz was recorded using 2 scans for each increment[17-19]. Data was linear predicted to 512 x 2048 points using 32 coefficients and zero filled to 1024 x 2048 points prior to echo- anti echo type 2D Fourier transformation.
A sine square bell shaped window function shifted by π/2 in both dimensions was applied. For HMBC spectra a data matrix of 256 x 4096 points covering 33805 x 8417.5 Hz with 4 scans for each increment was recorded using a double low pass J-filter and F1 absorption mode [20, 21]. Data was linear predicted to 512 x 4096 points using 32 coefficients and zero-filled to 1024 x 2048 complex points prior to echo-anti echo type 2D Fourier transformation. A cosine square shaped window function was applied in F1 and a sine shaped window function shifted by π/4 was applied in F2. Data was converted to magnitude mode in F2 prior to analysis. ROESY spectra with an effective field of γB1 = 8333 Hz and an spin lock time of 200 msec were recorded for a data matrix of 512 x 2048 points covering 8417.5 x 8417.5 Hz. 4 scans were recorded for each increment [22, 23]. Data was linear predicted to 1024 x 2048 points using 32 coefficients prior to States-TPPI type 2D Fourier transformation, and a sine square bell shaped window function shifted by π/2 in both dimensions was applied. For MLEV-17 based TOCSY spectra a data matrix of 256 x 2048 points covering 8417.5 x 8417.5 Hz, and 2 scans were recorded for each increment [24]. Data was linear predicted to 512 x 2048 points using 32 coefficients and zero filled to 1024 x 2048 points prior to TPPI type 2D Fourier transformation. A cosine square bell shaped window function was applied in both dimensions. All spectra were referenced according to the internal solvent signal (1H: d6-DMSO = 2.50 ppm and 13C: d6-DMSO = 39.52 ppm [25].
Results
As outlined in the introduction, in the first instance we investigated the in-vivo fate of peptide (1) in an experiment using bile duct cannulation in rats (Figure 1). This bile-duct cannulation experiment was performed to inform about the contribution of phase 1, phase 2 metabolism and direct drug secretion into the bile [26]. The excretion pattern of peptide (1) is illustrated in (Table S6) (supplementary information). In addition, we looked at the parent and metabolites in the bile, blood, and urine. Surprisingly, only trace amounts of the parent molecule could be detected in the bile and in the urine (Table S6). In contrast to the latter organs, after 1 h in blood, > 90% of compound-related material was identified as peptide (1).
We tried to unambiguously identify metabolites from the bile duct, however, the original design of the peptide did not take into consideration this kind of study. Initially, we thought metabolism would focus on the Ala side chain, since this is the only residue, which is different from the more metabolically stable Abu-analogue studied previously. However, using MS analysis, we detected oxidative metabolism across the scaffold, which could not be easily assigned to a particular residue (Figure 2), due to the presence of 4 Leu side chains. Nevertheless, metabolites clearly originated from oxidation events. Most likely, CYP enzymes are responsible for this result. As a consequence, we analyzed isolated CYPs for their ability to produce the metabolites observed in the in-vivo study. As indicated in (Table S7), a variety of CYPs are able to transform peptide (1). Out of this panel of CYPs, we chose CYP3A5 to produce metabolites on a larger scale to be able to isolate and characterize them. As displayed in (Figure 3), following incubation of peptide (1) with CYP3A5, metabolites were separated. The chromatogram of the preparative HPLC run indicated three main products, which were isolated at the mg scale and submitted to NMR analysis (see supplementary information). In line with the in-vivo experiments, the main metabolites were determined as hydroxylation products of Leu side chains in the Southern part of the molecule as shown in (Figure 4).
Interestingly, the terminal methyl group and the tertiary carbon of Leu were the primary targets for this conversion. These metabolites produced in-vitro, were cross-checked by LC-MS with samples from the in-vivo study and corresponded exactly to some of the metabolites observed in the bile duct cannulation experiment. Surprisingly, in the in-vitro experiment, we could not identify any modification on the Ala side chain, which we initially thought to be the culprit. Nevertheless, we thought the problem of metabolism could be cured, if we could alter the nature of the hydroxylation sites. Since cyclopropyl-Ala (Cpa) is as closely related to Leu as possible, but is more constrained, we considered this derivative as a Leu-isostere. Next, we started out to modify the two positions identified by NMR analysis. We have chosen to overcome metabolism for these particular residues, and accordingly peptide (2) to (4) were prepared to investigate, whether there is a differential effect on the two mono versus the dual substitution regarding CYP activity. In an initial step, we studied the property space and then turned to microsomal assays as a surrogate for liver metabolism. The in-silico (SAPSA) and in-vitro-profiling (SFC, PAMPA) revealed a slightly reduced permeability for peptides (2) to (4) (Table 1). This finding is confirmed by the low efflux MDCK values as indicated in (Table 2). When metabolic studies in microsomes were performed, in the first instance, we were disappointed by the negative results. Figure 5 shows the depletion of these three peptides, when applied to rat liver microsomes (RLM). All three peptides (2), (3), and (4) were transformed quite rapidly.
Following this kinetic analysis, we determined the clearance and the hepatic extraction values in our standard RLM and human liver microsomes (HLM) assays (Table 3). In both cases, we could not discriminate between peptides (1) to (4). However, when we analyzed for the type of modifications, the Cpa residues incorporated in peptides (3) and (4) remained unchanged, and metabolism has shifted to other side chains as indicated by LC-MS analysis (Figure 6a and Figure 6b). As observed with the original peptide (1), the molecules were subject to oxidative metabolism at various positions including the D-Pro, Leu and N-methyl Leu residues. Although the outcome was not expected, these results validated the Cpa-residue as a metabolically stable isoster for Leu. As a consequence, we asked the question to what extent we can improve on metabolic stability, and thus on absolute oral bioavailability, if the remaining Leu side chains and also the Pro residue are substituted by metabolically stable isosteres. In the first instance, we replaced all Leu side chains by the Cpa motif and considering a step further with respect to what can be gained in addition, we tried to eliminate metabolism at the D-Pro residue by incorporating the corresponding 4,4 difluorinated analogue (DiF-D-Pro). Peptide (5), containing only Cpa residues in the corresponding Leu positions, showed improved metabolic stability in the RLM and HLM assays (Table 3).
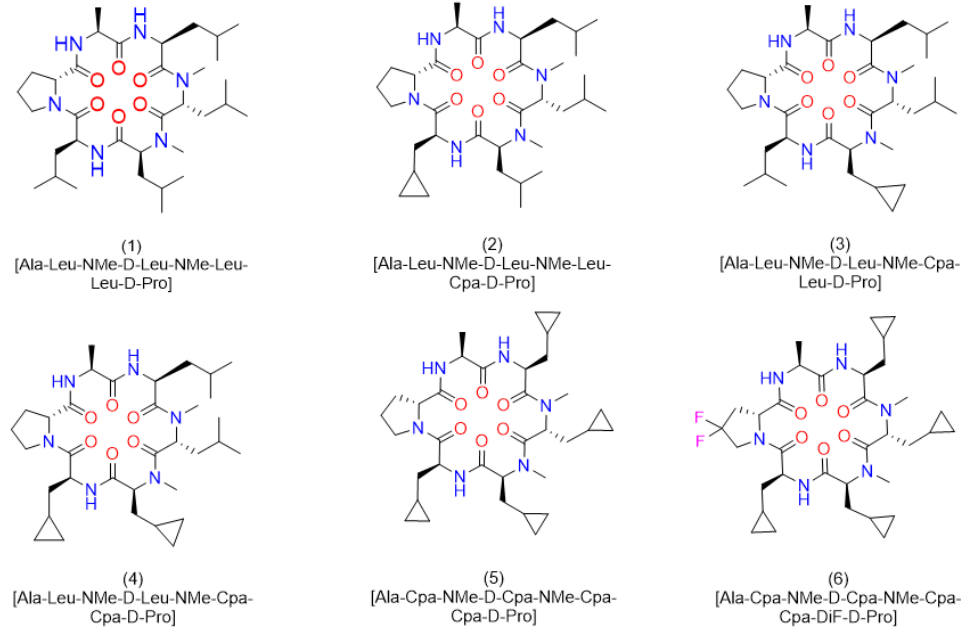
Figure 1: Structures of cyclic hexapeptides (1)-(6).
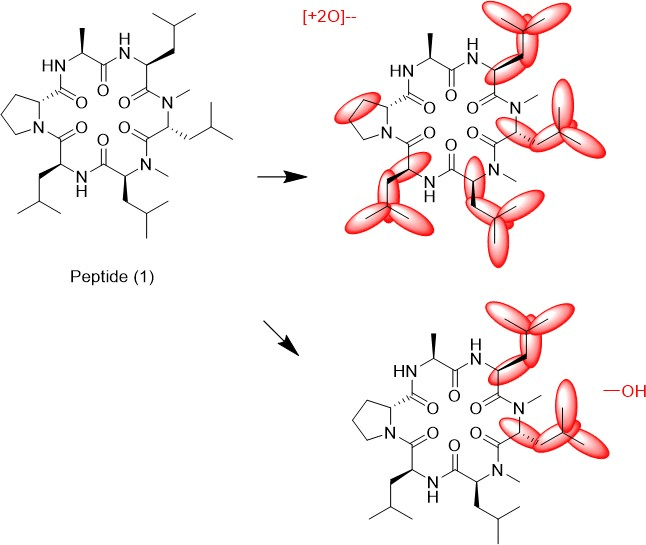
Figure 2: Metabolites as determined from the bile duct by LC-MS.
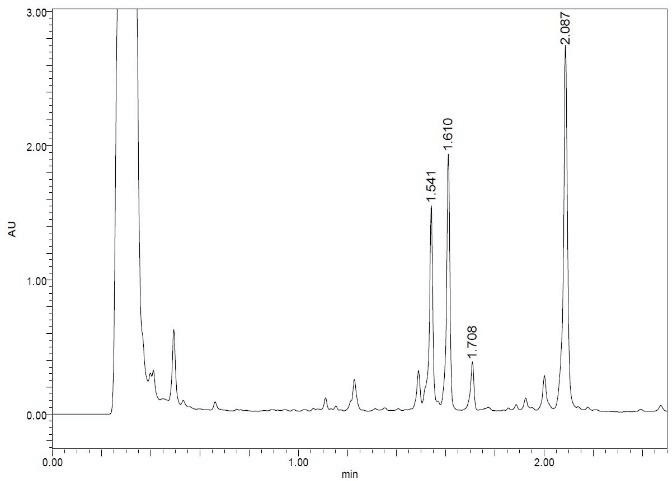
Figure 3: LC profile of peptide (1) following incubation with CYP3A5.
Table 1: Overview of In-Vitro Parameters.
|
Peptide |
Structure |
SAPSA (Å2) |
SFC (min) |
Sol. pH=6.8 [mM] |
Log PAMPA (pH 6.8) [m/s] |
Class |
|
(1) |
[Ala-Leu-NMe-D-Leu-NMe-Leu-Leu-D-Pro] |
84 ± 12 |
2.83 |
>1 |
-4.8 |
H |
|
(2) |
[Ala-Leu-NMe-D-Leu-NMe-Leu-Cpa-D-Pro] |
91 ± 12 |
3.01 |
>1 |
-5.3 |
M |
|
(3) |
[Ala-Leu-NMe-D-Leu-NMe-Cpa-Leu-D-Pro] |
87 ± 11 |
2.98 |
0.98 |
-5.0 |
H |
|
(4) |
[Ala-Leu-NMe-D-Leu-NMe-Cpa-Cpa-D-Pro] |
90 ± 12 |
3.07 |
0.23 |
-5.0 |
M |
|
(5) |
[Ala-Cpa-NMe-D-Cpa-NMe-Cpa-Cpa-D-Pro] |
91 ± 13 |
3.60 |
0.44 |
-6.1 |
L |
|
(6) |
[Ala-Cpa-NMe-D-Cpa-NMe-Cpa-Cpa-DiF-D-Pro] |
92 ± 13 |
3.15 |
0.39 |
-5.3 |
M |
Table 2: Overview of MDCK Parameters.
|
Peptide |
Structure |
MDCK mdr1 (A-B) ± SD [10-6 cm/s] |
MDCK mdr1 (B-A) ± SD [10-6 cm/s] |
MDCK mdr1 Ratio (BA/AB) |
MDCK-LE (A-B) ± SD [10-6 cm/s] |
|
(1) |
[Ala-Leu-NMe-D-Leu-NMe-Leu-Leu-D-Pro] |
0.24 ± 0.06 |
12.7 ± 1.89 |
52.9 |
8.04 ± 0.27 |
|
(2) |
[Ala-Leu-NMe-D-Leu-NMe-Leu-Cpa-D-Pro] |
0.15 ± 0.20 |
8.3 ± 1.21 |
55.3 |
5.02 ± 0.23 |
|
(3) |
[Ala-Leu-NMe-D-Leu-NMe-Cpa-Leu-D-Pro] |
0.24 ± 0.03 |
12.6 ± 1.60 |
52.5 |
6.23 ± 1.05 |
|
(4) |
[Ala-Leu-NMe-D-Leu-NMe-Cpa-Cpa-D-Pro] |
0.12 ± 0.01 |
15.0 ± 1.19 |
125 |
5.04 ± 0.54 |
|
(5) |
[Ala-Cpa-NMe-D-Cpa-NMe-Cpa-Cpa-D-Pro] |
0.21 ± 0.04 |
11.6 ± 1.90 |
55.2 |
1.42 ± 0.01 |
|
(6) |
[Ala-Cpa-NMe-D-Cpa-NMe-Cpa-Cpa-DiF-D-Pro] |
0.21 ± 0.01 |
15.8 ± 1.53 |
75.3 |
1.85 ± 0.10 |
Table 3: Microsome data and scaling to hepatic clearance.
|
|
|
HLM |
RLM |
HLM scaled |
RLM scaled |
Rat in vivo |
|
Peptide |
Structure |
CL(int.)±SE [uL/min/106cells] |
CL(int.)±SE [uL/min/106cells] |
hepatic CL [mL/min/kg] a) |
hepatic CL [mL/min/kg] a) |
CL[mL/mi n/kg] |
|
(1) |
[Ala-Leu-NMe-D-Leu-NMe-Leu-Leu-D-Pro] |
286 ± 64 |
130± 9 |
19.7 |
73.7 |
85 ± 7 |
|
(2) |
[Ala-Leu-NMe-D-Leu-NMe-Leu-Cpa-D-Pro] |
425 ± 13 |
314 ± 14 |
20.0 |
87.2 |
|
|
(3) |
[Ala-Leu-NMe-D-Leu-NMe-Cpa-Leu-D-Pro] |
385 ± 16 |
271 ± 16 |
19.9 |
85.4 |
|
|
(4) |
[Ala-Leu-NMe-D-Leu-NMe-Cpa-Cpa-D-Pro] |
368 ± 5 |
> 700 |
19.9 |
93.8 |
|
|
(5) |
[Ala-Cpa-NMe-D-Cpa-NMe-Cpa-Cpa-D-Pro] |
108 ± 14 |
301 ± 15 |
18.2 |
86.7 |
76 ± 3 |
|
(6) |
[Ala-Cpa-NMe-D-Cpa-NMe-Cpa-Cpa-DiF-D-Pro] |
< 25 |
< 25 |
3.41 |
35.1 |
21 ± 1 |
a) Scaling factors for human/rat microsomal data: 53/54 mg microsomal protein/g liver, 25.7/40 g liver/kg body weight, hepatic CL calculated by well- stirred equation (CLh=Qh*Clint/(Qh+Clint) with human and rat Qh of 20.7/100 mL/min/kg.
Table 4: Detailed PK Parameters (Rat, dose (i.v.): 1mg/kg, dose (p.o.): 3 mg/kg, values are dose normalized, d.n.).
|
Peptide |
Structure |
Exposure (i.v. d.n.) [nmol.h/L] |
Exposure (p.o.d.n.) [nmol.h/L] |
Vss (L/Kg) |
T1/2 (h) |
MRT (h) |
Cmax d.n. (nM) |
Tmax (h) |
BAV (%) |
|
(1) |
[Ala-Leu-NMe-D-Leu-NMe- Leu-Leu-D-Pro] |
304 ± 25 |
15 ± 1 |
3.2±0.5 |
0.5 ± 0 |
0.6±0.1 |
7 ± 3 |
0.3±0.1 |
5 ± 0 |
|
(5) |
[Ala-Cpa-NMe-D-Cpa-NMe- Cpa-Cpa-D-Pro] |
342 ± 13 |
44 ± 12. |
1.5±0.2 |
0.28±0.03 |
0.33±0.3 |
37± 21 |
0.4±0.1 |
13 ± 3 |
|
(6) |
[Ala-Cpa-NMe-D-Cpa-NMe- Cpa-Cpa-DiF-D-Pro] |
1195 ± 59 |
1151±218 |
2.3±0.2 |
1.51±0.19 |
1.83±0.1 |
236±104 |
1.2±0.8 |
96 ±17 |
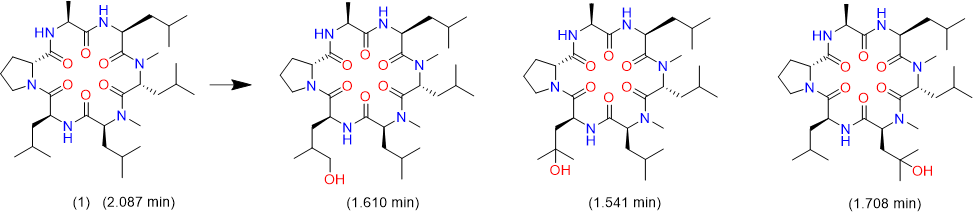
Figure 4: Metabolites of peptide (1) as identified by 2-D NMR.
However, peptide (6), having in addition the DiF-D-Pro incorporated, showed a significant improvement in these two assays. Analyzing for the corresponding in-vitro properties as indicated in (Table 1 and Table 2), some differences regarding permeability were observed. Especially peptides (5) and (6) would have been regarded inferior in their ability to cross the intestinal barrier as a result of PAMPA, MDCK-LE, and SFC measurements. Interestingly, all modifications kept the solubility > 0.2 mM, which is regarded as a very reasonable level for permeable macrocyclic molecules. In the MDCK low efflux assay, similarly to the other in-vitro permeability assays reported in (Table 1), peptides (5) and (6) scored lower than peptides (1) to (4) (Table 2). The trend for a reduced permeability of the more metabolically stabilized peptides is readily visualized, when plotting PAMPA and MDCK LE values against the SFC retention time (Figure 7). This graph shows quite a good correlation between these independent methods for assessing permeability.
Overall, a slightly reduced permeability for the Cpa-containg peptides is evident from in-silico and in-vitro analyses. Surprisingly, all six peptides showed a comparable high efflux ratio in the MDCK mdr1 assay. Due to the improvements experienced in the RLM and HLM assays with modifications for peptides (5) and (6) (Table 3), we decided to carry out in-vivo studies to compare the oral bioavailability to the original peptide (1). The same dosing regimen as for peptide (1) was applied, and for peptide (5) a slightly higher oral exposure was observed, which led to an absolute oral bioavailability of around 13% (Table 4). However, the results for peptide (6) were really surprising as mM exposures were reached for i.v. and p.o. applications and an oral bioavailability of about 96% was achieved (Figure 8). Despite the fact that the suboptimal Ala side chain was maintained, the removal of all other metabolic hotspots resulted in an extraordinarily high oral uptake for peptide (6).

Figure 5: Depletion of peptides (2), (3), and (4) in the presence of RLMs.
Discussion
The results presented in this study demonstrate that metabolism on Pro and Leu side chains can be cured, at least in these cases, by the introduction of the metabolically stable isosteric building block Di-F-D- Pro and Cpa derivatives. Interestingly, in silico evaluation indicated a slightly lower permeability as more residues were modified to eliminate metabolic hot spots. This finding, in line with the experimentally measured SFC, PAMPA and MDCK-LE values, may be a result of increased flexibility, and as a consequence, of reduced shielding of polar backbone atoms. According to the in-vitro results, the expectation for the in-vivo part would have been a slightly reduced exposure, which would have been explained by a reduced intestinal passive uptake for the more metabolically stable analogues.
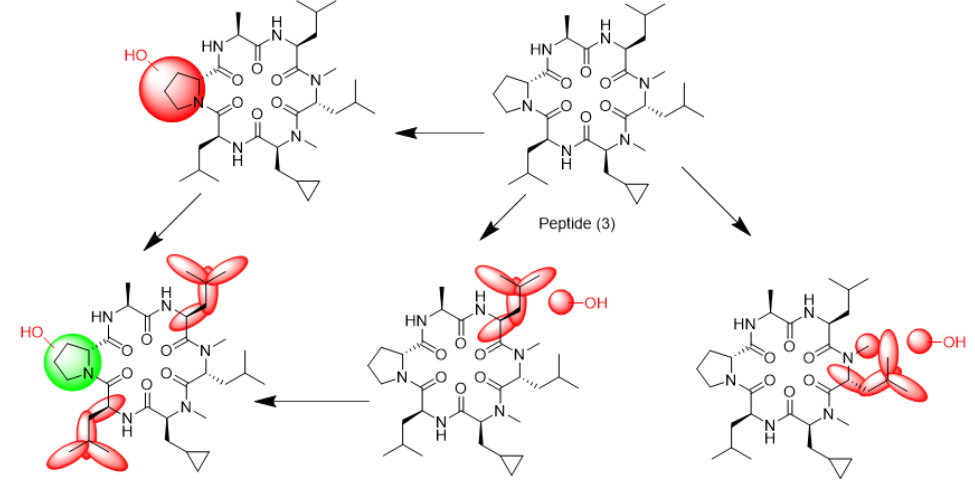
Figure 6a: In-vitro biotransformation pathway (RLM) for peptide (3).

Figure 6b: In-vitro biotransformation pathway (RLM) for peptide (4).
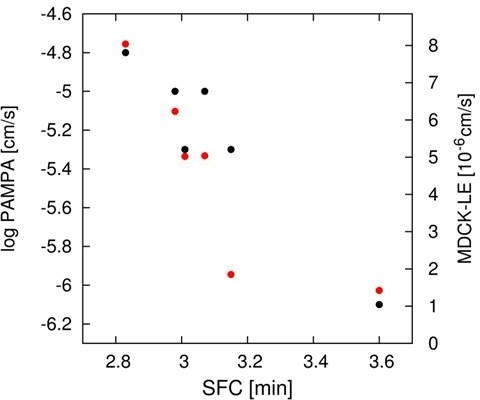
Figure 7: Correlation of PAMPA (black) and MDCK-LE (red) parameters with SFC retention time.
The fact that oral exposure and bioavailability for peptide (5) is significantly increased and for peptide (6) extraordinary systemic levels are achieved, came as a surprise. This was especially surprising, since the original Ala side chain, which was thought to be responsible for the high in-vivo clearance in the parent compound was still present. Interestingly, the high efflux rates as determined in the MDCK mdr1 assay, do not seem to be predictive with respect to intestinal uptake or liver metabolism. A similar observation has been recently reported in the context of our studies on various pyridyl-Ala substituted cyclic hexapeptides [27]. According to this investigation, the clearance measured upon i.v. administration provides a better predictability for oral exposures than the in-vitro permeability assays, indicating metabolism to represent the main driver for exposure upon oral delivery for these peptides. In summary, we argue that there is a certain window for permeability, which needs to be matched as a prerequisite for achieving high oral bioavailability.
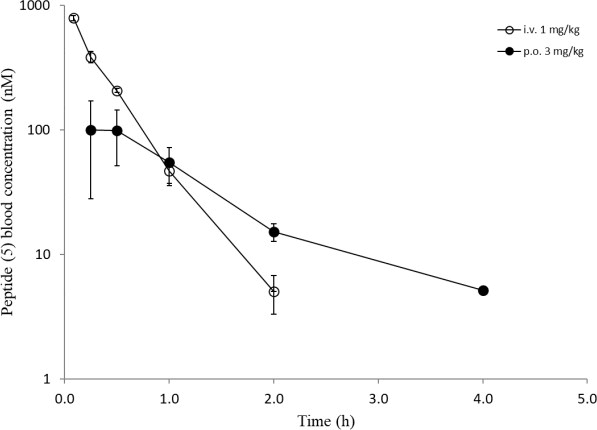
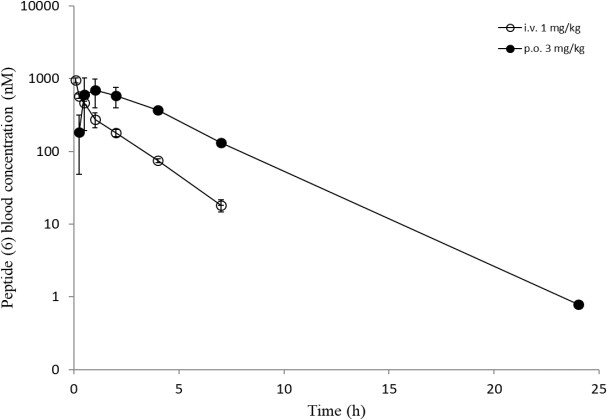
Figure 8: In-vivo data (i.v. and p.o.) of peptides ((5), upper) and ((6), lower).
However, by no means, does an excellent permeability necessarily lead to high systemic exposures. Unfortunately, microsomal assays have their own limitations for a proper ranking of compounds regarding improvements achieved on the metabolic properties. However, once a peptide has been optimized for permeability, managing metabolic hot spots may become a more challenging task. In other words, regarding excellent systemic exposures upon oral administration, for cyclic and proteolytically inert peptides more metabolically stable modifications may outweigh slightly unfavorable properties with respect to permeability. These findings are supported by a recent publication, in which permeability, microsomal clearance and rat in-vivo data were compared for quite similar mirror image cyclic hexapeptides [28]. Although peptides 3 and 4 in this previously mentioned publication showed similar PAMPA values, quite a different systemic exposure was observed in-vivo. Qualitatively, a longer half-life in RLMs corresponded to a higher systemic exposure on p.o. administration.
Conclusion
As pointed out above, there is a need to consider the influence of metabolism for macromolecules once they have attained sufficient permeability properties to cross the intestinal barrier. Thus, the identification of metabolic hotspots early in the drug development process becomes a necessity for macromolecules to be delivered by the oral route. Microsomal assays may provide a black and white answer to this problem, but in our hands, they are currently not suited to enable a proper ranking of closely related cyclic peptides regarding their susceptibility for liver metabolism. As exemplified for the Pro and Leu residues, simple modifications, either incorporating 2 fluorine atoms or introducing the cyclo-propyl moiety lead to isosteres, which are metabolically completely inert at least in the context of the studies we have presented. In order to expand the collection of metabolically stable building blocks, a validation of any isosteres for these or other amino acids would be of value in generating a toolbox to be able to modulate metabolic properties, ideally without compromising potency and selectivity.
More studies are required to gain insights into the susceptibility of certain residues for metabolism, either dependent on their neighboring environment and/or on the dynamics and flexibility of the underlying scaffold. In addition, improvements on the transport across the intestinal barrier, e.g. by engaging active transport processes or by particular formulations to encourage passive uptake, could be synergistic with molecular property modification. More efforts in these directions will contribute decisively to streamlining the development of orally bioavailable therapeutic peptides.
Abbreviations
Standard abbreviations for amino acids and peptide derivatives are according to the suggestion of the IUPAC-IUB Joint commission on Biochemistry Nomenclature: Eur. J. Biochem. 138 (1984) 9-37. ADME, absorption, distribution, metabolism, and excretion; AUC, area under the curve; %BAV, bioavailability on p.o. administration; CL, in vitro or in vivo clearance; Clint, in vitro intrinsic clearance; Cmax, observed maximum concentration in blood; Cpa, cyclopropyl-Ala; CYP, cytochrome P450 enzyme; d.n., dose normalized; DiF-D-Pro , 4,4 difluoro-D-Pro; i.v., intravenous; kmic, in vitro elimination-rate constant, LLOQ, lower limit of quantification; MDCK, Madin Darby canine kidney cells; HLM, human liver microsomes; MRT, mean residence time; PAMPA, Parallel Artificial Membrane Permeability Assay; PK, pharmacokinetics; p.o., per os; RLM, rat liver microsomes; SAPSA, solvent-accessible polar surface area; SFC, supercritical fluid chromatography; t1/2, in vitro half-life T1/2 term, terminal half-life for elimination; Tmax, time of observed maximal blood concentration; UPLC-MS, ultra-high pressure liquid chromatography; Vss, apparent volume of distribution at steady state.
Acknowledgements
We would like to acknowledge the contributions of Isabelle Adam, Jerome Andre, Norbert Domange, Alfred Fredenhagen, Raphael Gattlen, Daniel Gosling, Christian Guenat, Mathieu Ligibel, Alex Marziale, Dieter Oser, Stephanie Pickett, Emine Sager, Stephane Rodde and Mina Sellak.
Conflicts of Interest
None.
Article Info
Article Type
Research ArticlePublication history
Received: Mon 16, Dec 2019Accepted: Thu 02, Jan 2020
Published: Thu 30, Jan 2020
Copyright
© 2023 Thomas Vorherr. This is an open-access article distributed under the terms of the Creative Commons Attribution License, which permits unrestricted use, distribution, and reproduction in any medium, provided the original author and source are credited. Hosting by Science Repository.DOI: 10.31487/j.AJMC.2019.01.01
Figures & Tables
Table 1: Overview of In-Vitro Parameters.
|
Peptide |
Structure |
SAPSA (Å2) |
SFC (min) |
Sol. pH=6.8 [mM] |
Log PAMPA (pH 6.8) [m/s] |
Class |
|
(1) |
[Ala-Leu-NMe-D-Leu-NMe-Leu-Leu-D-Pro] |
84 ± 12 |
2.83 |
>1 |
-4.8 |
H |
|
(2) |
[Ala-Leu-NMe-D-Leu-NMe-Leu-Cpa-D-Pro] |
91 ± 12 |
3.01 |
>1 |
-5.3 |
M |
|
(3) |
[Ala-Leu-NMe-D-Leu-NMe-Cpa-Leu-D-Pro] |
87 ± 11 |
2.98 |
0.98 |
-5.0 |
H |
|
(4) |
[Ala-Leu-NMe-D-Leu-NMe-Cpa-Cpa-D-Pro] |
90 ± 12 |
3.07 |
0.23 |
-5.0 |
M |
|
(5) |
[Ala-Cpa-NMe-D-Cpa-NMe-Cpa-Cpa-D-Pro] |
91 ± 13 |
3.60 |
0.44 |
-6.1 |
L |
|
(6) |
[Ala-Cpa-NMe-D-Cpa-NMe-Cpa-Cpa-DiF-D-Pro] |
92 ± 13 |
3.15 |
0.39 |
-5.3 |
M |
Table 2: Overview of MDCK Parameters.
|
Peptide |
Structure |
MDCK mdr1 (A-B) ± SD [10-6 cm/s] |
MDCK mdr1 (B-A) ± SD [10-6 cm/s] |
MDCK mdr1 Ratio (BA/AB) |
MDCK-LE (A-B) ± SD [10-6 cm/s] |
|
(1) |
[Ala-Leu-NMe-D-Leu-NMe-Leu-Leu-D-Pro] |
0.24 ± 0.06 |
12.7 ± 1.89 |
52.9 |
8.04 ± 0.27 |
|
(2) |
[Ala-Leu-NMe-D-Leu-NMe-Leu-Cpa-D-Pro] |
0.15 ± 0.20 |
8.3 ± 1.21 |
55.3 |
5.02 ± 0.23 |
|
(3) |
[Ala-Leu-NMe-D-Leu-NMe-Cpa-Leu-D-Pro] |
0.24 ± 0.03 |
12.6 ± 1.60 |
52.5 |
6.23 ± 1.05 |
|
(4) |
[Ala-Leu-NMe-D-Leu-NMe-Cpa-Cpa-D-Pro] |
0.12 ± 0.01 |
15.0 ± 1.19 |
125 |
5.04 ± 0.54 |
|
(5) |
[Ala-Cpa-NMe-D-Cpa-NMe-Cpa-Cpa-D-Pro] |
0.21 ± 0.04 |
11.6 ± 1.90 |
55.2 |
1.42 ± 0.01 |
|
(6) |
[Ala-Cpa-NMe-D-Cpa-NMe-Cpa-Cpa-DiF-D-Pro] |
0.21 ± 0.01 |
15.8 ± 1.53 |
75.3 |
1.85 ± 0.10 |
Table 3: Microsome data and scaling to hepatic clearance.
|
|
|
HLM |
RLM |
HLM scaled |
RLM scaled |
Rat in vivo |
|
Peptide |
Structure |
CL(int.)±SE [uL/min/106cells] |
CL(int.)±SE [uL/min/106cells] |
hepatic CL [mL/min/kg] a) |
hepatic CL [mL/min/kg] a) |
CL[mL/mi n/kg] |
|
(1) |
[Ala-Leu-NMe-D-Leu-NMe-Leu-Leu-D-Pro] |
286 ± 64 |
130± 9 |
19.7 |
73.7 |
85 ± 7 |
|
(2) |
[Ala-Leu-NMe-D-Leu-NMe-Leu-Cpa-D-Pro] |
425 ± 13 |
314 ± 14 |
20.0 |
87.2 |
|
|
(3) |
[Ala-Leu-NMe-D-Leu-NMe-Cpa-Leu-D-Pro] |
385 ± 16 |
271 ± 16 |
19.9 |
85.4 |
|
|
(4) |
[Ala-Leu-NMe-D-Leu-NMe-Cpa-Cpa-D-Pro] |
368 ± 5 |
> 700 |
19.9 |
93.8 |
|
|
(5) |
[Ala-Cpa-NMe-D-Cpa-NMe-Cpa-Cpa-D-Pro] |
108 ± 14 |
301 ± 15 |
18.2 |
86.7 |
76 ± 3 |
|
(6) |
[Ala-Cpa-NMe-D-Cpa-NMe-Cpa-Cpa-DiF-D-Pro] |
< 25 |
< 25 |
3.41 |
35.1 |
21 ± 1 |
a) Scaling factors for human/rat microsomal data: 53/54 mg microsomal protein/g liver, 25.7/40 g liver/kg body weight, hepatic CL calculated by well- stirred equation (CLh=Qh*Clint/(Qh+Clint) with human and rat Qh of 20.7/100 mL/min/kg.
Table 4: Detailed PK Parameters (Rat, dose (i.v.): 1mg/kg, dose (p.o.): 3 mg/kg, values are dose normalized, d.n.).
|
Peptide |
Structure |
Exposure (i.v. d.n.) [nmol.h/L] |
Exposure (p.o.d.n.) [nmol.h/L] |
Vss (L/Kg) |
T1/2 (h) |
MRT (h) |
Cmax d.n. (nM) |
Tmax (h) |
BAV (%) |
|
(1) |
[Ala-Leu-NMe-D-Leu-NMe- Leu-Leu-D-Pro] |
304 ± 25 |
15 ± 1 |
3.2±0.5 |
0.5 ± 0 |
0.6±0.1 |
7 ± 3 |
0.3±0.1 |
5 ± 0 |
|
(5) |
[Ala-Cpa-NMe-D-Cpa-NMe- Cpa-Cpa-D-Pro] |
342 ± 13 |
44 ± 12. |
1.5±0.2 |
0.28±0.03 |
0.33±0.3 |
37± 21 |
0.4±0.1 |
13 ± 3 |
|
(6) |
[Ala-Cpa-NMe-D-Cpa-NMe- Cpa-Cpa-DiF-D-Pro] |
1195 ± 59 |
1151±218 |
2.3±0.2 |
1.51±0.19 |
1.83±0.1 |
236±104 |
1.2±0.8 |
96 ±17 |
References
- Vorherr T, Lewis I, Berghausen J, Desrayaud S, Schaefer M (2018) Modulation of oral bioavailability and metabolism for closely related cyclic hexapeptides. Int J Pept Res Ther 24: 35-48. [Crossref]
- Hanlon SP, Friedberg T, Wolf CR, Ghisalba O, Kittelmann M (2007) Recombinant yeast and bacteria that express human P450: Bioreactors for drug discovery, development and biotechnology. In: Schmid RD, Urlacher V, editors. Modern Biooxidations. Enzy react appl
- Schroer K, Kittelmann M, Lütz S (2010) Recombinant human Cytochrome P450 monooxygenases for drug metabolite synthesis. Biotechnol Bioeng 106: 699-706. [Crossref]
- Lewis I, Schaefer M, Wagner T, Oberer L, Sager et al. (2015) A detailed investigation on conformation, permeability and PK properties of two related cyclohexapeptides. Int J Pept Prot Ther 21: 205-221.
- Tatrai P, Schweigler P, Poller B, Domange N, de Wilde R et al. (2019) A systematic in vitro investigation of the inhibitor preincubation effect on multiple classes of clinically relevant transporters. Drug Metab Dispos 47: 768-778. [Crossref]
- Schaefer M, Karplus M (1996) A comprehensive analytical treatment of continuum electrostatics. J Phys Chem B 100: 1578- 1599.
- Sadowski J, Gasteiger J, Klebe G (1994) Comparison of automatic three-dimensional model builders using 639 X-ray structures. J Chem Inf Comput Sci 34: 1000-1008.
- Abagyan RA, Totrov MM, Kuznetsov DN (1994) ICM - a new method for protein modeling and design. Applications to docking and structure prediction from the distorted native conformation. J Comp Chem 15: 488-506.
- Chen J, Brooks CL III, Khandogin J (2008) Recent advances in implicit solvent-based methods for biomolecular simulations. Curr Opin Struct Biol 18: 140-148. [Crossref]
- Brooks BR, Bruccoleri RE, Olafson BD, States DJ, Swaminathan S, Karplus M (1983) CHARMM: a program for macromolecular energy, minimization, and dynamics calculations. J Comp Chem 4: 87-217.
- Richmond TJ (1984) Solvent accessible surface area and excluded volume in proteins. Analytical equations for overlapping spheres and implications for the hydrophobic effect. J Mol Biol 178: 63-89.[Crossref]
- Ertl P, Rohde B, Selzer P (2000) Fast calculation of molecular polar surface area as a sum of fragment-based contributions and its application to the prediction of drug transport properties. J Med Chem 43: 3714-3717. [Crossref]
- Goetz GH, Farrell W, Shalaeva M, Sciabola S, Anderson D et al. (2014) High throughput method for the indirect detection of intramolecular hydrogen bonding. J Med Chem 57: 2920-2929. [Crossref]
- Goetz GH, Philippe L, Shapiro MJ (2014) EPSA: A novel supercritical fluid chromatography technique enabling the design of permeable cyclic peptides. ACS Med Chem Lett 5: 1167-1172. [Crossref]
- von Kienlin M, Moonen CTW, van der Toorn A, van Zijl PCM (1991) Rapid recording of solvent-suppressed 2D COSY spectra with inherent quadrature detection using pulsed field gradients. J Magn Reson 93: 423-429.
- Carpenter TA, Colebrook LD, Hall LD, Pierens GK (1992) Applications of gradient-selective COSY and DQCOSY to brucine and gibberellic acid. Magn Reson Chem 30: 768-773.
- Kay LE, Keifer P, Saarinen T (1992) Pure absorption gradient enhanced heteronuclear single quantum correlation spectroscopy with improved sensitivity. J Am Chem Soc 114: 10663-10665.
- Parella T, Sánchez-Ferrando F, Virgili A (1997) Improved sensitivity in gradient-based 1D and 2D multiplicity-edited HSQC experiments. J Magn Reson 126: 274-277.
- Kupce E (2001) Applications of adiabatic pulses in biomolecular nuclear magnetic resonance. Methods Enzymol 338: 82-111. [Crossref]
- Bax A, Summers MF (1986) 1H and 13C assignments from sensitivity-enhanced detection of heteronuclear multiple-bond connectivity by 2D multiple quantum NMR. J Am Chem Soc 108: 2093-2094.
- Meissner A, Sorensen OW (2000) Economizing spectrometer time and broadband excitation in small-molecule heteronuclear NMR correlation spectroscopy. Broadband HMBC. Magn Reson Chem 38: 981-984.
- Bax A, Davis DG (1985) Practical aspects of two-dimensional transverse NOE spectroscopy. J Magn Reson 63: 207-213.
- Hwang TL, Shaka AJ (1992) Cross relaxation without TOCSY: Transverse rotating-frame Overhauser effect spectroscopy. J Am Chem Soc 114: 3157-3159.
- Bax A, Davis GD (1985) MLEV-17-based two-dimensional homonuclear magnetization transfer spectroscopy. J Magn Reson 65: 355-360.
- Gottlieb HE, Kotlyar V, Nudelman A (1997) NMR Chemical shifts of common laboratory solvents as trace impurities. J Org Chem 62: 7512-7515. [Crossref]
- Burden N, Kendrick J, Knight L, McGregor V, Murphy H et al. (2017) Maximizing the success of bile duct cannulation studies in rats: recommendations for best practice. Lab Anim 51: 457-464. [Crossref]
- Vorherr T, Lewis I, Berghausen J, Huth F, Schaefer M et al. (2019) Pyridyl-Ala modified cyclic hexapeptides: in-vitro and in-vivo profiling for oral bioavailability. Int J Pept Res Ther.
- Lohman RJ, Nielsen DS, Kok WM, Hoang HN, Hill TA et al. (2019) Mirror image pairs of cyclic hexapeptides have different oral bioavailabilities and metabolic stabilities. Chem Commun (Camb) 55:13362-13365. [Crossref]