Low Prognostic Nutritional Index Indicates Dismal Prognosis in Patients with Diffuse Large B Cell Lymphoma
A B S T R A C T
Background: Prognostic nutritional index (PNI) is calculated based on serum albumin concentration and absolute lymphocyte count, and its prognostic value has been established in various human malignancies. However, whether PNI can be applied in predicting the prognosis of patients with diffuse large B-cell lymphoma (DLBCL) remains to be clarified. The aim of the present study is to explore the prognostic value of baseline PNI in DLBCL.
Methods: We retrospectively reviewed the medical records of 98 patients with DLBCL treated at the Southeast University-affiliated Zhongda Hospital between January 2013 and November 2019. The optimal cut-off value of PNI was determined using a receiver operating characteristic (ROC) curve and the Youden index. The relationship of high and low PNI with the clinical characteristics of the patients and prognosis were analyzed.
Results: Patients with low PNI tended to have a worse event-free survival (EFS) and overall survival (OS) (EFS, P=0.029; OS, P<0.001). For patients treated with R-CHOP(Rituximab-cyclophosphamide, doxorubicin, vincristine, and prednisone), PNI proved to be predictive for survival (EFS, P= 0.020; OS, P<0.001), while no significant effect was found in DLBCL patients who received CHOP chemotherapy (EFS, P=0.639; OS, P=0.114). Multivariate analysis showed that PNI was an independent risk factor for OS and EFS of all 98 DLBCL patients after adjusting for model a (OS: adjust for age, gender, body mass index, performance status, B symptoms, international prognostic index, hemoglobin;EFS:adjust for age, gender, Ann Arbor stage, international prognostic index, lactate dehydrogenase, treatment, absolute lymphocyte count, hemoglobin). PNI remained an independent risk factor for both OS and EFS in patients after adjusting for model b (adjust for all items).
Conclusion: PNI is a simple and useful marker to predict survival outcome in DLBCL patients, and low PNI is an independent predictor of a better outcome in terms of EFS and OS outcome in DLBCL, suggesting that PNI is an effective prognostic factor in patients with DLBCL.
Keywords
Diffuse large B-cell lymphoma, prognostic nutritional index, prognosis
Introduction
Diffuse large B-cell lymphoma (DLBCL) is known as the most common subtype of non-Hodgkin lymphoma (NHL), constituting roughly 30% of newly diagnosed NHL cases every year [1]. DLBCL is considered to be a heterogeneous disease characterized by various morphological variations, molecular pathogenesis, genetic abnormalities, and disparate prognosis [2]. In the last decades, the introduction of rituximab into standard CHOP chemotherapy (cyclophosphamide, doxorubicin, vincristine, prednisone) targeting DLBCL patients, has transformed such an aggressive disease from a fatal one to a potentially curable one; yet 20-40 % of patients still die of relapse or refractory disease [3, 4].
Identifying high-risk populations quickly and accurately is important for designing the right treatment and predicting the prognosis of the disease. However, the clinical and genetic heterogeneity of DLBCL poses challenges for patient risk stratification and prognostic modeling.
As a standard prognostic scoring system for predicting the clinical outcomes of patients with DLBCL, the International Prognostic Index (IPI) is based on age, performance status (PS), Ann Arbor stage, the number of extranodal lesions and serum lactate dehydrogenase (LDH) level. In the rituximab era, however, the capability of the IPI to make a prediction of prognosis has shown deterioration [5].
Therefore, such clinical risk stratification models as the revised IPI (R-IPI), the age‑adjusted IPI (aa-IPI), the National Comprehensive Cancer Network IPI (NCCN-IPI) were developed to enhance the capability of clinical prediction for IPI [6-8]. In spite of this, the accuracy of their clinical applications remains less than satisfactory. Some molecular biomarkers and gene signatures with prognostic value have also been identified in DLBCL patients, yet the high cost and technical barrier constraint their routine application in clinical practice [9, 10]. In view of this, cheaply affordable and easily accessible prognostic markers are considered necessary to improve prognostic accuracy for the patients with DLBCL in the era of rituximab.
Recent years have seen a number of pieces of research that malnutrition is of correlation to the poor overall survival (OS) occurring to patients suffering from DLBCL [11-13]. The clinical signs on the DLBCL patients like promptly extending lymph node, extranodal mass or B symptoms, can be explained by the reality that the patients who are undergoing the rapid tumor progress tend to be of more susceptibility to poor nutrition. As a frequently-encountered issue in patients with DLBCL, lymphoma patients with poor nutrition supply is more likely to encounter a growing risk of getting infected with febrile neutropenia, which will cause the dosage of the drug used to be reduced and the outcome of the chemotherapy treatment to be delayed. Despite that poor nutrition has been recognized to be a severe challenge, there is still a lack of a gold standard for the routine assessment of the nutritional status of DLBCL patients.
Luckily, such a parameter as the prognostic nutritional index (PNI) which is objectively easily achieved, has been declared in the report in recent years, which has been proved practical for nutritional status estimation on NHL [14, 15]. PNI is a nutritional evaluation index established by Onodera et al. [16]. It is calculated from serum albumin and blood lymphocyte count and is widely used in the nutritional evaluation and surgical risk prediction of surgical patients. Recent studies have found that PNI, as an indicator reflecting the nutritional and immune status of patients, can be used to predict the clinical outcome of patients with various malignant tumors, and has nothing to do with the location and origin of tumors [14, 17-20].
However, it remains unclear whether PNI is effective as a prognostic marker for DLBCL patients, particularly for those receiving R-CHOP treatment. Therefore, this retrospective study was carried out to determine the prognostic value of PNI in patients with DLBCL.
Patients and Methods
I Patients and Treatment
The study was approved by the Clinical Research Ethical Committee of the Southeast University-affiliated Zhongda Hospital. 98 newly diagnosed DLBCL patients in the Southeast University-affiliated Zhongda between January 2013 and December 2019 were enrolled in the current study, with written consent obtained from each and every one of the subjects allowing the use of their medical records. All patients who were diagnosed according to the 2008 World Health Organization (WHO) classification [21]. Patients who had transformed lymphoma, primary central nervous system lymphoma, primary mediastinal B-cell lymphoma, active infection at the beginning of therapy and missing values for IPI were excluded. All patients were treated with either CHOP (cyclophosphamide, doxorubicin, vincristine, and prednisone) or R-CHOP (rituximab plus CHOP) regimens chemotherapy.
II Data Gathering
Basic clinical parameters were collected of 98 cases including age, gender, performance status (PS) (0–4), Ann Arbor stage (I–IV), cell of origin, B symptoms, serum lactate dehydrogenase (LDH) levels, International Prognostic Index (IPI), extranodal involvement, body mass index (BMI), fibrinogen level, serum albumin and absolute lymphocyte count, as well as chemotherapy regimens. OS was measured from the date of diagnosis until the date of death due to any cause or until the date of the last follow-up. The last date of follow-up until December 2019, and patients who were still alive at the end of the follow-up were treated with censored data for analysis. Event-free survival (EFS) from the date of diagnosis to one of the following events, including, for example, disease progression, patients initiating other methods of anti-lymphoma treatment, disease recurrence or death (regardless of cause). Follow up data were obtained from clinical records or by telephone calls patients themselves or their relatives.
III Definition
Peripheral lymphocyte count and serum albumin concentration were collected at the time of diagnosis in the electronic records and were reviewed in this study. The PNI was calculated according to the formula: PNI = albumin (g/L) + 5 × total lymphocyte count × 109/L [16, 22]. The high and low PNI score was determined by cut-off value in the receiver operating characteristic (ROC) curve. International prognostic index (IPI) score was calculated based on age, serum LDH level, ECOG performance status, Ann Arbor stage and number of extranodal sites at diagnosis as previously described [7]. The patients were divided into GCB (germinal center B-cell like) and non-GCB subtypes using the algorithm proposed by Hans et al. [23].
IV Statistical Analysis
Patient characteristics were summarized using descriptive statistics, which included frequency counts, median, standard deviation (SD) and range. Continuous variables were compared by the T-test, and categorical variables were compared between groups using the χ2 test. Statistical significance was accepted at P < 0.05. The optimal cut-off value of PNI in the prediction of survival was decided by conducting the receiver operating curve (ROC) analysis. The PNI value at the point with a maximum Youden index (Youden index = sensitivity + specificity − 1) was determined as the optimal cut-off value [24]. The analyzed outcome included the EFS and OS. OS and EFS were assessed using the Kaplan–Meier method and were compared between different groups using the log-rank test.
Multivariate analysis was conducted by using the Cox regression model. The multivariate analysis was performed by two models. Model a was performed by those items with p-value less than 0.1 in univariate analysis, age and gender and model b includes all items. All tests were two-sided and statistical significance was accepted at the level of p-value <0.05. Statistical analysis was conducted using the statistical software package for social sciences (SPSS, version 18.0, IBM, Chicago, Illinois, USA).
Results
I Identification of the Optimal Cut-Off Value for PNI
Median serum albumin was 38.43 mg/ dl (range24.8– 62.4mg/dL) and median total lymphocyte count was 1.40 × 10⁹/L (0.28–3.12 × 10⁹/L). The median PNI value was 45.06, with a range from 28.65 to 69. The most discriminative cut-off value of PNI selected by the ROC analysis was 33.4 (sensitivity 100% and specificity 41.2 %, AUC value = 0.713, 95 % CI 0.574 – 0.852, p =0.006) (Figure 1). In view of the cutoff value of PNI, 7 patients (7%) were categorized into the low-PNI group, whereas the other 91 patients (93 %) were categorized into the high-PNI group.
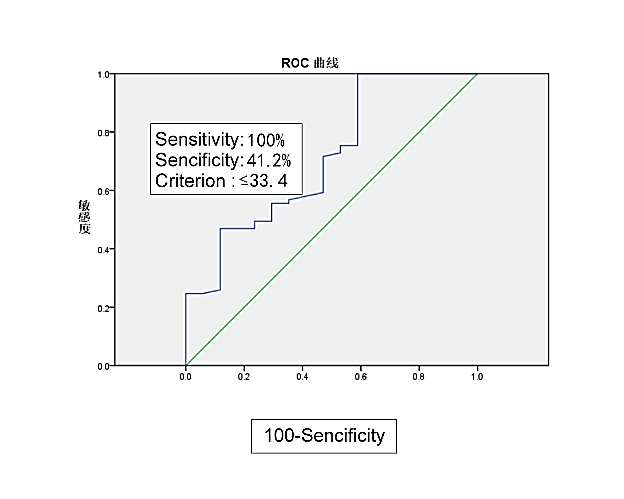
Figure 1: Cut-off value of PNI level according to receiver operating characteristic curve (ROC).
Table 1: Baseline characteristics of DLBCL patients according to PNI.
|
Characteristic |
Prognostic nutritional index |
P value |
|
|
High ≥33.4 |
Low <33.4 |
||
|
Age (years) |
0.737 |
||
|
<60 |
45 (49.5%) |
3 (42.9%) |
|
|
≥60 |
46 (50.5%) |
4 (57.1%) |
|
|
Gender |
0.436 |
||
|
Female |
46 (50.5%) |
2 (28.6%) |
|
|
Male |
45 (49.5%) |
5 (71.4%) |
|
|
Body mass index (Kg/m2) |
23.4 ± 3.6 |
22.1 ± 2.8 |
0.379 |
|
Performance status |
0.233 |
||
|
<2 |
41 (45.1%) |
1 (14.3%) |
|
|
≥2 |
50 (54.9%) |
6 (85.7%) |
|
|
Ann Arbor stage |
0.048 |
||
|
Ⅰ or Ⅱ |
35 (38.5%) |
0 (0.0%) |
|
|
Ⅲ or Ⅳ |
56 (61.5%) |
7 (100.0%) |
|
|
B symptoms |
0.049 |
||
|
No |
51 (56.0%) |
1 (14.3%) |
|
|
Yes |
40 (44.0%) |
6 (85.7%) |
|
|
Extranidal disease |
1.000 |
||
|
No |
27 (29.7%) |
2 (28.6%) |
|
|
Yes |
64 (70.3%) |
5 (71.4%) |
|
|
International prognostic index |
0.004 |
||
|
0-2 |
76 (83.5%) |
2 (28.6%) |
|
|
3-5 |
15 (16.5%) |
5 (71.4%) |
|
|
Lactate dehydrogenase |
0.462 |
||
|
Normal |
41 (45.1%) |
2 (28.6%) |
|
|
Elevated |
50 (54.9%) |
5 (71.4%) |
|
|
Cell-of-origin subtype |
1.000 |
||
|
Germinal center type |
23 (27.7%) |
1 (16.7%) |
|
|
Non-germinal center type |
60 (72.3%) |
5 (83.3%) |
|
|
Treatment |
1.000 |
||
|
CHOP |
24 (26.4%) |
2 (28.6%) |
|
|
R-CHOP |
67 (73.6%) |
5 (71.4%) |
|
|
Albumin |
<0.001 |
||
|
≥35 g/L |
71 (78.0%) |
0 (0.0%) |
|
|
<35 g/L |
20 (22.0%) |
7 (100.0%) |
|
|
Absolute lymphocyte count |
0.001 |
||
|
≥1.0 × 10⁹/L |
71 (78.0%) |
1 (14.3%) |
|
|
<1.0 × 10⁹/L |
20 (22.0%) |
6 (85.7%) |
|
|
Fibrinogen level (g/L) |
4.1 ± 0.8 |
3.5 ± 1.3 |
0.071 |
|
Red blood cells(1.0 × 10¹²/L) |
4.2 ± 0.6 |
3.2 ± 1.1 |
<0.001 |
|
Hemoglobin (g/L) |
123.9± 17.3 |
83.4 ± 19.3 |
<0.001 |
II Demographic Characteristics of Patients
Overall, 98 newly diagnosed DLBCL patients were included in this study. In this study, 50 patients (51%) were male. The median age of the patients at diagnosis was 74 years old (range 26–89), and 48 patients (48.9%) were under 60 years old. IPI score≤2 was found in 79.6% of patients, and PS score ≥2 was found in 57.1% of patients. There were 46 patients (46.9%) with B symptoms and 69 patients (70.4%) with extranodal involvement.
Low PNI was associated with albumin (p < 0.001), absolute lymphocyte count (p = 0.001), hemoglobin (p < 0.001), fibrinogen level (p = 0.071), advanced Ann Arbor stage (p = 0.048), B symptoms (p = 0.049), and higher IPI score (p = 0.004). No statistical correlation was observed between PNI and gender, age, body mass index (BMI), performance status, white blood cell(WBC), absolute monocytes count(AMC), absolute neutrophil count(ANC), Platelet (PLT), β2-mg, red blood cell (RBC), lactate dehydrogenase (LDH), treatment, cell of origin subtypes and the presence of extranodal sites. Baseline characteristics of these patients are listed in (Table 1).
III Survival Analysis
Patients with low PNI is closely associated with poor OS (p < 0.001, Figure 2A) and EFS (p = 0.029, Figure 3A), in comparison with those with high PNI. Further analysis was performed to explore the predictive value of PNI in DLBCL patients treated with different chemotherapy regimens. We found that low PNI patients had significantly shorter OS (p < 0.001, Figure 2C) and EFS (p = 0.020, Figure 3C) than those with high PNI who received R-CHOP treatment, while no significant different OS was found in patients treated with CHOP (OS, p = 0.114, Figure 2B; EFS, p = 0.639, Figure 3B).
Table 2: Univariable logistic regression analysis for event free survival in patients with DLBCL.
|
Characteristic |
Statistics [n(%)] |
Event-free Survival |
|
|
HR (95%CI) |
P value |
||
|
Age (years) |
0.598 |
||
|
<60 |
47 (48.5%) |
1.0 |
|
|
≥60 |
50 (51.5%) |
0.9 (0.5, 1.4) |
|
|
Gender |
0.150 |
||
|
Female |
48 (49.5%) |
1.0 |
|
|
Male |
49 (50.5%) |
1.4 (0.9, 2.3) |
|
|
Body mass index (Kg/m2) |
23.3 ± 3.5 |
1.0 (0.9, 1.0) |
0.345 |
|
Performance status |
0.899 |
||
|
<2 |
42 (43.3%) |
1.0 |
|
|
≥2 |
55 (56.7%) |
1.0 (0.6, 1.6) |
|
|
Ann Arbor stage |
0.016 |
||
|
Ⅰ or Ⅱ |
35 (36.1%) |
1.0 |
|
|
Ⅲ or Ⅳ |
62 (63.9%) |
1.9 (1.1, 3.2) |
|
|
B symptoms |
0.124 |
||
|
No |
52 (53.6%) |
1.0 |
|
|
Yes |
45 (46.4%) |
1.5 (0.9, 2.3) |
|
|
Extranidal disease |
0.593 |
||
|
No |
29 (29.9%) |
1.0 |
|
|
Yes |
68 (70.1%) |
1.2 (0.7, 1.9) |
|
|
International prognostic index |
0.031 |
||
|
0-2 |
78 (80.4%) |
1.0 |
|
|
3-5 |
19 (19.6%) |
1.8 (1.1, 3.2) |
|
|
Lactate dehydrogenase |
0.007 |
||
|
Normal |
43 (44.3%) |
1.0 |
|
|
Elevated |
54 (55.7%) |
2.0 (1.2, 3.3) |
|
|
Cell-of-origin subtype |
0.493 |
||
|
Germinal center type |
24 (27.3%) |
1.0 |
|
|
Non-germinal center type |
64 (72.7%) |
1.2 (0.7, 2.1) |
|
|
Treatment |
0.002 |
||
|
CHOP |
25 (25.8%) |
1.0 |
|
|
R-CHOP |
72 (74.2%) |
0.4 (0.3, 0.7) |
|
|
Prognostic nutritional index |
0.027 |
||
|
High |
90 (92.78%) |
1.0 |
|
|
Low |
7 (7.22%) |
2.3 (1.1, 5.2) |
|
|
Albumin |
0.231 |
||
|
≥35 g/L |
70 (72.2%) |
1.0 |
|
|
<35 g/L |
27 (27.8%) |
0.7 (0.4, 1.2) |
|
|
Absolute lymphocyte count |
<0.001 |
||
|
≥1.0 × 10⁹/L |
71 (73.2%) |
1.0 |
|
|
<1.0 × 10⁹/L |
26 (26.8%) |
2.6 (1.5, 4.4) |
|
|
Fibrinogen level (g/L) |
4.1 ± 0.9 |
0.9 (0.7, 1.2) |
0.464 |
|
Red blood cells(1.0 × 10¹²/L) |
4.2 ± 0.7 |
0.8 (0.5, 1.2) |
0.232 |
|
Hemoglobin (g/L) |
121.0 ± 20.4 |
1.0 (1.0, 1.0) |
0.053 |
Multivariate analysis showed that PNI (low vs. high) was a significant marker for predicting OS [p = 0.009, hazard ratio (HR) 4.9, 95 % confidence interval (CI) 1.5–16.2] and EFS (p = 0.027, HR 2.9, 95 % CI 1.1–7.6) for all the patients after adjusting for model a ( OS: adjusted for age, gender, BMI, PS, B symptoms, IPI, hemoglobin; EFS: adjusted for age, gender, Ann Arbor stage, IPI, LDH, treatment, ALC, hemoglobin).PNI (low vs. high) is regarded as an independent risk factor for both OS (p = 0.035, HR 21.3, 95 % CI 1.2– 366.6) and EFS (p = 0.001, HR 6.5,95 % CI 2.1– 20.0) in patients when adjusted for model b (adjust for all items). The results of multivariate survival analysis were shown in (Tables 2-5).
Table 3: Cox regression for event free survival.
|
Groups |
Univariable Analysis |
|
Multivariable Analysis[HR (95%CI)] |
||||||||
|
HR (95%CI) |
P value |
|
|
Model 1a |
P value |
Model 2b |
P value |
||||
|
PNI-High |
1.0 |
|
1.0 |
|
1.0 |
|
|||||
|
PNI-Low |
2.3 (1.1, 5.2) |
0.036 |
2.9 (1.1, 7.6) |
0.027 |
6.5 (2.1, 20.0) |
0.001 |
|||||
Table 4: Univariable logistic regression analysis for overall survival in patients with DLBCL.
|
Characteristic |
Statistics s[n(%)] |
Overall survival |
|
|
HR (95%CI) |
P value |
||
|
Age (years) |
0.685 |
||
|
<60 |
48 (49.0%) |
1.0 |
|
|
≥60 |
50 (51.0%) |
1.2 (0.5, 3.2) |
|
|
Gender |
0.258 |
||
|
Female |
48 (49.0%) |
1.0 |
|
|
Male |
50 (51.0%) |
1.8 (0.7, 4.8) |
|
|
Body mass index (Kg/m2) |
23.3 ± 3.5 |
0.8 (0.7, 1.0) |
0.038 |
|
Performance status |
0.033 |
||
|
<2 |
42 (42.9%) |
1.0 |
|
|
≥2 |
56 (57.1%) |
5.0 (1.1, 22.0) |
|
|
Ann Arbor stage |
0.267 |
||
|
Ⅰ or Ⅱ |
35 (35.7%) |
1.0 |
|
|
Ⅲ or Ⅳ |
63 (64.3%) |
1.9 (0.6, 5.8) |
|
|
B symptoms |
0.014 |
||
|
No |
52 (53.1%) |
1.0 |
|
|
Yes |
46 (46.9%) |
4.1 (1.3, 12.6) |
|
|
Extranodal disease |
0.617 |
||
|
No |
29 (29.6%) |
1.0 |
|
|
Yes |
69 (70.4%) |
0.8 (0.3, 2.1) |
|
|
International prognostic index |
<0.001 |
||
|
0-2 |
78 (79.6%) |
1.0 |
|
|
3-5 |
20 (20.4%) |
7.4 (2.8, 19.5) |
|
|
Lactate dehydrogenase |
0.188 |
||
|
Normal |
43 (43.9%) |
1.0 |
|
|
Elevated |
55 (56.1%) |
2.0 (0.7, 5.7) |
|
|
Cell-of-origin subtype |
0.410 |
||
|
Germinal center type |
24 (27.0%) |
1.0 |
|
|
Non-germinal center type |
65 (73.0%) |
1.7 (0.5, 6.0) |
|
|
Treatment |
0.164 |
||
|
CHOP |
26 (26.5%) |
1.0 |
|
|
R-CHOP |
72 (73.5%) |
0.5 (0.2, 1.3) |
|
|
Prognostic nutritional index |
<0.001 |
||
|
High |
91 (92.86%) |
1.0 |
|
|
Low |
7 (7.14%) |
8.7 (3.3, 22.9) |
|
|
Albumin |
0.123 |
||
|
≥35 g/L |
71 (72.4%) |
1.0 |
|
|
<35 g/L |
27 (27.6%) |
2.1 (0.8, 5.5) |
|
|
Absolute lymphocyte count |
0.496 |
||
|
≥1.0 × 10⁹/L |
72 (73.5%) |
1.0 |
|
|
<1.0 × 10⁹/L |
26 (26.5%) |
1.4 (0.5, 3.8) |
|
|
Fibrinogen level (g/L) |
4.1 ± 0.9 |
1.0 (0.6, 1.8) |
0.936 |
|
Red Blood Cells(1.0 × 10¹²/L) |
4.2 ± 0.7 |
0.6 (0.3, 1.3) |
0.190 |
|
Hemoglobin (g/L) |
121.0 ± 20.3 |
1.0 (1.0, 1.0) |
0.020 |
Table 5: Cox regression for overall survival.
|
|
Univariable Analysis |
|
Multivariable Analysis |
||||||
|
HR (95%CI) |
P value |
|
Model 1a HR (95%CI) |
P value |
Model 2b HR (95%CI) |
P value |
|||
|
PNI-High |
1.0 |
|
1.0 |
|
1.0 |
|
|||
|
PNI-Low |
8.7 (3.3, 22.9) |
<0.001 |
4.9 (1.5, 16.2) |
0.009 |
21.3 (1.2, 366.6) |
0.035 |
|||
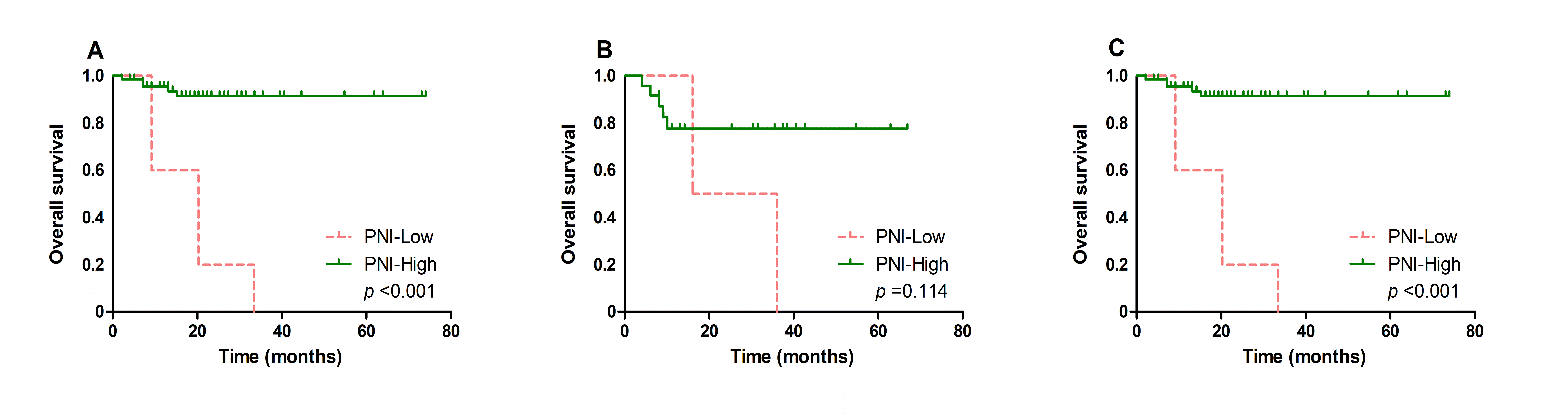
Figure 2: Kaplan-Meier survival analysis of overall survival according to different treatment. Overall survival A) according to PNI in all DLBCL patients, B) according to PNI in DLBCL patients treated with CHOP and C) according to PNI in DLBCL patients treated with RCHOP.
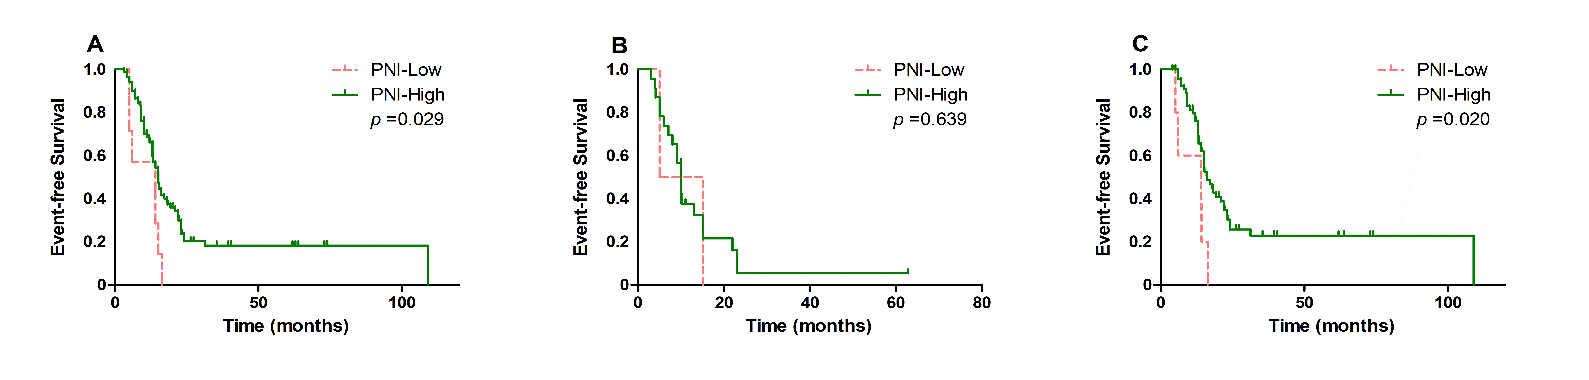
Figure 3: Kaplan-Meier survival analysis of event-free survival according to different treatment. A) event-free survival according to PNI in all DLBCL patients, B) according to PNI in DLBCL patients treated with CHOP and C) according to PNI in DLBCL patients treated with RCHOP.
Discussion
Thanks to the addition of rituximab into conventional CHOP regimens to produce R-CHOP, the clinical outcome of DLBCL patients had been improved considerably. Nevertheless, the discriminatory power of IPI in DLBCL has been somewhat compromised. Numerous novel molecular biomarkers have shown enhanced discrimination for the risk stratifications of DLBCL, yet these approaches are expensive and manifest stern technological barriers, and therefore are not standardized in clinical practice. Researchers have been making progress in identifying surrogate biomarkers that can well serve the role of a prognostic tool. Here, we examine the prognostic value of PNI in DLBCL patients and found a low PNI was significantly associated with poor prognosis. Thusly, we demonstrate that PNI could be applied as a simple, promising and independent prognostic predictor for patients with DLBCL.
Previous investigators explored the relationship between the PNI index and the prognosis of DLBCL patients. Inconsistent clinical outcomes were reported between the patients who were treated with R-CHOP or R-CHOP-like regimen and those who were treated with R-CHOP or CHOP regimen [25-29]. Although all the researchers found that lower PNI is associated with poor outcomes in patients with DLBCL, not all demonstrated statistically significant differences concerning the clinical outcomes based on PNI. 2 articles showed there was no significant difference between survival and PNI in the multivariate analyses [27, 29]. Vlatka Periˇsa et al. demonstrated PNI as an independent prognostic factor that responds to treatment; 3 articles demonstrated statistically significant difference for OS( HR=2.177 P<0.001, HR=4.24 p=0.008, HR=2.340 P=0.002 ) and PFS(HR=2.028 P=0.001, HR=4.007 P=0.006, HR=1.595 P= 0.031) based on PNI [25, 26, 28]. Therefore, we performed this retrospective analysis to explore whether PNI can be used as a prognostic indicator of DLBCL.
Despite the identification of the prognostic value of PNI across plenty of recently conducted researches, the rationale of PNI as a prognostic factor is still worthy of in-depth investigation. Lymphocytes are mainly involved in the identification and elimination of tumor cells in the body. The decrease of lymphocytes can cause host immune deficiency, which is beneficial to tumor proliferation and metastasis. Apart from that, Lymphocytes are possibly needed for R-mediated, antibody-dependent cell-mediated cytotoxicity in killing off malignant B cells [30]. Therefore, it is speculated that lymphopenia could affect the effectiveness of R. Therefore, lymphopenia is expected to be a negative prognostic factor in patients with DLBCL and receiving immunochemotherapy treatment. Clinically, there is research conducted on the difference made by ALC to patients with DLBCL.
A meta-analysis where 1206 DLBCL patients were recruited revealed that the overall hazard ratio of low ALC for OS reaches 2.78 (95% CI, 1.87–4.13, p<0.001) in those receiving R-CHOP treatment [31]. Actually, as evidence builds up, there is an increasing number of clinical parameters being applied to assess ALC, such as platelet /lymphocyte ratio (PLR), neutrophil/lymphocyte Ratio (NLR), and lymphocyte/monocyte Ratio (LMR). Moreover, these markers reportedly play a crucial role in the prognosis of DLBCL patients [32-34].
Recent years have seen more attention is being paid to the roles of nutrition in foretelling the prognosis of cancer patients [35, 36]. The tumor is seemingly a chronic consumption illness, advanced tumors in particular. Besides, the level of serum albumin, which works as a simple surrogate for evaluating protein levels, is working as a mark of nutritional status. Hypoalbuminemia indicates malnutrition. Malnourished patients have poor response and tolerance to treatment and poor prognosis [37, 38].
In addition, there is evidence suggesting that serum albumin is related to the prognosis of DLBCL patients. As suggested by research, age, comorbidities, and Albumin (ACA) index are suitable as an effective tool to assist with the thorough geriatric assessment of elderly DLBCL patients. Moreover, there is a report that the “moderate” to “poor” ACA group showed a higher 2-year treatment-related mortality rate and lower survival rate relative to the excellent to good ACA group [39]. Additionally, it has been confirmed that The Glasgow Prognostic Score (GPS) incorporating C-reactive protein and albumin and albumin to globulin ratio (AGR) are clinically applicable as the prognostic markers of DLBCL treated with R-CHOP regimen [29, 40].
Moreover, the serum albumin level is usually revealed to decline under the context of chronic inflammation. In plenty of prior studies, cancer-related inflammatory reaction is more impactful on hypoproteinemia, which is primarily due to the cytokine-induced inhibition of albumin synthesis and its further decomposition [40, 41]. Since each parameter of PNI is associated with prognosis, we demonstrate that PNI is an appropriate prognostic factor in patients with DLBCL. A limitation of the study is that it has a retrospective design and was conducted in a single center with a relatively small number of patients. In spite of these limitations, PNI could be more conveniently and rapidly performed in routine clinical practice by examining blood cell counts and serum biochemical to help predict the outcome of DLBCL patients.
In conclusion, this retrospective study evaluated the prognostic significance of PNI in DLBCL patients. Although its efficacy needs to be confirmed prospectively, our data suggest that the low PNI predicts poor prognosis in DLBCL patients treated with R-CHOP. Further studies are needed to confirm our findings and investigate the underlying mechanisms between PNI and clinical outcome.
Conflicts of Interest
None.
Ethical Approval
All procedures performed in studies involving human participants were in accordance with the ethical standards of the institutional and/or national research committee and with the 1964 Helsinki declaration and its later amendments or comparable ethical standards.
Informed Consent
This study is a retrospective analysis without any intervention and thus informed consent is waived.
Acknowledgement
This work was supported by the Standardized Treatment of Recurrent and Refractory Leukemia in Jiangsu Province (number: BL2014078), the Key Medical Projects of Jiangsu Province (ZDXKB2016020), the Foundation for Basic Scientific Research of Southeast University (3290008413) and the National Natural Science Foundation of China (81800197).
Article Info
Article Type
Research ArticlePublication history
Received: Fri 17, Apr 2020Accepted: Mon 04, May 2020
Published: Fri 08, May 2020
Copyright
© 2023 Baoan Chen. This is an open-access article distributed under the terms of the Creative Commons Attribution License, which permits unrestricted use, distribution, and reproduction in any medium, provided the original author and source are credited. Hosting by Science Repository.DOI: 10.31487/j.COR.2020.05.01
Figures & Tables
Table 1: Baseline characteristics of DLBCL patients according to PNI.
|
Characteristic |
Prognostic nutritional index |
P value |
|
|
High ≥33.4 |
Low <33.4 |
||
|
Age (years) |
0.737 |
||
|
<60 |
45 (49.5%) |
3 (42.9%) |
|
|
≥60 |
46 (50.5%) |
4 (57.1%) |
|
|
Gender |
0.436 |
||
|
Female |
46 (50.5%) |
2 (28.6%) |
|
|
Male |
45 (49.5%) |
5 (71.4%) |
|
|
Body mass index (Kg/m2) |
23.4 ± 3.6 |
22.1 ± 2.8 |
0.379 |
|
Performance status |
0.233 |
||
|
<2 |
41 (45.1%) |
1 (14.3%) |
|
|
≥2 |
50 (54.9%) |
6 (85.7%) |
|
|
Ann Arbor stage |
0.048 |
||
|
Ⅰ or Ⅱ |
35 (38.5%) |
0 (0.0%) |
|
|
Ⅲ or Ⅳ |
56 (61.5%) |
7 (100.0%) |
|
|
B symptoms |
0.049 |
||
|
No |
51 (56.0%) |
1 (14.3%) |
|
|
Yes |
40 (44.0%) |
6 (85.7%) |
|
|
Extranidal disease |
1.000 |
||
|
No |
27 (29.7%) |
2 (28.6%) |
|
|
Yes |
64 (70.3%) |
5 (71.4%) |
|
|
International prognostic index |
0.004 |
||
|
0-2 |
76 (83.5%) |
2 (28.6%) |
|
|
3-5 |
15 (16.5%) |
5 (71.4%) |
|
|
Lactate dehydrogenase |
0.462 |
||
|
Normal |
41 (45.1%) |
2 (28.6%) |
|
|
Elevated |
50 (54.9%) |
5 (71.4%) |
|
|
Cell-of-origin subtype |
1.000 |
||
|
Germinal center type |
23 (27.7%) |
1 (16.7%) |
|
|
Non-germinal center type |
60 (72.3%) |
5 (83.3%) |
|
|
Treatment |
1.000 |
||
|
CHOP |
24 (26.4%) |
2 (28.6%) |
|
|
R-CHOP |
67 (73.6%) |
5 (71.4%) |
|
|
Albumin |
<0.001 |
||
|
≥35 g/L |
71 (78.0%) |
0 (0.0%) |
|
|
<35 g/L |
20 (22.0%) |
7 (100.0%) |
|
|
Absolute lymphocyte count |
0.001 |
||
|
≥1.0 × 10⁹/L |
71 (78.0%) |
1 (14.3%) |
|
|
<1.0 × 10⁹/L |
20 (22.0%) |
6 (85.7%) |
|
|
Fibrinogen level (g/L) |
4.1 ± 0.8 |
3.5 ± 1.3 |
0.071 |
|
Red blood cells(1.0 × 10¹²/L) |
4.2 ± 0.6 |
3.2 ± 1.1 |
<0.001 |
|
Hemoglobin (g/L) |
123.9± 17.3 |
83.4 ± 19.3 |
<0.001 |
Table 2: Univariable logistic regression analysis for event free survival in patients with DLBCL.
|
Characteristic |
Statistics [n(%)] |
Event-free Survival |
|
|
HR (95%CI) |
P value |
||
|
Age (years) |
0.598 |
||
|
<60 |
47 (48.5%) |
1.0 |
|
|
≥60 |
50 (51.5%) |
0.9 (0.5, 1.4) |
|
|
Gender |
0.150 |
||
|
Female |
48 (49.5%) |
1.0 |
|
|
Male |
49 (50.5%) |
1.4 (0.9, 2.3) |
|
|
Body mass index (Kg/m2) |
23.3 ± 3.5 |
1.0 (0.9, 1.0) |
0.345 |
|
Performance status |
0.899 |
||
|
<2 |
42 (43.3%) |
1.0 |
|
|
≥2 |
55 (56.7%) |
1.0 (0.6, 1.6) |
|
|
Ann Arbor stage |
0.016 |
||
|
Ⅰ or Ⅱ |
35 (36.1%) |
1.0 |
|
|
Ⅲ or Ⅳ |
62 (63.9%) |
1.9 (1.1, 3.2) |
|
|
B symptoms |
0.124 |
||
|
No |
52 (53.6%) |
1.0 |
|
|
Yes |
45 (46.4%) |
1.5 (0.9, 2.3) |
|
|
Extranidal disease |
0.593 |
||
|
No |
29 (29.9%) |
1.0 |
|
|
Yes |
68 (70.1%) |
1.2 (0.7, 1.9) |
|
|
International prognostic index |
0.031 |
||
|
0-2 |
78 (80.4%) |
1.0 |
|
|
3-5 |
19 (19.6%) |
1.8 (1.1, 3.2) |
|
|
Lactate dehydrogenase |
0.007 |
||
|
Normal |
43 (44.3%) |
1.0 |
|
|
Elevated |
54 (55.7%) |
2.0 (1.2, 3.3) |
|
|
Cell-of-origin subtype |
0.493 |
||
|
Germinal center type |
24 (27.3%) |
1.0 |
|
|
Non-germinal center type |
64 (72.7%) |
1.2 (0.7, 2.1) |
|
|
Treatment |
0.002 |
||
|
CHOP |
25 (25.8%) |
1.0 |
|
|
R-CHOP |
72 (74.2%) |
0.4 (0.3, 0.7) |
|
|
Prognostic nutritional index |
0.027 |
||
|
High |
90 (92.78%) |
1.0 |
|
|
Low |
7 (7.22%) |
2.3 (1.1, 5.2) |
|
|
Albumin |
0.231 |
||
|
≥35 g/L |
70 (72.2%) |
1.0 |
|
|
<35 g/L |
27 (27.8%) |
0.7 (0.4, 1.2) |
|
|
Absolute lymphocyte count |
<0.001 |
||
|
≥1.0 × 10⁹/L |
71 (73.2%) |
1.0 |
|
|
<1.0 × 10⁹/L |
26 (26.8%) |
2.6 (1.5, 4.4) |
|
|
Fibrinogen level (g/L) |
4.1 ± 0.9 |
0.9 (0.7, 1.2) |
0.464 |
|
Red blood cells(1.0 × 10¹²/L) |
4.2 ± 0.7 |
0.8 (0.5, 1.2) |
0.232 |
|
Hemoglobin (g/L) |
121.0 ± 20.4 |
1.0 (1.0, 1.0) |
0.053 |
Table 3: Cox regression for event free survival.
|
Groups |
Univariable Analysis |
|
Multivariable Analysis[HR (95%CI)] |
||||||||
|
HR (95%CI) |
P value |
|
|
Model 1a |
P value |
Model 2b |
P value |
||||
|
PNI-High |
1.0 |
|
1.0 |
|
1.0 |
|
|||||
|
PNI-Low |
2.3 (1.1, 5.2) |
0.036 |
2.9 (1.1, 7.6) |
0.027 |
6.5 (2.1, 20.0) |
0.001 |
|||||
Table 4: Univariable logistic regression analysis for overall survival in patients with DLBCL.
|
Characteristic |
Statistics s[n(%)] |
Overall survival |
|
|
HR (95%CI) |
P value |
||
|
Age (years) |
0.685 |
||
|
<60 |
48 (49.0%) |
1.0 |
|
|
≥60 |
50 (51.0%) |
1.2 (0.5, 3.2) |
|
|
Gender |
0.258 |
||
|
Female |
48 (49.0%) |
1.0 |
|
|
Male |
50 (51.0%) |
1.8 (0.7, 4.8) |
|
|
Body mass index (Kg/m2) |
23.3 ± 3.5 |
0.8 (0.7, 1.0) |
0.038 |
|
Performance status |
0.033 |
||
|
<2 |
42 (42.9%) |
1.0 |
|
|
≥2 |
56 (57.1%) |
5.0 (1.1, 22.0) |
|
|
Ann Arbor stage |
0.267 |
||
|
Ⅰ or Ⅱ |
35 (35.7%) |
1.0 |
|
|
Ⅲ or Ⅳ |
63 (64.3%) |
1.9 (0.6, 5.8) |
|
|
B symptoms |
0.014 |
||
|
No |
52 (53.1%) |
1.0 |
|
|
Yes |
46 (46.9%) |
4.1 (1.3, 12.6) |
|
|
Extranodal disease |
0.617 |
||
|
No |
29 (29.6%) |
1.0 |
|
|
Yes |
69 (70.4%) |
0.8 (0.3, 2.1) |
|
|
International prognostic index |
<0.001 |
||
|
0-2 |
78 (79.6%) |
1.0 |
|
|
3-5 |
20 (20.4%) |
7.4 (2.8, 19.5) |
|
|
Lactate dehydrogenase |
0.188 |
||
|
Normal |
43 (43.9%) |
1.0 |
|
|
Elevated |
55 (56.1%) |
2.0 (0.7, 5.7) |
|
|
Cell-of-origin subtype |
0.410 |
||
|
Germinal center type |
24 (27.0%) |
1.0 |
|
|
Non-germinal center type |
65 (73.0%) |
1.7 (0.5, 6.0) |
|
|
Treatment |
0.164 |
||
|
CHOP |
26 (26.5%) |
1.0 |
|
|
R-CHOP |
72 (73.5%) |
0.5 (0.2, 1.3) |
|
|
Prognostic nutritional index |
<0.001 |
||
|
High |
91 (92.86%) |
1.0 |
|
|
Low |
7 (7.14%) |
8.7 (3.3, 22.9) |
|
|
Albumin |
0.123 |
||
|
≥35 g/L |
71 (72.4%) |
1.0 |
|
|
<35 g/L |
27 (27.6%) |
2.1 (0.8, 5.5) |
|
|
Absolute lymphocyte count |
0.496 |
||
|
≥1.0 × 10⁹/L |
72 (73.5%) |
1.0 |
|
|
<1.0 × 10⁹/L |
26 (26.5%) |
1.4 (0.5, 3.8) |
|
|
Fibrinogen level (g/L) |
4.1 ± 0.9 |
1.0 (0.6, 1.8) |
0.936 |
|
Red Blood Cells(1.0 × 10¹²/L) |
4.2 ± 0.7 |
0.6 (0.3, 1.3) |
0.190 |
|
Hemoglobin (g/L) |
121.0 ± 20.3 |
1.0 (1.0, 1.0) |
0.020 |
Table 5: Cox regression for overall survival.
|
|
Univariable Analysis |
|
Multivariable Analysis |
||||||
|
HR (95%CI) |
P value |
|
Model 1a HR (95%CI) |
P value |
Model 2b HR (95%CI) |
P value |
|||
|
PNI-High |
1.0 |
|
1.0 |
|
1.0 |
|
|||
|
PNI-Low |
8.7 (3.3, 22.9) |
<0.001 |
4.9 (1.5, 16.2) |
0.009 |
21.3 (1.2, 366.6) |
0.035 |
|||
References
- Teras LR, DeSantis CE, Cerhan JR, Morton LM, Jemal A et al. (2016)2016 US lymphoid malignancy statistics by World Health Organization subtypes. CA Cancer J Clin 66: 443-459. [Crossref]
- Flowers CR, Sinha R, Vose JM (2010) Improving outcomes for patients with diffuse large B-cell lymphoma. CA Cancer J Clin 60: 393-408. [Crossref]
- Sehn LH, Donaldson J, Chhanabhai M, Fitzgerald C, Gill K et al. (2005) Introduction of combined CHOP plus rituximab therapy dramatically improved outcome of diffuse large B-cell lymphoma in British Columbia. J Clin Oncol 23: 5027-5033. [Crossref]
- Coiffier B, Lepage E, Briere J, Herbrecht R, Tilly H et al. (2002) CHOP chemotherapy plus rituximab compared with CHOP alone in elderly patients with diffuse large-B-cell lymphoma. N Engl J Med 346: 235-242. [Crossref]
- Seki R, Ohshima K, Fujisaki T, Uike N, Kawano F et al. (2009) Prognostic impact of immunohistochemical biomarkers in diffuse large B-cell lymphoma in the rituximab era. Cancer Sci 100: 1842-1847. [Crossref]
- Sehn LH, Berry B, Chhanabhai M, Fitzgerald C, Gill K et al. (2007) The revised International Prognostic Index (R-IPI) is a better predictor of outcome than the standard IPI for patients with diffuse large B-cell lymphoma treated with R-CHOP. Blood 109: 1857-1861. [Crossref]
- International Non-Hodgkin's Lymphoma Prognostic Factors Project (1993) A predictive model for aggressive non-Hodgkin's lymphoma. N Engl J Med 329: 987-994. [Crossref]
- Yang Y, Wang L, Ma Y, Han T, Huang M (2017) The Enhanced International Prognostic Index for Diffuse Large B-cell Lymphoma. Am J Med Sci 353: 459-465. [Crossref]
- Salles G, de Jong D, Xie W, Rosenwald A, Chhanabhai M et al.(2011)Prognostic significance of immunohistochemical biomarkers in diffuse large B-cell lymphoma: a study from the Lunenburg Lymphoma Biomarker Consortium. Blood 117: 7070-7078. [Crossref]
- Shipp MA, Ross KN, Tamayo P, Weng AP, Kutok JL et al. (2002) Diffuse large B-cell lymphoma outcome prediction by gene-expression profiling and supervised machine learning. Nat Med 8: 68-74. [Crossref]
- Park S, Han B, Cho JW, Woo SY, Kim S et al. (2014)Effect of nutritional status on survival outcome of diffuse large B-cell lymphoma patients treated with rituximab-CHOP. Nutr Cancer 66: 225-233. [Crossref]
- Raffetti E, Donato F, Castelnuovo F, Ladisa N, Paraninfo G et al.(2015)The prognostic role of systemic inflammatory markers on HIV-infected patients with non-Hodgkin lymphoma, a multicenter cohort study. J Transl Med 13: 89. [Crossref]
- Sun HL, Pan YQ, He BS, Nie ZL, Lin K et al.(2016)Prognostic performance of lymphocyte-to-monocyte ratio in diffuse large B-cell lymphoma: an updated meta-analysis of eleven reports. Onco Targets Ther 9: 3017-3023. [Crossref]
- Sun K, Chen S, Xu J, Li G, He Y (2014) The prognostic significance of the prognostic nutritional index in cancer: a systematic review and meta-analysis. J Cancer Res Clin Oncol 140: 1537-1549. [Crossref]
- Miyazaki T, Sakai M, Sohda M, Tanaka N, Yokobori T et al. (2016)Prognostic Significance of Inflammatory and Nutritional Parameters in Patients with Esophageal Cancer. Anticancer Res 36: 6557-6562. [Crossref]
- Onodera T, Goseki N, Kosaki G (1984)Prognostic nutritional index in gastrointestinal surgery of malnourished cancer patients. Nihon Geka Gakkai zasshi 85: 1001-1005. [Crossref]
- Shimizu K, Okita R, Saisho S, Yukawa T, Maeda A et al.(2015)Prognostic nutritional index before adjuvant chemotherapy predicts chemotherapy compliance and survival among patients with non-small-cell lung cancer. Ther Clin Risk Manag 11: 1555-1561. [Crossref]
- Sasahara M, Kanda M, Ito S, Mochizuki Y, Teramoto H et al. (2020) The Preoperative Prognostic Nutritional Index Predicts Short-Term and Long-Term Outcomes of Patients with Stage II/III Gastric Cancer: Analysis of a Multi-Institution Dataset. Dig Surg 37: 135-144. [Crossref]
- Pinato DJ, North BV, Sharma R (2012)A novel, externally validated inflammation-based prognostic algorithm in hepatocellular carcinoma: the prognostic nutritional index (PNI). Br J Cancer 106: 1439-1445. [Crossref]
- Yang Z, Zhang B, Hou L, Xie Y, Cao X (2014)Pre-operative prognostic nutritional index predicts the outcomes for triple-negative breast cancer. Tumour Biol 35: 12165-12171. [Crossref]
- .
- Chen KL, Liu YH, Li WY, Chen J, Gu YK et al.(2015)The prognostic nutritional index predicts survival for patients with extranodal natural killer/T cell lymphoma, nasal type. Ann Hematol 94: 1389-1400. [Crossref]
- Hans CP, Weisenburger DD, Greiner TC, Gascoyne RD, Delabie J et al. (2004)Confirmation of the molecular classification of diffuse large B-cell lymphoma by immunohistochemistry using a tissue microarray. Blood 103: 275-282. [Crossref]
- Perkins NJ, Schisterman EF (2006)The inconsistency of "optimal" cutpoints obtained using two criteria based on the receiver operating characteristic curve. Am J Epidemiol 163: 670-675. [Crossref]
- Periša V, Zibar L, Knezović A, Periša I, Sinčić Petričević J et al.(2017)Prognostic nutritional index as a predictor of prognosis in patients with diffuse large B cell lymphoma. Wien Klin Wochenschr 129: 411-419. [Crossref]
- Go SI, Park S, Kang MH, Kim HG, Kim HR et al. (2019)Clinical impact of prognostic nutritional index in diffuse large B cell lymphoma. Ann Hematol 98: 401-411. [Crossref]
- Yu W, Guo Q, Wang Z, Mao L, Wei J et al.(2019)Clinical Significance of Prognostic Nutritional Index for Patients with Diffuse Large B-cell Lymphoma. Nutr Cancer 71: 569-574. [Crossref]
- Zhou Q, Wei Y, Huang F, Wei X, Wei Q et al. (2016)Low prognostic nutritional index predicts poor outcome in diffuse large B-cell lymphoma treated with R-CHOP. Int J Hematol 104: 485-490. [Crossref]
- Hao X, Wei Y, Wei X, Zhou L, Wei Q et al. (2017) Glasgow prognostic score is superior to other inflammation-based scores in predicting survival of diffuse large B-cell lymphoma. Oncotarget 8: 76740-76748. [Crossref]
- Weiner GJ(2010)Rituximab: mechanism of action. Semin Hematol 47: 115-123. [Crossref]
- Feng J, Wang Z, Guo X, Chen Y, Cheng Y et al.(2012)Prognostic significance of absolute lymphocyte count at diagnosis of diffuse large B-cell lymphoma: a meta-analysis. Int J Hematol 95:143-148. [Crossref]
- Zhao P, Zang L, Zhang X, Chen Y, Yue Z et al. (2018)Novel prognostic scoring system for diffuse large B-cell lymphoma. Oncology Lett 15: 5325-5332. [Crossref]
- Beltran BE, Paredes S, Cotrina E, Sotomayor EM, Castillo JJ (2018)The impact of the neutrophil:lymphocyte ratio in response and survival of patients with de novo diffuse large B-cell lymphoma. Leuk Res 67: 82-85. [Crossref]
- Matsuki E, Bohn OL, El Jamal S, Pichardo JD, Zelenetz AD et al. (2019)Lymphocyte-to-Monocyte Ratio May Serve as a Better Prognostic Indicator Than Tumor-associated Macrophages in DLBCL Treated with Rituximab. Appl Immunohistochem Mol Morphol 27: 572-580. [Crossref]
- Ryan AM, Power DG, Daly L, Cushen SJ, Ni Bhuachalla E et al. (2016)Cancer-associated malnutrition, cachexia and sarcopenia: the skeleton in the hospital closet 40 years later. Proc Nutr Soc 75: 199-211. [Crossref]
- Efremova M, Rieder D, Klepsch V, Charoentong P, Finotello F et al. (2018)Targeting immune checkpoints potentiates immunoediting and changes the dynamics of tumor evolution. Nat Commun 9: 32. [Crossref]
- Liu X, Meng QH, Ye Y, Hildebrandt MA, Gu J et al.(2015)Prognostic significance of pretreatment serum levels of albumin, LDH and total bilirubin in patients with non-metastatic breast cancer. Carcinogenesis 36: 243-248. [Crossref]
- Ayhan A, Gunakan E Alyazıcı İ, Haberal N, Altundağ Ö et al. (2017)The preoperative albumin level is an independent prognostic factor for optimally debulked epithelial ovarian cancer. Arch Gynecol Obstet 296: 989-995. [Crossref]
- Liu H, Zhang CL, Feng R, Li JT, Tian Y et al. (2018)Validation and Refinement of the Age, Comorbidities, and Albumin Index in Elderly Patients with Diffuse Large B-Cell Lymphoma: An Effective Tool for Comprehensive Geriatric Assessment. Oncologist 23: 722-729. [Crossref]
- Yue W, Liu B, Gao L He M, Wang J et al. (2018) The pretreatment albumin to globulin ratio as a significant predictor in patients with diffuse large B cell lymphoma. Clin Chim Acta 485: 316-322. [Crossref]
- McMillan DC, Watson WS, O'Gorman P, Preston T, Scott HR et al. (2001) Albumin concentrations are primarily determined by the body cell mass and the systemic inflammatory response in cancer patients with weight loss. Nutr Cancer 39: 210-213. [Crossref]