Low Glucose Enhances the Cytoprotective Effect of Metformin Against Doxorubicin Induced Cytotoxicity in Normal Cells
A B S T R A C T
The anti-diabetic drug, metformin, has been reported to be beneficial for the cardiovascular system and may facilitate the extension of a healthier lifespan. Doxorubicin is a leading chemotherapeutic drug used to treat a variety of cancers, yet it can cause significant adverse effects with cardiac toxicity and long-term damage. To test the hypothesis that the hypoglycaemic agent, metformin, may protect normal cells during chemotherapy treatment with liposomal doxorubicin, C2C12 myoblast cells were used to study cellular bioenergetics, variations in gene expressions and biochemical alterations induced by metformin and pegylated liposomal doxorubicin (L-Doxo) under low glucose conditions (2.7 mM or 50 mg/dL). Using confocal microscopy, we noted that treatment of C2C12 cells with 30 µg/mL L-Doxo under low glucose conditions induced a number of cellular defects. L-Doxo treatment dysregulated the expression of mitochondrial fission and fusion genes, which may influence transformation of the network’s connectivity. L-Doxo significantly reduced mitochondrial oxygen consumption rate (OCR) and extracellular acidification rate (ECAR). However, pre-treatment of cells with 100 nM metformin provided protection against L-Doxo-induced damage and increased cell viability and ATP levels in cells even under low glucose conditions. In addition, metformin increased and restored the decreased OCR and ECAR. Our data provide a mechanism by which low dose metformin exerts protective effects against L-Doxo via involvement of AMPKα under low glucose conditions. Taken together, our results demonstrate that metformin protects normal cells from L-Doxo damage even under low glucose conditions.
Keywords
Metformin, L-Doxo, Low glucose, Mitochondrial protection, Cancer
Introduction
Doxorubicin has been used to treat cancers since the late 1960s [1]. It is a strong and effective drug for various cancers, which include breast cancer, gastric cancer, small cell lung cancer, sarcoma, ovarian cancer and hematologic malignancies [2]. Its major adverse effect is cardiotoxicity, which carries a poor prognosis with fatal consequences for many patients [1]. Several attempts have been employed to reduce the toxicity of doxorubicin, including the modification of infusion regimen, reformulation of doxorubicin, and utilization of other medication, antioxidants and dietary supplements to protect normal cells and tissues [3]. Pegylated liposomal doxorubicin (L-Doxo) is a reformulated form of doxorubicin liposomal product, which has been approved by U.S. Food and Drug Administration for the treatment of a variety of malignancies [4]. L-Doxo has been shown to be as effective as conventional doxorubicin but with reduced cardiotoxicity, especially in elderly, high risk cardiac patients and patients with prior use of anthracyclines [1]. L-Doxo has a much longer half-life in circulation, a lower peak concentration resulting in a reduced concentration in cardiac tissues and hence lower cardiotoxicity [1]. It has been reported that L-Doxo at cumulative doses > 500 mg/m2 was associated with a considerably lower risk of cardiotoxicity than similar doses of conventional doxorubicin [1].
However, in spite of the lower cardiotoxicity, the therapeutic value of L-Doxo is diminished by its pronounced dose-dependent cytotoxicity to normal cells that has to be taken into consideration during cancer treatment [1]. The combination of various chemotherapeutic drugs has had very successful results for the treatment of various cancers and obliterating cancer cells. However, there is a dearth of studies about the injurious effects of anticancer therapy on normal cells. Metformin is an oral hypoglycemic agent (biguanide) that is frequently used as first line therapy for type 2 diabetes. The hypoglycemic potency of metformin is mild and it usually only reduces plasma glucose by approximately 3 mM in diabetics [5]. Population studies have suggested that metformin may decrease the incidence of cancer, cancer-related mortality and myocardial infarction in diabetic patients [6]. In addition, metformin has been reported to reduce mortality in diabetics with heart failure [6]. Antioxidant activity of metformin in cardiomyocytes has also been reported [7].
Through its activation of 5'-adenosine monophosphate-activated protein kinase (AMPK), metformin can reduce the generation of reactive oxygen species in animal models of heart failure and may protect cardiomyocytes from hydrogen peroxide (H2O2) induced injury [7]. The substrate binding subunit Raptor of mTORC1 is a direct substrate of AMPK. AMPK phosphorylates Raptor and inhibits mTORC1 activity that subsequently induces cell cycle arrest when cells are stressed for energy [8]. However, the exact mechanism by which metformin activates AMPK and the corresponding antioxidant effect is unknown. The ability of metformin to prevent oxidative damage and cell death induced by non-liposomal doxorubicin in cardiomyocytes has been reported [8]. NF-kB-mediated regulation of ferritin heavy chain activity has been identified as one of the main mechanisms responsible for the protective effect of metformin against doxorubicin induced cardiotoxicity [9]. In a previous study using a rat model of doxorubicin induced cardiotoxicity, it was suggested that the protective role of metformin involves reversing the structural deterioration of mitochondria induced by anthracyclines, thereby restoring toward normal levels of energy [10]. However, various mechanisms involved in this protective role of metformin still require further investigation.
For cancer patients, hyperglycemia during chemotherapy has been shown to correlate with increased toxicity for both cancer cells as well as normal tissues [11]. The methods currently employed by investigators for in vitro studies generally use a high concentration of glucose 25 mM (450 mg/dL) probably to ensure the best conditions for rapid cell growth and proliferation. However, serum glucose >180 mg/dL in non-diabetic individuals is concerning and requires further investigation for confirmation of diabetes. Normal physiologic serum glucose in non-diabetic persons is usually maintained between 4-6 mM (72-108 mg/dL). During nutrient depletion conditions, serum glucose concentrations may drop to approximately ~2.7 mM (50 mg/dL) and the levels of glucose in the cells may potentially drop even lower. One of the methods used in cancer therapy has been to limit or reduce glucose intake of patients. This has been attempted by caloric restrictions or intermittent fasting. Metformin has also been used in cancer chemotherapy as an adjuvant drug for its mild hypoglycaemic effect [12]. Another effect of metformin is inhibition of mitochondrial function [13].
In the current work, we studied C2C12 cells treated with L-Doxo under low glucose, with or without metformin, to evaluate cellular viability, mitochondrial dynamics, and changes in gene expression and alterations in cell morphology. The results of this study provide a mechanism by which the protective effects of metformin against L-Doxo under low glucose conditions are mediated, by activation of AMPKα. Overall, these findings can provide a new treatment paradigm that would be useful in designing combined chemotherapies that are selectively cytotoxic to cancer cells, while protective of normal cells.
Materials and Methods
I Cell Culture
Dulbecco’s modified Eagle’s medium (DMEM), glutamine, penicillin and streptomycin, and heat inactivated new-born calf serum (NBCS) were purchased from Life Technology (Grand Island, NY, USA). Metformin was purchase from Sigma-Aldrich (St. Louis, MO, USA). Pegylated liposomal doxorubicin (Doxil) was purchased from FormuMax Scientific, Inc. (Silicon Valley, CA, USA). The DMEM media containing 10% (v/v) NBCS with two different glucose concentrations were used in the present study: low (50 mg/dL or 2.7 mM) and normal (100 mg/dL or 5.5 mM). Mouse Mus musculus myoblast (C2C12) cells were purchased from American Type Culture Collection (Manassas, VA, USA) and were cultured following manufacturer’s instructions. Cell cultures were incubated at 37 °C in 5% CO2. Cell culture medium was replaced 24 hours after seeding and upon reaching more than 80% confluence they were sub-cultured using 0.25% trypsin-EDTA, inactivated by trypsin neutralizing solution (Invitrogen, Grand Island, NY, USA).
II Mitochondrial Function Assay
XF96 Extracellular Flux Analyzer (Seahorse Bioscience, North Billerica, MA, USA) was used to assay mitochondrial function. Briefly, C2C12 myoblast cells were seeded in XF96 cell culture plates in 80 µL of normal glucose medium and cultured to 80% confluence overnight at 37 ºC in a humidified incubator with 5% CO2. Upon 80% confluence in normal glucose medium, the cells received either fresh normal glucose medium, or were subjected to low glucose treatment. Next, they were pre-treated with 100 nM metformin for 1 hour followed by 30 µg/mL L-Doxo for additional 5 hours. Cells not exposed to either Met or L-Doxo served as controls in each experiment. After 6 hours, cells were washed three times with phosphate-buffered saline (PBS) and the cell culture medium in the well of the XF cell plate was replaced with the appropriate assay medium. Prior to the assay, the sensor cartridge was calibrated, and the cell plate was incubated at 37 ºC for 1 hour in a non-CO2 incubator.
All experiments were performed at 37 ºC as previously reported [14]. Mitochondrial respiration (OCR) and extracellular acidification rate (ECAR) measurements were performed using standard techniques as previously reported [14]. Concentrations of metformin used in our experiments were adopted from published in-vitro studies that showed minimal to no effect on OCR using 100 nM of metformin under low glucose. 30 µg/mL L-Doxo concentration was used according to the results of preliminary experiments.
III Quantitative Reverse Transcription PCR (qRT-PCR)
Six-well plates were used to culture C2C12 cells up to 80% confluence in normal glucose medium, after which the cells were subjected to low glucose treatment (50 mg/dL or 2.7 mM). After that, the cells were pre-treated with 100 nM metformin for 1 hour followed by 30 µg/mL L-Doxo for total of 6 hours. Cells not exposed to either metformin or L-Doxo served as controls in each experiment. Total cellular RNA was extracted from cells using the RNeasy kit (Qiagen) in accordance with the manufacturer’s recommendations for mammalian cells. The qRT-PCR amplification was performed using SYBR Green master mix (Applied Biosystems) in a 7900HT Fast Sequence Detector System (Applied Biosystems).
To detect each mature mRNA of interest, the following primers were used: PGC-1α, forward primer: ATTCGGGAGCTGGATGGCTT and reverse primer: AGCAGCACACTCTATGTCACTC; PGC-1β, forward primer: CAGGGTGGGGACTCTGGA and reverse primer: AGTCAAAGTCACTGGCGTCC; MFN1, forward primer: GCCCTGTCCAGGTGCATAAT and reverse primer: TGGCCGAAGATTGCAGTGAT; MFN2, forward primer: AGGGCTCGGAGAAGGTATGT and reverse primer: CTCAGTGGCAAGAAGGGAGG; and 5S, forward primer: 5′-tgcccacacgcttactgaga-3 and reverse primer: 5′-caaagcagaggcggtcgt-3′. CT values were automatically obtained. Relative expression values were obtained by normalizing CT values of the mRNA genes in comparison with CT values of the 5S gene as previously published [15, 16].
IV Confocal Microscopy
C2C12 cells were treated as described above under qRT-PCR. After treatment, a subset of cells was used for confocal microscopy. The cells were washed with PBS twice and incubated in 150 nM Mito Tracker Red CMXRos (Invitrogen, Eugene, OR, USA) in growth medium at 37 °C for 1 hour. The cells were then washed and fixed in 3.7% formaldehyde for 10 minutes at room temperature. The fixative was removed by washing with PBS and fresh PBS was replaced for fixed cell imaging. All images were acquired using a 60X/1.4 NA oil objective at room temperature using a Nikon confocal microscope C2/C2si (Nikon, Inc.). A 1 mW and 561 nm wavelength solid-state helium-neon laser was used as the excitation source for confocal microscopy.
V Measurement of Intracellular Adenosine Triphosphate (ATP) Levels
Briefly, C2C12 cells were seeded onto six-well plates and grown in normal glucose DMEM medium supplemented with 10% (v/v) NBCS at 37 °C and 5% CO2 for 24 hours. Upon attachment and 80% confluence in normal glucose medium, the cells were subjected to low glucose treatment. Treatment was given with fresh medium for 6 hours. Equal numbers of cells were lysed in each treatment group and 10 µL was used from each sample following the manufacturer’s protocol for ATP assays (Cayman Chemicals, Ann Arbor, MI, USA). Briefly, 100 µL of the standard reaction solution was measured in a plated reader for background luminescence. Then 10 µL of the lysate supernatant was added to the reaction solution and the luminescence was again measured. Background luminescence was subtracted from sample luminescence and results were plotted as fold change from control samples.
VI Western Blot Analysis
The cultures of C2C12 cells, treated as described in individual experiments, were rinsed twice with ice cold PBS buffer and lysed by Santa Cruz RIPA buffer system. 40 µg of total protein from each treatment group were separated on 12% SDS-polyacrylamide gels. Proteins were transferred to nitrocellulose membranes using a Bio-Rad Mini Trans-Blot electrophoretic transfer cell with a transfer buffer of 25 mM Tris-base, 0.2 M glycine and 20% methanol (pH 8.5). The membranes were blocked with 5% dry milk or 5% bovine serum albumin (BSA) in Tris-buffered saline containing 0.1% Tween-20 (TBS-T) for 1 hour at room temperature. The membrane was then incubated with the primary antibody in TBS-T containing 5% BSA overnight at 4 °C. After washing in TBS-T the membrane was incubated with the appropriate alkaline phosphate (AP) conjugated secondary antibody. Proteins were detected using the Bio-Rad Immun-StarTM chemiluminescent substrate. AMPK phosphorylated at threonine 172 (#2535), AMPK (#2532), Raptor (#2280) and β-Actin (#4967) were purchased from Cell Signalling technology and used at 1:1000 dilution. Secondary alkaline phosphatase linked anti-rabbit (#T2191, used at 1:10,000) IgG antibodies were purchased from Thermo Fisher Scientific.
VII Statistical Analysis
Data are given as mean ± SD, with n denoting the number of experiments unless otherwise indicated. Two-tailed student’s t-test was used to analyse statistical significance with a cut off p value of either *p < 0.05, **p < 0.01 or ***p < 0.001.
Results
I L-Doxo Decreases Oxygen Consumption Rate (OCR) Under Low Glucose Condition
To determine the effect of L-Doxo on mitochondrial function, the mitochondrial oxygen consumption rate and the glycolysis rate were measured after treatment of C2C12 cells with 30 µg/mL L-Doxo under low glucose for 6 hours. Incubation of C2C12 cells for 6 hours under low glucose condition reduced the OCR more than that in normal glucose (Figure 1A). Furthermore, incubation of cells with L-doxo for 6 hours under low glucose repressed OCR, with a 20% decrease compared to those in low glucose (Figure 1A).
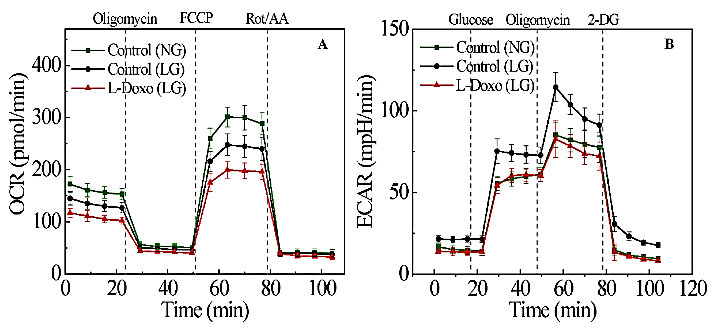
Figure 1: Effect of L-Doxo on mitochondrial respiration. A) OCR and B) ECAR responses of C2C12 cells under normal glucose (5.5 mM or 100 mg/dL), low glucose (2.7 mM or 50 mg/dL), and with 30 µg/mL L-Doxo under low glucose for 6 hours. Data are shown as mean ± SD. NG: normal glucose; LG: low glucose.
We also measured the extracellular acidification rate (ECAR). Low glucose exposure increased the ECAR significantly more than normal glucose exposure (Figure 1B). However, treatment of C2C12 cells with 30 µg/mL L-Doxo under low glucose for 6 hours did not have a significant effect on glycolysis compared to cells in normal glucose (Figure 1B).
II Metformin Induces the Activation of AMPKα Under Low Glucose
As shown in (Figure 2A) western blots under low glucose depicted that compared to L-Doxo treated group, the level of AMPKα and p-AMPKα proteins was significantly increased in 100 nM metformin treated samples prior to L-Doxo treatment (Figures 2B & 2C). Raptor protein expression was significantly increased in L-Doxo treated samples under low glucose conditions (Figure 2D). However, there is no significant change in raptor protein expression in both drugs treated sample compared to L-Doxo treated sample, but metformin treatment alone enhanced the raptor protein expression (Figure 2D). Furthermore, there is no significant change in rictor and m-TOR protein expressions either L-Doxo, metformin, or both drugs treated samples under low glucose (Data not shown). p-AMPKα and AMPKα activation in C2C12 cells incubated in low glucose (2.7 mM or 50 mg/dL) was detected at concentration of metformin as low as 100 nM, which is orders of magnitude lower than those used in previous studies. Our results suggested that the 100 nM metformin mediated protective effects under low glucose condition might be mediated via increase of p-AMPKα activity.
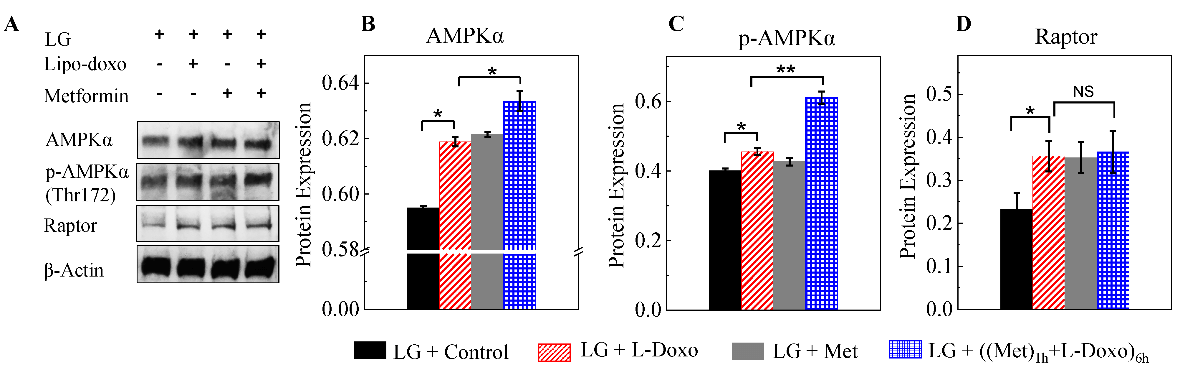
Figure 2: A) Representative western blots of C2C12 cells cultured with 30 µg/mL L-Doxo, 100 nM metformin, or both drugs under low glucose (2.7 mM or 50 mg/dL) for 6 hours. B-D) Bar graphs of proteins in the western blots are shown on the right. *p < 0.05 and ** p < 0.01. Data are expressed as the mean ± SD of three independent experiments. LG: low glucose; Met: metformin.
III Metformin Reverses the Dysregulation of Mitochondrial Fission and Fusion Genes Expression as a Result of L-Doxo Treatment Under Low Glucose
We examined the expression of selected genes involved in mitochondrial biogenesis and function. The effect of pre-treatment with 100 nM metformin for 1 hour under low glucose prior to L-Doxo treatment on the expression of peroxisome proliferator-activated receptor gamma coactivator-1alpha (PGC-1α) gene and peroxisome proliferator-activated receptor gamma coactivator-1beta (PGC-1β) gene, which are upstream regulators of mitochondrial genes, were examined (Figure 3A). As shown in (Figure 3A), under low glucose, treatment with C2C12 cells with 30 µg/mL L-Doxo for 6 hours up-regulated the expression of PGC-1α mRNA level (p < 0.001, n = 3) compared with control, but the expression of PGC-1β mRNA level (p < 0.001, n = 3) was down-regulated compared with single L-Doxo treatment (p < 0.001, n = 3).
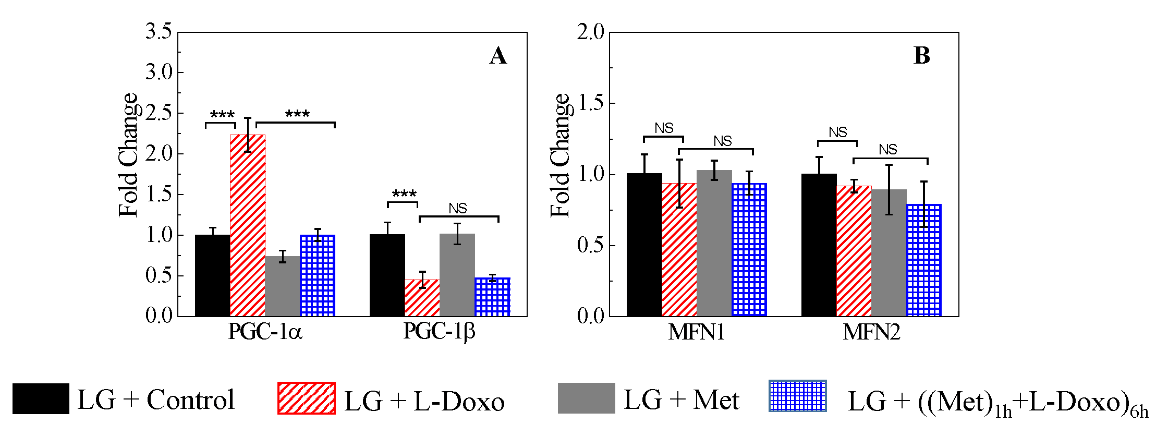
Figure 3: Quantitative reverse transcription PCR (qRT-PCR) on C2C12 cells of selected genes involved in mitochondrial biogenesis and function under low glucose (2.7 mM or 50 mg/dL). Effect of 30 µg/mL L-Doxo, 100 nM metformin, and both drugs for 6 hours on A) PGC-1α and β and B) MFN1 and 2 genes under low glucose. Data are expressed as the mean ± SD of three independent experiments. Data were normalized to those for 5S. *** p < 0.001. LG: low glucose; Met: metformin.
Moreover, 100 nM metformin treatment alone didn’t induce much variation in PGC-1α and PGC-1β genes expression under low glucose. After pre-treatment with 100 nM metformin for 1 hour prior to L-Doxo treatment down-regulated the expression of PGC-1α gene similar to that in the control groups under low glucose (Figure 3A). However, combined treatment did not up-regulate the expression of PGC-1β gene to normal levels under low glucose (Figure 3A). As shown in (Figure 3B), there was no significant change in the expression of MFN1 (NS, n = 3) and MFN2 (NS, n = 3) upon 100 nM metformin, 30 µg/mL L-Doxo, and both drugs treatment for 6 hours under low glucose.
IV Metformin Minimizes Mitochondrial Dysfunction Induced by L-Doxo
Confocal microscopy was used to evaluate the alterations in mitochondrial morphology using Mito tracker red (Figure 4). The effect of 100 nM metformin, 30 µg/mL L-Doxo, or their combination for 6 hours on mitochondrial membrane potential was evaluated in C2C12 cells under low glucose using confocal microscope. Figure 4A shows control C2C12 myoblasts with intact cell membranes and filamentous polarized mitochondria under low glucose. This is indicative of selective uptake and concentration of Mito tracker red by healthy, actively respiring mitochondria. Treatment with 30 µg/mL L-Doxo caused breakage of the mitochondrial network (Figure 4B). Furthermore, weakened Mito tracker red staining was probably due to a decreased mitochondrial membrane potential (Figure 4B). Some cells treated with 30 µg/mL L-Doxo for 6 hours showed blurred and aggregated staining throughout the cytosol, whereas the control cells displayed clear and dispersive mitochondrial morphology. After L-Doxo treatment under low glucose for 6 hours, the mitochondrial reticulum appeared less defined than in control cells.
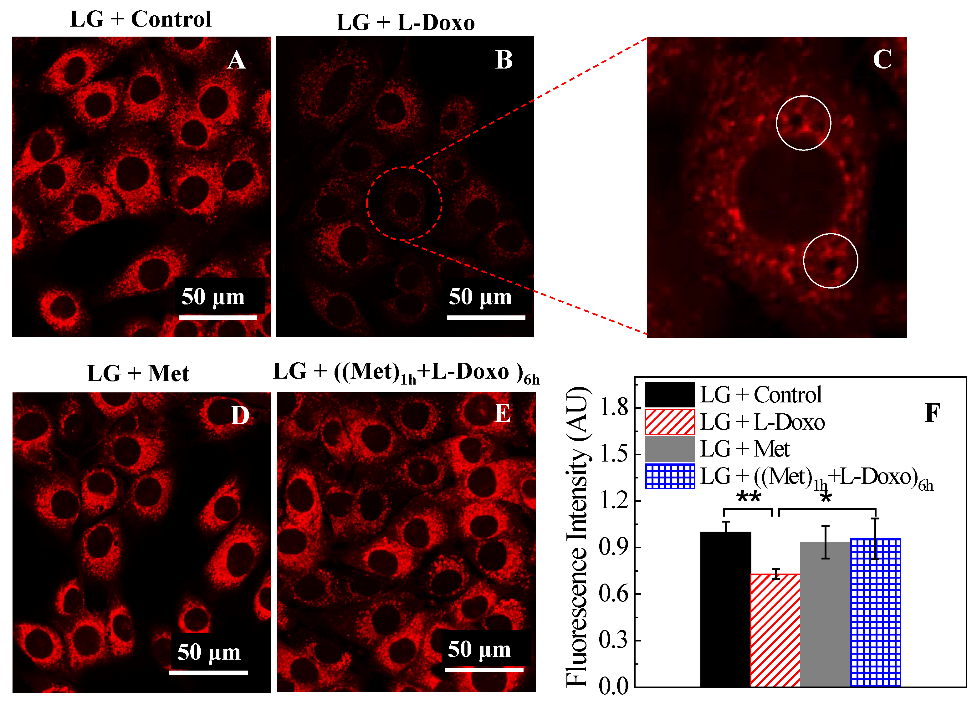
Figure 4: Exposure to 30 µg/mL L-Doxo under low glucose induces structural changes of mitochondria in C2C12 myoblast cells. Cells were stained with Mito tracker red. A) 0 µg/mL L-Doxo, B & C) 30 µg/mL of L-Doxo, D) 100 nM metformin, and E) metformin + L-Doxo under low glucose for 6 hours. White circles indicated the formation of vacuoles in the cytoplasm. Scale bar = 50 µm. All images used 60X magnification. F) Bar graphs of quantitation of the intensity of Mito tracker red staining under low glucose. Data are shown as mean ± SD, n = 3. Asterisk indicates significant differences in fluorescence intensity with different treatments. Fifty randomly selected C2C12 cells for each sample or experimental condition were analysed. *p < 0.05 and **p < 0.01. LG: low glucose; Met: metformin.
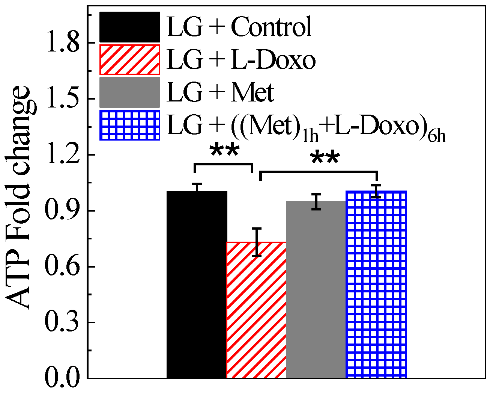
Figure 5: Metformin increases ATP levels under low glucose condition (2.7 mM or 50 mg/dL). C2C12 cells were treated with either 100 nM metformin, 30 µg/ mL L-Doxo, or both drugs for 6 hours under low glucose and ATP levels were measured and fold change of ATP compared with control was plotted. Data are expressed as the mean ± SD of three independent experiments. *p < 0.05 and **p < 0.01. LG: low glucose; Met: metformin.
Furthermore, mitochondria showed a more punctate distribution following L-Doxo treatment compared to the control cells, indicating a synergistic cell injury due to L-Doxo (Figure 4C). Nuclear alterations induced by L-Doxo exposure were also explored in the present work. Treatment with 100 nM metformin alone for 6 hours did not show any significant effect on fluorescence intensity (Figures 4D & 4F). However, the combined treatment elicited an increase in Mito tracker red signal than the one triggered by either drug alone (Figures 4E & 4F). These results confirm the protective effect of metformin under low glucose condition against cell death caused by L-Doxo. The cellular ATP levels of C2C12 cells were examined after either 100 nM metformin, 30 µg/mL L-Doxo, or combined treatment for 6 hours under low glucose conditions (Figure 5). The results show that L-Doxo strongly decreased ATP levels under low glucose. Incubation with metformin alone slightly decreased the ATP levels under low glucose. However, co-incubation of 100 nM metformin attenuated L-Doxo’s effects under low glucose.
V Metformin Restores Mitochondrial OCR and Glycolytic Rate Due Resulting from L-Doxo Under Low Glucose Condition
Our previous research demonstrated that pegylated liposomal doxorubicin (L-Doxo) was cytotoxic to C2C12 myoblast cells under high glucose (25 mM or 450 mg/dL) compared to normal physiological glucose (5.5 mM or 100 mg/dL) conditions [14]. This implies that chemotherapy drugs cause damage to not only cancer cells, but also normal cells especially at high chemotherapy doses under high glucose conditions. Our results are in agreement with those of previous studies, which showed that short-term starvation can selectively sensitize cancer cells to chemotherapeutics [17]. Our observation that L-Doxo decreases OCR under low glucose has raised the question whether metformin can restore OCR during deprivation of glucose. To determine the influence of metformin on the cytotoxicity of L-Doxo, we tested the effects of different concentrations of metformin on the mitochondrial oxygen consumption rate (OCR) of C2C12 cells under low glucose condition (Figure S1, Supporting Information). As metformin concentration was increased, the OCR was decreased in a dose dependent manner (Figure S1, Supporting Information).
However, treatment of C2C12 cells with 100 nM of metformin showed no effect on OCR under low glucose (Figure S1, Supporting Information). We investigated OCR and ECAR in C2C12 cells treated with 100 nM metformin, 30 µg/mL L-Doxo, and metformin and L-Doxo under low glucose (Figure 6) conditions using the Seahorse XF96. The seeding density and concentrations of the injection compounds were optimized. Figure 6A shows that L-Doxo treated cells exhibited a reduction in maximal respiratory capacity compared with control C2C12 cells, as evidenced by reducing OCR under low glucose conditions. Pre-treatment with 100 nM metformin for 1 hour under low glucose condition increased and restored the OCR to levels similar to that of cell cultures treated with metformin alone. L-Doxo repressed basal respiration of the C2C12 cells in the resting state under low glucose (Figure 6A) conditions. However, either 100 nM metformin or both metformin and L-Doxo treated cells showed less or no effect on basal respiration. As shown in (Figure 6B), data analysis revealed that L-Doxo alone repressed basal respiration, maximal respiration, and spare respiration capacity under low glucose conditions. However, the basal respiration and maximal respiration was better under low glucose conditions if C2C12 cells were pre-treated with 100 nM metformin before exposure to L-Doxo. Altogether, these data demonstrate that there are significant metabolic changes occurring in cells pre-treated with metformin for 1 hour under low glucose condition.
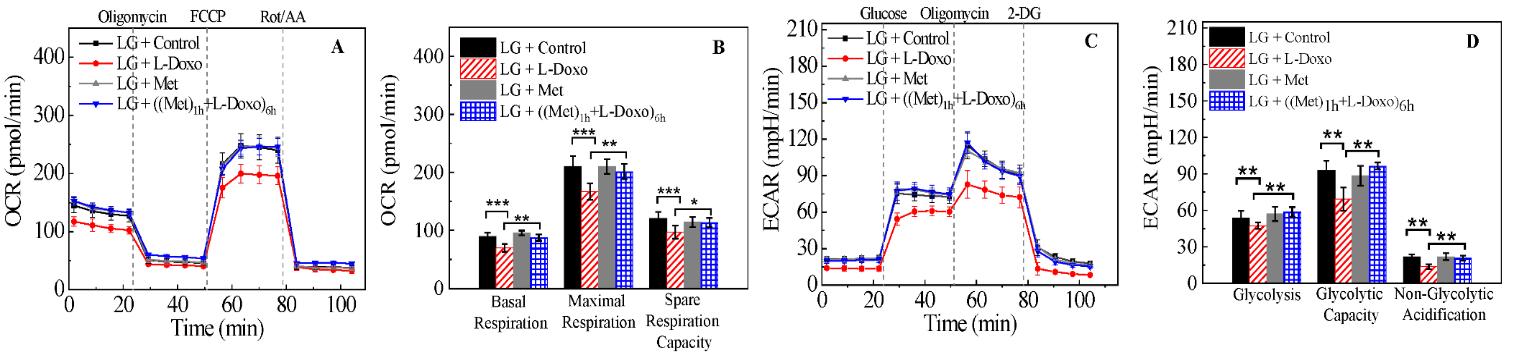
Figure 6: Effect of metformin and L-Doxo on oxygen consumption rate (OCR) and extracellular acidification rate (ECAR) under low glucose (2.7 mM or 50 mg/dL) conditions. A) OCR responses of C2C12 cells (control) with 30 µg/mL L-Doxo alone for 6 hours; 100 nM metformin alone for 6 hours; after pre-treatment with 1 hour of metformin before 30 µg/mL L-Doxo exposure for 6 hours. B) Graphical representation of experiments in A. C) ECAR responses in 100 nM metformin, 30 µg/mL L-Doxo, and both metformin and L-Doxo treated and untreated C2C12 cells under low glucose. D) Glycolysis, glycolytic capacity, and non-glycolytic acidification were calculated for metformin and L-Doxo treated and untreated C2C12 cells under low glucose. Data are shown as mean ± SD, n = 3. *p < 0.05, **p < 0.01, and ***p < 0.001. LG: low glucose; Met: metformin.
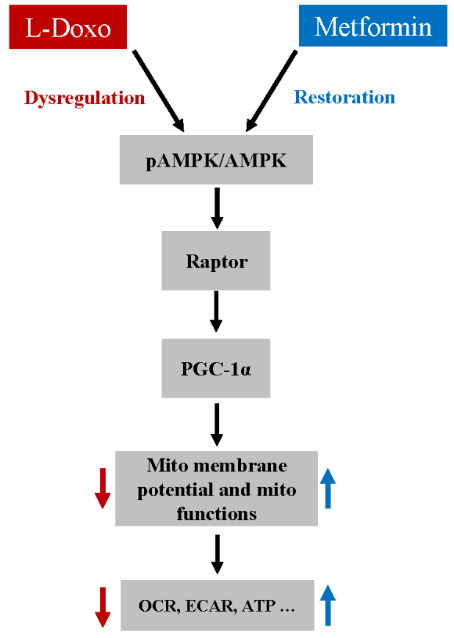
Figure 7: A proposed pathway for Met-mediated protection against L-Doxo induced toxicity in C2C12 cells under low glucose condition.
As shown in (Figure 6C), glucose addition to C2C12 cells caused an instant increase in kinetic ECAR responses under low glucose. The subsequent addition of oligomycin caused a further increase in ECAR, indicating an elevated glucose flux toward lactate and revealing the glycolysis capacity of C2C12 cells treated with metformin, L-Doxo and both metformin and L-Doxo. The final addition of glycolysis inhibitor 2-DG abolished the overall glycolysis.
Furthermore, L-Doxo treatment reduced ECAR under low glucose conditions. However, pre-treatment with metformin (100 nM, 1 hour) significantly increased ECAR under low glucose conditions, similar to that in the control groups (Figures 6C & 6D). Based on the results, we propose a pathway for the Met-mediated protective effect against the L-Doxo-induced toxicity on cells under low glucose (Figure 7). While there are other components that need to be identified in this signalling pathway, our findings nevertheless provide valuable information for Met’s protective effect against L-Doxo under low glucose that has recently attracted attention. Elucidating further details in this signalling pathway might lead to better understanding regarding treatment of cancer patients especially with hyperglycaemia or diabetic mellitus.
Discussion
A number of investigators have reported that metformin is concentrated within the mitochondria, and utilization of high glucose (25 mM or 450 mg/dL) in cell culture media might interfere with and mask the action of metformin, requiring higher dosages. Hence, it might be advantageous to use lower glucose in-vitro to study the effect of metformin. Cells derive part of their ATP from mitochondrial oxidative phosphorylation when the concentration of glucose is within the physiological range (around 5 mM or 90 mg/dL) [18, 19]. Complex I have been proposed as the major respiratory-chain target of metformin [20]. However, inhibition of complexes II and IV have also been reported in mitochondria in rats. Inhibition of complex I of mitochondrial respiratory chain, reduces ATP synthesis which leads to AMPK activation through an increase in the AMP/ATP ratio [21]. AMPK independent pathways have been proposed to be activated with high dose metformin [22].
In our study, AMPK activation under low glucose condition was detected at the concentration of metformin as low as 100 nM. The findings of our study identified that low glucose conditions can be used to study the mechanism of action of metformin and might even be advantageous because it mimics the systemic glucose concentrations during cancer chemotherapy. Low glucose conditions can therefore provide a clear realistic view of the cellular integrity and signalling pathways in patients undergoing cancer chemotherapy. In the last few years, several studies have been published on the protective effects of metformin against the non-liposomal, conventional doxorubicin toxicity [23]. The main mechanism for doxorubicin-induced toxicity is oxidative stress due to an increase in free radical generation [24]. It has been reported that AMPK can also inhibit oxidative phosphorylation and promote glycolytic ATP production. This agrees with the decreased oxygen consumption that was observed in our studies, which C2C12 cells were treated with L-Doxo under low glucose. The reduced OCR after L-Doxo treatment may be because complex I damage and could explain the decline in OCR of C2C12 cells treated with L-Doxo under low glucose condition for 6 hours.
Binding of doxorubicin to cardiolipin in the inner mitochondrial membrane can lead to mitochondrial dysfunction and can inactivate mitochondrial complexes I, III, IV, and V, phosphate carrier, and ATP-ADP translocase [25-27]. The spare respiratory capacity of mitochondria in response to oxidative stress and energetic insufficiency is important [28]. The maximal respiration mainly depends on the function of the substrate supplementation [29]. Pre-treatment with metformin during shorter-term low glucose stress elevated OCR to levels similar to that of cells cultured with metformin alone is associated with reduction of the oxidative stress induced by L-Doxo by inhibition of complex I. Present studies did not undertake quantification of reactive oxygen/nitrogen species. Complex I and complex III are the two major reactive oxygen/nitrogen species producers in the respiratory chain, together accounting for over 50% of the free radicals produced in the cell. Metformin can restore OCR indirectly via engagement of multiple nutrient pathways simultaneously [30]. Other possible mechanisms that might be involved in metformin’s protective effect during short term low glucose exposure may include epigenetic modulation of genes in the growth and apoptotic pathways, including transcription activation and repression. Moreover, a compensatory up-regulation of complex II might occur with complex I inhibition via GPDH [31].
Interestingly, C2C12 cells treated with metformin, L-Doxo, and both drugs under low glucose significantly changed the sensitivity of mitochondria to the mitochondrial uncoupler FCCP. The sensitivity to FCCP may depend on the conformational state of the mitochondrial inner membrane, such as changes in its fluidity and regularity. We also observed a significant increase in ATP levels in metformin pre-treated C2C12 cells, which points to the major role of mitochondrial oxidative phosphorylation in maintaining energy status. The enhanced generation of reactive oxygen species by doxorubicin may directly damage mitochondria or alter the synthesis of proteins associated with the mitochondrial electron transport chain, which inhibits oxidative phosphorylation and decreases cardiac high energy phosphate homeostasis [30]. Our results are in good agreement with previous studies that showed the protective effect of metformin against mitochondrial dysfunction in other experimental systems including heart failure and diabetes. One study has reported the usefulness of metformin in restoring ATP levels and Coenzyme-A in the mitochondria and thereby preventing doxorubicin cardiotoxicity [10]. However, there might be other mechanisms of action of metformin that needs further investigation.
PGC-1α and PGC-1β are key regulators of mitochondrial activity in skeletal muscles and can differentially regulate processes, such as organelle uncoupling and biogenesis [32]. Low glucose did not induce significant changes in expressions of MFN1 and MFN2 and this may have protected the normal C2C12 cells from L-Doxo induced damage. The mechanisms underlying those changes are of interest and warrant further investigation. A cell’s capacity to generate ATP by oxidative phosphorylation can be monitored by measuring mitochondrial membrane potential [33]. Mitochondrial dysfunction has been shown to participate in non-liposomal doxorubicin mediated cells death by inducing the apoptotic pathway. Indeed, mitochondrial permeability transition pore opening has been demonstrated to induce the depolarization of mitochondrial membrane potential, the release of apoptogenic factors, the activation of caspases, and DNA damage [34]. The results obtained in this study demonstrate that metformin prevents the loss of mitochondrial membrane potential induced by L-Doxo.
The results from our study also suggest that metformin may be used as a potential therapeutic drug to counter the toxic effects of L-Doxo in normal tissues and cells in low glucose conditions. The advantage of metformin is that it does not reduce the antitumor activity of L-Doxo and could work synergistically with it to reduce tumor growth and prevent relapse in a broad variety of cancer types [34]. However, this is the first study that has demonstrated protective effects of metformin in low glucose conditions against liposomal doxorubicin-induced damage of normal cells. Further experiments using an in vivo model will be required to test the protective effect of metformin in the complex body system. Individuals receiving chemotherapy often do not consume food during the treatment because of nausea and many of them may become hypoglycaemic for some time. This may enhance the effectiveness of the chemotherapy. Based on our data we believe that the addition of low dose metformin may enhance the protection of the normal cells during chemotherapy.
The present data suggest that pre-treatment of C2C12 normal cells with metformin under low glucose conditions reversed the unfavourable changes in the L-Doxo-induced mitochondrial fission genes (MFN1 and MFN2) and thereby increased the mitochondrial membrane potential which helped to preserve mitochondrial function. Metformin also increased and restored the OCR and ECAR to levels similar to that of cells cultured under low glucose alone. This pre-treatment also significantly increased cell viability and ATP levels in cells incubated in low glucose media. We have investigated p-AMPKα, AMPKα, and Raptor as crucial factors in metformin induced resistance against L-Doxo toxicity on C2C12 cells under low glucose condition. Although other factors may also need to be elucidated in this pathway, our results demonstrate that metformin protects normal cells from L-Doxo damage and that the low glucose may play an important role and enhance this protective action of metformin.
Acknowledgments
We thank Amanda K. Pangle for the assistance with the manuscript preparation.
Author Contributions
FSA participated in the design of the study, carried out the experiments, and drafted the manuscript. GA and XMZ participated in the design and coordination of the study and the writing of the manuscript. JYW led the study and participated in the design of the study, the statistical analysis, and overall interpretation of results. All the authors read and approved the final manuscript. All the authors contributed to the manuscript.
Conflicts of Interest
None.
Funding
This study was supported in part by the Claude D. Pepper Older American Independence Center grant (P30AG28718).
Supporting Information
Metformin Decreases Oxygen Consumption Rate in a Dose-Dependent Manner.
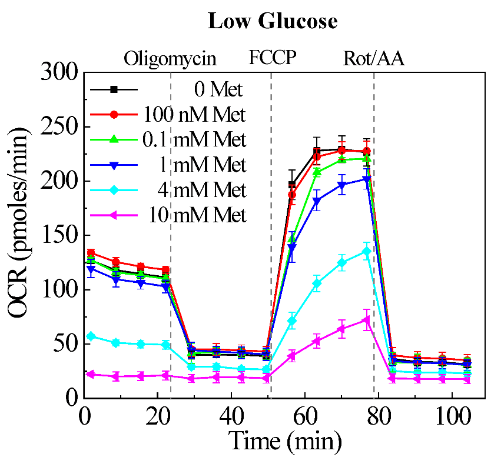
Figure S1: C2C12 cells with oxygen consumption rate (OCR) under low glucose (2.7 mM or 50 mg/dL) condition. Kinetic responses after 6 hours of treatment with varying concentrations of metformin (100 nM, 0.1 mM, 1 mM, 4 mM, and 10 mM) under low glucose condition. Data are shown as mean ± standard deviation, n = 3. Met - metformin.
Article Info
Article Type
Research ArticlePublication history
Received: Wed 24, Jun 2020Accepted: Sat 18, Jul 2020
Published: Sat 08, Aug 2020
Copyright
© 2023 Jeanne Y. Wei. This is an open-access article distributed under the terms of the Creative Commons Attribution License, which permits unrestricted use, distribution, and reproduction in any medium, provided the original author and source are credited. Hosting by Science Repository.DOI: 10.31487/j.JDMC.2020.01.04
Figures & Tables
References
- McGowan JV, Chung R, Maulik A, Piotrowska I, Walker JM et al. (2017) Anthracycline Chemotherapy and Cardiotoxicity. Cardiovasc Drugs Ther 31: 63-75. [Crossref]
- Todorova VK, Makhoul I, Dhakal I, Wei J, Stone A et al. (2017) Polymorphic Variations Associated With Doxorubicin-Induced Cardiotoxicity in Breast Cancer Patients. Oncol Res 25: 1223-1229. [Crossref]
- Todorova VK, Siegel ER, Kaufmann Y, Kumarapeli A, Owen A et al. (2020) Dantrolene Attenuates Cardiotoxicity of Doxorubicin Without Reducing its Antitumor Efficacy in a Breast Cancer Model. Transl Oncol 13: 471-480. [Crossref]
- Fukuda A, Tahara K, Hane Y, Matsui T, Sasaoka S et al. (2017) Comparison of the adverse event profiles of conventional and liposomal formulations of doxorubicin using the FDA adverse event reporting system. PLoS One 12: e0185654. [Crossref]
- Penkert J, Ripperger T, Schieck M, Schlegelberger B, Steinemann D et al. (2016) On metabolic reprogramming and tumor biology: A comprehensive survey of metabolism in breast cancer. Oncotarget 7: 67626-67649. [Crossref]
- Han Y, Xie H, Liu Y, Gao P, Yang X et al. (2019) Effect of metformin on all-cause and cardiovascular mortality in patients with coronary artery diseases: a systematic review and an updated meta-analysis. Cardiovasc Diabetol 18: 96. [Crossref]
- Dziubak A, Wójcicka G, Wojtak A, Bełtowski J (2018) Metabolic Effects of Metformin in the Failing Heart. Int J Mol Sci 19: 2869. [Crossref]
- Zhu J, Thompson CB (2019) Metabolic regulation of cell growth and proliferation. Nat Rev Mol Cell Biol 20: 436-450. [Crossref]
- Asensio López MC, Sánchez Más J, Pascual Figal DA, Abenza S, Pérez Martínez MT et al. (2013) Involvement of ferritin heavy chain in the preventive effect of metformin against doxorubicin-induced cardiotoxicity. Free Radic Biol Med 57: 188-200. [Crossref]
- Ashour AE, Sayed Ahmed MM, Abd Allah AR, Korashy HM, Maayah ZH et al. (2012) Metformin rescues the myocardium from doxorubicin-induced energy starvation and mitochondrial damage in rats. Oxid Med Cell Longev 2012: 434195. [Crossref]
- Lamar ZS, Dothard A, Kennedy L, Isom S, Robinson M (2018) Hyperglycemia during first-line R-CHOP or dose adjusted R-EPOCH chemotherapy for non-Hodgkin lymphoma is prevalent and associated with chemotherapy alteration - a retrospective study. Leuk Lymphoma 59: 1871-1877. [Crossref]
- Roshan MH, Shing YK, Pace NP (2019) Metformin as an adjuvant in breast cancer treatment. SAGE Open Med 7. [Crossref]
- Fontaine E (2018) Metformin-Induced Mitochondrial Complex I Inhibition: Facts, Uncertainties, and Consequences. Front Endocrinol (Lausanne) 9: 753. [Crossref]
- Ameer FS, Zhang X, Azhar G, Wei JY (2018) The effect of pegylated liposomal doxorubicin HCl on cellular mitochondrial function. J Pharmacol Clin Toxicol 6.
- Zhang X, Williams ED, Azhar G, Rogers SC, Wei JY (2016) Does p49/STRAP, a SRF-binding protein (SRFBP1), modulate cardiac mitochondrial function in aging? Exp Gerontol 82: 150-159. [Crossref]
- Williams ED, Rogers SC, Zhang X, Azhar G, Wei JY (2017) P49/STRAP, a serum response factor binding protein (SRFBP1), is involved in the redistribution of cytoskeletal f-actin proteins during glucose deprivation. J Nutr Health Aging 21: 1142-1150. [Crossref]
- Todorova VK, Makhoul I, Siegel ER, Wei J, Stone A et al. (2016) Biomarkers for presymptomatic doxorubicin-induced cardiotoxicity in breast cancer patients. PLoS One 11: e0160224. [Crossref]
- Vazquez A, Liu J, Zhou Y, Oltvai ZN (2010) Catabolic efficiency of aerobic glycolysis: The Warburg effect revisited. BMC Syst Biol 4: 58-58. [Crossref]
- Martinez Outschoorn UE, Peiris Pagés M, Pestell RG, Sotgia F, Lisanti MP (2017) Cancer metabolism: a therapeutic perspective. Nat Rev Clin Oncol 14: 11-31. [Crossref]
- Rena G, Hardie DG, Pearson ER (2017) The mechanisms of action of metformin. Diabetologia 60: 1577-1585. [Crossref]
- Hawley SA, Ross FA, Chevtzoff C, Green KA, Evans A et al. (2010) Use of cells expressing gamma subunit variants to identify diverse mechanisms of AMPK activation Cell Metab 11: 554-565. [Crossref]
- Kalender A, Selvaraj A, Kim SY, Gulati P, Brule S et al. (2010) Metformin, independent of AMPK, inhibits mTORC1 in a rag GTPase-dependent manner. Cell Metab 11: 390-401. [Crossref]
- Li Y, Wang M, Zhi P, You J, Gao J (2017) Metformin synergistically suppress tumor growth with doxorubicin and reverse drug resistance by inhibiting the expression and function of P-glycoprotein in MCF7/ADR cells and xenograft models. Oncotarget 9: 2158-2174. [Crossref]
- Horenstein MS, Vander Heide RS, L'Ecuyer TJ (2000) Molecular basis of anthracycline-induced cardiotoxicity and its prevention. Mol Genet Metab 71: 436-444. [Crossref]
- Gorini S, De Angelis A, Berrino L, Malara N, Rosano G et al. (2018) Chemotherapeutic Drugs and Mitochondrial Dysfunction: Focus on Doxorubicin, Trastuzumab, and Sunitinib. Oxid Med Cell Longev 2018: 7582730. [Crossref]
- Renu K, VG A, P B TP, Arunachalam S (2018) Molecular mechanism of doxorubicin-induced cardiomyopathy-An update. Eur J Pharmacol 818: 241-253. [Crossref]
- Murabito A, Hirsch E, Ghigo A (2020) Mechanisms of Anthracycline-Induced Cardiotoxicity: Is Mitochondrial Dysfunction the Answer? Front Cardiovasc Med 7: 35. [Crossref]
- Brand MD, Nicholls DG (2011) Assessing mitochondrial dysfunction in cells. Biochem J 435: 297-312.
- Hill BG, Benavides GA, Lancaster JR, Ballinger S, Dell’Italia L et al. (2012) Integration of cellular bioenergetics with mitochondrial quality control and autophagy. Biol Chem 393: 1485-1512. [Crossref]
- Szrejder M, Piwkowska A (2019) AMPK signalling: Implications for podocyte biology in diabetic nephropathy. Biol Cell 111: 109-120. [Crossref]
- Madiraju AK, Erion DM, Rahimi Y, Zhang XM, Braddock DT et al. (2014) Metformin suppresses gluconeogenesis by inhibiting mitochondrial glycerophosphate dehydrogenase. Nature 510: 542-546. [Crossref]
- Liesa M, Borda d'Água B, Medina Gómez G, Lelliott CJ, Paz JC et al. (2008) Mitochondrial fusion is increased by the nuclear coactivator PGC-1beta. PLoS One 3: e3613. [Crossref]
- Perry SW, Norman JP, Barbieri J, Brown EB, Gelbard HA (2011) Mitochondrial membrane potential probes and the proton gradient: a practical usage guide. Biotechniques 50: 98-115. [Crossref]
- Cheneval D, Müller M, Carafoli E (1983) The mitochondrial phosphate carrier reconstituted in liposomes is inhibited by doxorubicin. FEBS Lett 159: 123-126. [Crossref]