Improving Rehabilitation for Patients with Intermittent Claudication: A Randomized Controlled Trial with a Mixed-Methods Evaluation (The CIPIC Rehab Study)
A B S T R A C T
Aim: This study aimed to explore how qualitative data about rehabilitation for patients with intermittent claudication do provide an enhanced understanding of the quantitative experimental results.
Background: The study was a randomized clinical trial comparing a rehabilitation intervention with usual care. A statistically significant difference between rehabilitation and usual care was found in walking distance, physical activity, quality of life and diet. The findings from the quantitative and qualitative analyses were analysed separately on their own tradition. In this study, mixed methods address whether the qualitative results could help explain the quantitative results and bring forward additional information.
Design: Complex mixed-method intervention design with a convergent questionnaire variant.
Methods: From April 2017- May 2019, patients diagnosed with intermittent claudication were included in a randomized clinical trial (N=118). In addition, qualitative interview informants from the intervention group were sampled from the quantitative study population for a survey (N=43) and focus group interviews (N=10). Interviews were conducted from April 2018-August 2019.
Results: Integrated analyses identified how improvement in walking distance, physical activity, diet and quality of life was affected by team spirit, pedometer, education and fun exercise in a local setting. Quantitative and qualitative findings primarily confirmed and expanded each other; however, two discordant results were also evident.
Conclusion: Our study adds empirical evidence regarding how a mixed-methods study can be used to obtain a more nuanced understanding of complex healthcare problems. The study provides new knowledge concerning how to set up a rehabilitation programme for patients with intermittent claudication.
Keywords
Intermittent claudication, rehabilitation, mixed-methods study, health behaviour changes, evaluation
Background
The overall aim of the CIPIC Rehab study trial was to test and develop a cardiovascular rehabilitation intervention for patients with intermittent claudication in non-operative management. Multiple randomized clinical trials showing the efficacy of supervised exercise treadmill training (SET), but many patients refuse participation because of the burdensome requirements of SET programmes [1]. The hypothesis was that a specialised rehabilitation programme based on the established cardiac rehabilitation programme would improve maximal walking distance, pain-free walking distance, level of physical activity, healthy diet, quality of life, health behaviour, and reduce anxiety and depression. A mixed-methods design was chosen, combining a randomized controlled trial with qualitative data to assess the effectiveness and evaluation of the rehabilitation intervention from a patient’s perspective.
Semi-structured focus group interviews with participants were chosen to evaluate the intervention and explore how it fits the patients in a real-world setting to better understand the patients’ lived experiences with the rehabilitation programme. A survey with closed-ended and open-ended questions evaluated the intervention and focus groups aimed to explore the knowledge of the rehabilitation needs in more depth [2]. This kind of evaluation within trials explores the implantation, receipt, and setting of the intervention and helps interpret the outcome results. Data were analysed separately for each component to produce sets of findings. The quantitative analyses showed that a cardiovascular rehabilitation programme for patients with intermittent claudication (IC) significantly increased maximal walking distance measured by treadmill walking test and increased physical activity, quality of life (QoL) and healthy diet compared with usual care [3]. Quality of life (QoL) was measured using The Vascular Quality of Life Questionnaire to perceive disease-specific health, and healthy diet was measured by a validated Danish diet questionnaire [4, 5]. Before the treadmill test at 6 and 12 months, a self-reported assessment of general condition in the legs compared to baseline was measured and showed much better condition in the intervention group [6]. Smoking and alcohol consumption was measured by self-reported behaviour [7, 8]. The Hospital Anxiety and Depression Scale (HADS) was used to detect symptoms of anxiety and depression [9]. HADS, alcohol consumption and smoking showed no significant differences between the groups [6].
Findings were reported with P<.05, indicating significance. However, the p-value provides no information about the clinical importance of the findings. The overall findings from the qualitative study highlight how a community-based rehabilitation programme can be supportive and motivate the patients to improve health behaviour and encourage the management of leg pain. Pedometer and a local setting were important motivational factors to keep adherence to the programme. The participants’ experiences of the rehabilitation programme were expressed in four themes revealed from the qualitative analysis: i) The shared community, ii) pushing your own limits, iii) spurred by pedometers and somebody waiting, iv) continuing new habits on your own. The participants found the components in the rehabilitation programme meaningful but encountered difficulties in continuing on their own after completion of the programme [6].
Introduction
The CIPIC Rehab study (Cross-sectoral rehabilitation intervention for patients with intermittent claudication) trial was a randomized clinical trial (RCT) that tested a specialised rehabilitation intervention for patients with intermittent claudication in non-operative management versus usual care. The rehabilitation programme was based on the established cardiac rehabilitation programme according to Danish guidelines [10]. A statistically significant difference between rehabilitation and usual care was found in maximal walking distance, physical activity, quality of life and healthy diet [3]. The qualitative part of the study highlights how a community-based rehabilitation programme can be supportive due to support from other patients, a local setting, education, and the use of a pedometer [6]. However, a gap exists because past research has not adequately captured personal views and participants’ context when testing outcomes of a community-based cardiovascular rehabilitation intervention. Therefore, there is a need to add qualitative data into a quantitative experimental trial to enrich data about how to set up a rehabilitation programme that fits patients with intermittent claudication. As preplanned findings from the quantitative and qualitative analyses must be integrated to address whether the qualitative results could help explain the quantitative results and bring forward additional information [11, 12].
The Study
I Aims
The purpose of the quantitative component was to investigate walking distance, QoL and changes in health behaviour. The purpose of the qualitative component was to explore the participants’ experiences of participation in the rehabilitation intervention. The purpose of the survey was to evaluate the rehabilitation intervention and get information about how the ideal rehabilitation programme should be. The overall aim of this study was to combine the quantitative and qualitative findings to determine additional information about clinical outcomes in The CIPIC Rehab study and to examine the views of participants on the intervention, implementation, components of the intervention and contextual factors that affect the intervention [13].
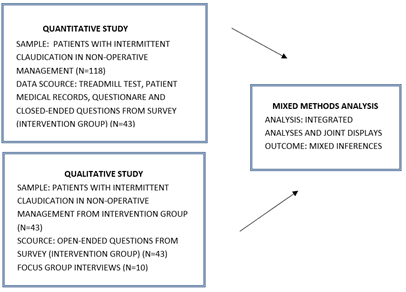
Figure 1: Flow diagram of The CIPIC Rehab Study complex mixed-methods intervention design.
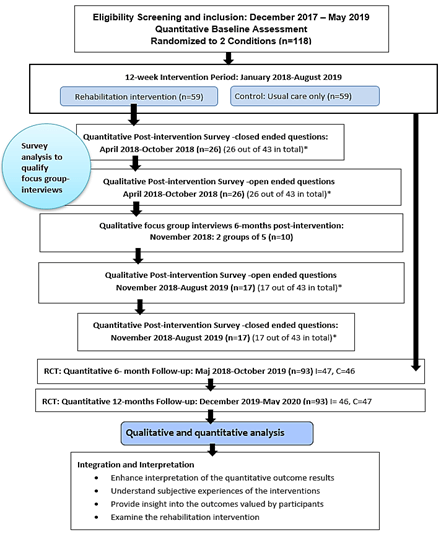
Figure 2: Timeline diagram of The CIPIC Rehab study mixed-methods.
*All participants who completed the intervention were included (n=43) before or after the conducted focus-group interviews.
I: Intervention Group; C: Control Group.
II Design
The present study was designed as a complex mixed-methods intervention design, where the quantitative and qualitative data were collected and analysed on its own tradition to integrate the information within an intervention trial [11]. See flow diagram (Figure 1) and timeline diagram (Figure 2). The quantitative component was designed as an RCT, and the qualitative component had a qualitative exploratory design. Additionally, a convergent questionnaire variant with both open- and close-ended questions was designed [11]. The rationale for this approach is that the quantitative data and their subsequent analysis provide a general understanding of the effects of IC rehabilitation. The qualitative data and their analysis refine and explain the statistical results by exploring participants’ views more deeply.
III Quantitative Study
i Sample
From April 2017 to May 2019, patients diagnosed with IC in non-operative management were invited to participate in the RCT study. Consecutive patients at the Department of Vascular Surgery Outpatient Clinic were screened for inclusion and approached for study participation. The setting was one hospital and one municipal healthcare center in the Capital Region of Denmark. None of the patients had received any interventions before recruitment. Inclusion criteria were conservatively treated patients with newly diagnosed IC using clinical assessment and Ankle Brachial Index Test; age > 18 years; speak and understand Danish; able to provide informed written content; citizens of one of eight municipalities of Greater Copenhagen belonging to the local healthcare center; and expected able to manage transportation and perform the exercise [14]. Exclusion criteria were failure to understand and cooperate according to the trial instructions; comorbidity complicating physical activity and exercise training; and lack of informed content. Based on sample size calculations, 118 patients were included, 59 randomized to the rehabilitation group and 59 to the control group. The trial allocated 118 patients, with 1:1 individual randomization to either intervention or control group. When the informed consent was signed, baseline data were collected, and randomization was conducted. Computer-generated block randomization in four blocks was generated by an independent statistician and delivered in envelopes blinded by the investigator. Randomization was performed by ongoing inclusion numbers marked on the envelopes.
ii Quantitative Data Collection
Data collection was integrated across methods by constructing the quantitative questionnaires, qualitative semi-structured focus-group interviews, and an evaluating survey. Demographic and clinical data were obtained directly from the patients or the medical records. Maximal walking distance and pain-free walking distance were measured by the standardised treadmill walking test based on a graded protocol: 3.2 km/hour with a 2% increase every 2 minutes [15]. Daily physical activity was measured by the self-reported number of times per week of walking or physical exercise activity of at least 30 min. [16]. Diet was measured by a Danish validated diet questionnaire with a fat and a fish-fruit-green score. To achieve the term “healthy,” the score must be at least 75% in each score [5]. Before the treadmill test at 6 and 12 months, a self-reported general condition in the legs compared to baseline was measured. Smoking and alcohol consumption was measured by self-reported behaviour [7, 8]. The Hospital Anxiety and Depression Scale (HADS) was used to detect symptoms of anxiety and depression (scores > 8) [9]. The Vascular Quality of Life Questionnaire (VQ6) was used as a disease-specific instrument to evaluate QoL, where a higher value indicates better health status [4].
iii Quantitative Data Analysis
The quantitative analyses were mainly based on calculations of percentages and means. In addition, some of the analyses were performed using general linear regression models and logistic regression models with adjustment for either sex and age or baseline values, sex, and age. For all analyses, a significance level of 0.05 was used. All analyses were performed using SAS 9.4.
IV Qualitative Study
i Sample
Participants were sampled from the quantitative study population until information power was achieved [17]. To increase the depth of the participant’s experiences, two focus-groups interviews were conducted (November 21st, 2018), 6-months post-intervention. The ten participants, who have all been in the same intervention group simultaneously, participated in qualitative focus group interviews as a purposeful sample. All participants were residents in one of the eight local municipalities of Greater Copenhagen that fell under the healthcare center’s catchment area.
ii Qualitative Data Collection
Five participants in each focus group knew the vascular nurse from the inclusion in the study and the 2-hour group session. In order to create unity and to secure as safe an environment as possible for the focus group, the participants were matched with others who had been part of the same training team at the same period, and the interviews were held in well-known surroundings in the healthcare center. The number of five participants in each focus group was chosen to ensure each person’s opportunity to share insights and observations about the intervention and share their experiences and allow for more in-depth conversation [18]. A semi-structured interview guide for focus-group was used, which included the following themes: experiences with pedometer, logbook, and text messages, experiences with supervised exercise training, experiences with education about IC and healthy diet, experiences with barriers, support, and motivation, experiences of participating in rehabilitation, perception of knowledge about IC, perceptions of environment and togetherness with similar patients.
iii Qualitative Data Analysis
We used a thematic analysis approach to analyse qualitative data, which is a form of patterned recognition allowing for themes to emerge directly using inductive coding after the interviews were audio-recorded and transcribed verbatim. As described by Braun and Clarke, thematic analysis was used as a systematic approach to analyse data from the interviews. This inductive analysis was data-driven in a process that coded the data without trying to fit them into a pre-existing coding frame or any analytical preconceptions [19].
The thematic analysis was carried out in six phases: 1) Familiarizing with the data: Transcribing data, reading and re-reading the data, and noting initial ideas. 2) Generating initial codes: Coding features of interest systematically across the entire data set and collating data codes. 3) Searching for themes: Collating codes into potential themes and relevant themes. 4) Reviewing themes: Checking if the themes worked in relation to the coded extracts and the entire data set and generating a thematic analysis. 5) Defining and naming themes: Ongoing analysis to refine the specifics of each theme and the overall story the analysis tells, generating clear definitions and names for each theme. 6) Producing the report with a selection of vivid, compelling extract examples [19]. Transcripts were reviewed several times for familiarization of data. MS performed the initial coding and searching for themes. Reviewing themes and defining themes were performed by MS and a senior researcher in qualitative expertise, independently of each other. Six categories related to the intervention were initially identified: “team-spirit”, “management of the disease”, “motivational aspects”, “logbook, pedometer and text messages”, “rehabilitation exercise”, and “suggestion for changes”. These six categories were later refined into four categories fitted together from focus group interviews and open-ended questions from the survey: The shared community; pushing your own limits; spurred by pedometers and somebody waiting; and continuing new habits on your own.
Survey
I Sample and Data Collection
In addition to the quantitative RCT data and qualitative focus-group interviews, a supportive evaluation survey component embedded within the RCT design was conducted as a mixed-methods research methodology [20-22]. All 43 patients that completed the intervention were included as a maximum variation sampling. Over a period of sixteen months (April 9th, 2018, to August 5th, 2019), a survey (face-to-face) was collected the day the participant completed the intervention. The first 26 surveys were analysed and used to qualify themes and questions for the focus group interviews (Figure 2). The survey included both multiple-choice questions, closed-ended questions, and open-ended questions. The closed-ended questions in the survey covered the general condition of the patient’s legs, the physiotherapist-reported results of the six-minute walking test and 30-second chair stand test, participation in the exercise sessions, dietician session, nursing session, physical activity, smoking cessation, use and impact of pedometer and logbook. The open-ended part of the survey included the following questions: was a specific part of the rehabilitation particularly meaningful? Do you have any suggestions for the ideal rehabilitation programme? Or other comments? The survey took approximately 15 minutes to complete. It was finished by a dialogue about the design of the personalised motivational text messages if they wanted to receive them (Supplementary Table 1).
II Survey Data Analysis
The results from the open-ended questions were used to confirm the results from the closed-ended questions and to validate the results from the focus group interviews (information power) [11]. The participants’ experiences of the rehabilitation programme we revealed from the qualitative focus-group analysis were also found in the surveys: the importance of “togetherness” with other IC patients (the shared community); being pushed forward by professionals (pushing your own limits); motivated by pedometer and the education sessions (spurred by pedometer and health professionals); difficulty doing changes on your own; and a wish to continue with the exercise team (continuing new habits on your own). Mixed methods consist of analytic techniques applied to both the quantitative and the qualitative data as well as the integration of the two forms of data across the quantitative results and the qualitative findings and assessing how the information addresses the mixed-methods questions in the study. Inferences in mixed-methods research are conclusions or interpretations drawn from the separate quantitative and qualitative strands of the study and across the quantitative and qualitative strands [11].
Mixed-Methods Integration and Analysis
Integration occurred at several levels throughout the study. The integration involved merging the datasets in the parallel database variant and the questionnaire variant by transforming the qualitative results (codes, themes) into quantitative variables (count, constructs, scales) and statistically analysing these emergent variables with the quantitative dataset so that variables arising from the personal experiences of participants could be included in the analysis. A complex mixed-methods intervention design was used at the study design level to collect quantitative and qualitative data within an intervention trial. The primary design was the intervention, and qualitative data was added as a component during (convergent) and after the experiment (explanatory sequential) to enrich the intervention results [11]. In the initial qualitative and quantitative analysis, data were analysed separately. In this study, we consider the survey as both qualitative and quantitative, analysed in this tradition. The integrated analysis is shown as joint displays integrating qualitative and quantitative findings [23]. Integrating at the methods level was achieved through connecting as qualitative informants were sampled from the quantitative study population. Integration of the analysis and reporting was enabled through design by matching questions asked across the questionnaire, survey and semi-structured interview guide (Table 1).
Table
1:
Complementary quantitative and qualitative data. The CIPIC Rehab Study.
|
Quantitative Data Collected
Through Questionaries, Patient Medical Records And Survey With Closed-Ended
Questions |
Qualitative Data Collected Through Semi-Structured Focus Group
Interviews And Survey Open-Ended Questions |
|
Walking Distance ·
Treadmill test,
maximal walking distance ·
6-min walking
test ·
Self-reported
walking distance before claudication appears |
Walking Distance ·
Experiences with
walking ·
Managing physical
activity and burning leg pain
|
|
Physical Activity ·
Level of physical
activity/30 min/day ·
Use of pedometer
and logbook ·
30-second chair
stand test |
Physical Activity ·
What motivates
physical activity? ·
How do pedometer,
logbook impact physical activity |
|
The
Vascular Quality Of Life Questionnaire The
Hospital Anxiety And Depression Scale ·
Condition in the
legs compared to baseline |
The
Vascular Quality Of Life Questionnaire The
Hospital Anxiety And Depression Scale ·
Ability to walk
and feeling better mentally |
|
Healthy diet ·
Nutritional screening ·
Fat-fish-fruit green score (‘hjertekost’) ·
Changes in the score ·
Bmi and waist measurements |
Healthy diet ·
Was advice from the dietician useful? ·
Impact on changes? |
|
Participation in the intervention ·
Exercise sessions
(physiotherapist) ·
Education
(vascular nurse) ·
Education
(dietician) |
Participation in the
intervention ·
What do you think
about the sessions with the physiotherapist, nurse and dietitian? |
|
Components in the rehabilitation programme ·
Duration ·
Content ·
Setting |
Components in the rehabilitation programme ·
How should the ideal rehabilitation programme be? |
Integrating enabled us to match results for a particular topic, merge and weave together qualitative and quantitative findings in content-matched joint displays, where qualitative and quantitative findings were further analysed into mixed-methods inferences [23]. Senior expertise in mixed-methods research (DO) worked together with the first author during the process of mixed-methods inference to assess the fit between quantitative and qualitative findings as confirmation, expansion or discordance. Confirmation was achieved if the findings reinforced each other, expansion if the findings diverged or expanded insights of the rehabilitation programme and discordance if the findings were contradictory or in disagreement [24]. Thematic analyses process of the focus group interviews, and open-ended questions survey illustrated by meaning units, condenses meaning units and theme are shown in (Supplementary Table 2).
Validity and Reliability
In mixed-methods research, the validity of the quantitative findings and the reliability of the qualitative findings are crucial to the drawn inferences [25]. External validity is high in the RCT design since this population was included following Clinical Practice Guidelines on Diagnosis and Treatment of Peripheral Arterial Diseases [26]. Interpretive and theoretical validity in the qualitative study was ensured by using the participants’ own words and including theory on self-efficacy [27]. The reliability of the qualitative study was increased by investor triangulation, enabling the investigators to discuss the findings and agree on the best interpretations. Credibility was further improved using a well-established thematic and systematic qualitative methodology.
Results
Our results are shown as seven joint displays related to walking distance, physical activity, health-related quality of life, healthy diet, participation in the intervention and components of the rehabilitation. Table 2 shows that the qualitative and quantitative findings regarding walking distance confirmed each other. Quantitative evidence finds that walking distance increases significantly in the intervention group, and qualitative findings indicate that the intervention influences walking distance and management of burning leg pain. 6-min walking test improved on average 47 metres between baseline and 12 weeks follow-up. Correlation between patient perception of walking ability and maximal walking distance indicates a weak correlation, which is not statistically significant. Table 3 shows that the qualitative and quantitative findings regarding physical activity confirmed each other. Both datasets indicate that pedometer and logbook are powerful tools to increase daily physical activity with a lasting effect. 95% out of 43 participants in the intervention group used pedometer after 3 months, and 91% used logbook. At 6 months follow-up, 80% used pedometer and 61% used logbook. At 12 months follow up 73% used pedometer, and 40% used logbook. Physical activity at least 30/min/day was significantly higher in the intervention group compared to the control group after 6 months and 12 months (P=.010).
Table 2: Joint display related to walking distance and management of the disease.
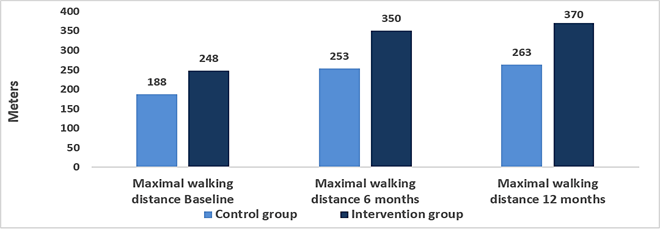
Maximum walking distance at baseline, 6 months and 12 months follow-up.
Quantitative Findings:
At 6 months, maximum walking distance increased 37% more in the intervention group compared to the control group (95% CI: 1.10-1.70; P=0.005) (see below). The main effect of intervention was adjusted for sex, age (continuous), and baseline value (time 0). The estimate is the exponential log-transformed mean difference for maximum walking distance, meaning the relative extra meters in the intervention group compared to the control group. At 12-months, walking distance increased 40 % more in the intervention group compared to the control group (95% CI: 1.09;1.80 p=0.008).
6-min walking test: In the intervention group (n=40), 6 min walking test improved on average 47 metres between baseline and 12 weeks follow-up (paired t-test: p<0.001).
30-second chair stand test: In the intervention group (n=39), the Chair stand test improved with 2 stands on average between baseline and 12 weeks follow-up (paired t-test: p<0.001).
To evaluate the association between the patients’ perception of walking abilities and the measured maximum walking distance, the correlation between self-reported walking distance before claudication appears and maximum walking distance was estimated (n=59). Both were measured at baseline: The analysis showed a Pearson correlation coefficient of 0.22 (p=0.09), which indicates that the two were weakly correlated at baseline (see below). This correlation was, however, not statistically significant.
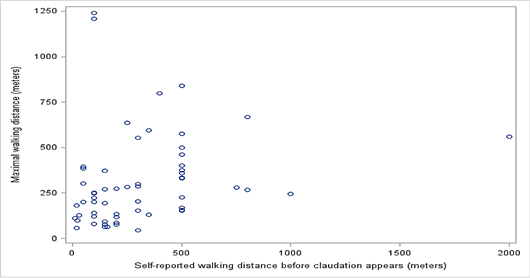
Correlation between self-reported walking distance before claudication appears and maximum walking distance.
Qualitative Findings:
The participants experienced significant burning leg pain during physical activity. The pain was described as “now my muscles are burning up” and occurred after physical activity. During the intervention, the participants expressed how they were encouraged and supported by the physiotherapist to exercise despite their leg pain. They explained how they had become convinced that training was an essential aspect of managing their disease and learning about the benefits of exercising despite the pain experienced in pushing their limits and delaying the onset of pain. A patient explained:
“…it hurts right away, but I am walking anyway because I’ve been told it helps - that it should cure me …so, I try to ignore it…and now I can walk one kilometre without my muscles burning up...” (D)
Mixed-Methods Inferences: Confirmation
Qualitative and quantitative findings regarding walking distance confirmed each other. Quantitative evidence finds that walking distance increases, and qualitative findings indicate that the intervention influences walking distance and management of burning leg pain.
Mixed-Methods Inferences: Discordance
Qualitative and quantitative findings regarding the perception of walking abilities and the measured maximum walking distance indicates that the two were weakly correlated, however not statistically significant.
Table
3:
Joint display related to physical activity, pedometer and logbook.
|
|
n (%) at baseline |
n (%) at 6 months |
n (%) at 12 months |
||||
|
|
Control group (n=59) |
Intervention group (n=59) |
Control group (n=47) |
Intervention group (n=46) |
Control group (n=46) |
Intervention group (n=47) |
|
|
Physical
activity min.30/min/day |
21 (36%) |
18 (31%) |
15 (32%) |
24 (52%) |
11 (25%) |
24 (52%) |
|
|
Physical activity 30/min/day was significantly
higher in the intervention group after 12 months (P=.010) Control group n=11 (25%) Intervention group n=24
(52%) |
|||||||
|
Intervention
group |
3 months n
(%) |
6 months n
(%) |
12 months n
(%) |
||||
|
|
n=43 |
n=49 |
n=49 |
||||
|
Use of pedometer |
41 (95%) |
39 (80%) |
36 (73%) |
||||
|
|
n=43 |
n=49 |
n=47 |
||||
|
Use of logbook |
39 (91%) |
30 (61%) |
19 (40%) |
||||
|
Quantitative
Findings: Physical
activity (self-reported) was significantly higher in the intervention group
compared with the usual care group (P=.002). The main part of participants in
the intervention group used pedometer at 3 months and at 6 months follow-up,
but use decreased to 73 % at 12 months follow-up. The logbook was also used
by most participants at 3 months follow-up, and 61% used logbook at 6 months
follow-up. At 12 months follow-up, use of logbook declined to 40% of the
participants. Among the users of a pedometer, 82% reported that it had “great
impact” at 6 months follow-up, and the same was reported by 52% of the users
at 12 months follow-up. Among the users of a logbook, 73% reported that it
had “great impact” at 6 months follow-up, and 44% of the users reported the
same at 12 months follow-up. |
|||||||
|
Qualitative Findings: The participants pointed out that they regarded
the pedometer as a powerful instrument for motivation and they felt obliged
to walk when they saw the numbers on the pedometer. Although almost all the
participants used the logbook, for some of them, it was only in the beginning
that they found it meaningful when they used it to map their walking route
routine. Others used the logbook every day and found it helped to motivate
them to go out for a walk and do something about their daily steps goal.
Patients explained: “…I am using the pedometer, looking at it every
day... I am completely dependent on that pedometer.”(B) “…at 11.45 p.m. my alarm rings on my phone and I
find the logbook and write my steps down...that logbook means everything for
me…” (F) |
|||||||
|
Mixed-Methods
Inferences: Confirmation Qualitative
and quantitative findings regarding physical activity and use of pedometer
and logbook confirmed each other. Both datasets indicate that pedometer and logbook
are powerful tools to increase daily physical activity. |
|||||||
Table 4 shows that the qualitative and quantitative findings regarding Vascular Quality of Life (VQ6) and general condition in the legs confirmed each other, while the quantitative and qualitative findings regarding. The Anxiety and Depression Scale (HADS) and general condition in the legs were discordant. Vascular Quality of Life (VQ6) is a validated disease-specific questionnaire that had a significantly better score in the intervention group compared with the usual care group at 6 and 12 months (P=.020). HADS showed no significant differences between the groups. The questionnaire is validated but not a disease-specific questionnaire. Cut-off values for both HADS-A and HADS-B are 8-10, indicating the possible presence of a mood disorder, and > 11, indicating the probable presence of a mood disorder. General self-reported condition in the legs compared to baseline showed that at 6 months, 9% in the control group and 28% in the intervention group felt that the condition was much better. At 12 months, 22% in the control group and 36% in the intervention group felt that the condition was much better. Participants who did not improve maximum walking distance and were asked about the general condition in the legs showed that 34% in the control group experienced better condition in the legs at 6 months follow-up. In comparison, 63% in the intervention group experienced the same.
Table
4:
Joint display regarding health-related quality of life (VQ6 & HADS) and
general condition in the legs.
|
Quantitative Findings: |
Results
of linear and logistic mixed models with explorative outcomes measured at 0, 6
and 12 months.
The
estimates are the crude proportions, medians or means and proportions with
outcomes in intervention and control groups. * N is the number of observations
where each person can have up to three observations. † P-value from interaction
term between the intervention group and time (0, 6 and 12 months). These were
adjusted for sex and age (continuous).
|
|
|
0 months |
6 months |
12 months |
|
|||
|
|
N * |
Control |
Intervention |
Control |
Intervention |
Control |
Intervention |
p-value † |
|
Vascular Quality of Life Questionnaire, means |
303 |
14.7 |
14.6 |
15.6 |
17.3 |
16.0 |
17.1 |
0.02 |
|
HADS-A > 8, % |
303 |
12% |
19% |
11% |
17% |
15% |
21% |
0.96 |
|
HADS-D > 8, % |
303 |
9% |
14% |
6% |
4% |
2% |
4% |
0.76 |
|
General condition in the legs compared to baseline |
303 |
- |
- |
9% |
28% |
22% |
36% |
|
|
Self-reported improvement in the legs among participants that did not
improve on their maximum walking distance (<60 metres difference) between
baseline and follow-up. |
||||||||
|
|
6 months |
12 months |
||||||
|
|
Control (n=32) |
Intervention (n=19) |
Chi2- p-value |
Control (n=26) |
Intervention (n=15) |
Chi2- p-value |
||
|
Self-reported improvement in the legs compared to baseline |
34% |
63% |
0.05 |
38% |
60% |
0.18 |
||
|
Quantitative Findings: Vascular Quality of Life
(VQ6) showed a significantly better score in the intervention group compared
with the usual care group at 6 and 12 months (P=.020). A higher value indicates
better health status. |
||||||||
|
The anxiety and depression scale (HADS) showed no significant
differences between the groups. High prevalence of anxiety and depressive disorders among patients
with PAD have previously been found. HADS score of 8-10 indicates the
possible presence of a mood disorder, and > 11 indicates the probable
presence of a mood disorder. |
||||||||
|
General self-reported
condition in the legs compared to baseline showed that at 6 months, 9% in the
control group and 28% in the intervention group felt that the condition was
much better. At 12 months, 22% in the control group and 36% in the
intervention group felt that the condition was much better. It is possible
that participants in the intervention group who did not improve on their
maximum walking distance still felt that they had improved their general
condition in the legs. Therefore, it was evaluated if the proportion of
participants with self-reported improvements in the legs at follow-up was
larger in the intervention group compared to the control group. This analysis
was only performed among participants without improvements in maximum walking
distance, and therefore more participants in the control group than in the
intervention group were included. The results showed that 34% of the
participants in the control group experienced better condition in the legs at
6 months follow-up. In the intervention group, 63% experienced the same. The
result was statistically significant (p=0.05). The same trend was seen
regarding results on 12 months follow-up, but the result was not
statistically significant (p=0.18). |
||||||||
|
Qualitative Findings: The participants expressed improvement in
well-being and feeling better mentally during the intervention. Knowledge
about the disease helped to manage the pain: “…in my head, it helps a lot
to know, now you are making… [collateral circulation] …now it is good…” (D);
“…It occurred to me…when it hurts it is doing good…” (J). When the
intervention ended, they felt it was difficult to exercise on their own, and
they felt sad about missing their exercise community: “…something
is missing afterwards. Walking alone is not the same …” (G); “I had a
mental downturn when it stopped…” (F). |
||||||||
|
Mixed-Methods Inferences: Concordance Qualitative and quantitative findings regarding
VQ6, general condition in the legs and feeling better mentally confirmed each
other as both indicated that participating in the intervention improved
quality of life and general condition in the legs. Knowledge about the
disease and feeling better mentally can explain the improvement in general
condition in the legs, as some of the patients did not improve walking
distance but an improved general condition in the legs. |
||||||||
|
Mixed-Methods
inferences: Discordance Qualitative
and quantitative findings regarding HADS, general condition in the legs, and
feeling better mentally were discordant as HADS showed no significant
difference between the groups and qualitative findings indicate a difference. |
||||||||
Qualitative and quantitative findings regarding VQ6, general condition in the legs and feeling better mentally confirmed each other as both indicated that participating in the intervention improved quality of life and general condition in the legs. Knowledge about the disease and feeling better mentally can explain the improvement in general condition in the legs, as some of the patients did not improve walking distance but an improved general condition in the legs. The qualitative and quantitative finding regarding HADS, general condition in the legs and feeling better mentally were discordant as HADS showed no significant difference between the groups and qualitative findings indicates that there was a difference.
Table 5 shows that the qualitative and quantitative findings regarding healthy diet expanded each other. Thus, even though only a few of the patients achieved the term “healthy”, additional quantitative sub-analyses showed that some changes in diet are possible, while the qualitative findings indicate that the participants could adapt some of the advice about a healthier diet. Table 6 shows that the qualitative and quantitative findings regarding exercise sessions and education sessions expanded each other. Education about the disease and diet is important, but most of all, the exercise sessions. A local setting, variation in exercise, team spirit, having fun, playing, and competition motivates. Per-protocol analyses of the 39 participants who completed at least 70% of the 24 exercise sessions indicate that participating in the intervention depends on what the participants expressed as important motivational factors. Table 7 shows that the qualitative and quantitative findings regarding components of the rehabilitation and the ideal rehabilitation programme confirmed each other. The quantitative findings showed that the main part of participants in the intervention wished to continue the training in a local setting. Qualitative findings showed a strong wish to continue exercise with the team and indicate that the programme fits patients with claudication well, with only a few suggestions to the ideal rehabilitation programme.
Table
5:
Joint table regarding a healthy diet.
|
Quantitative Findings: |
||||
|
Healthy diet total
scores |
n (%) value at baseline |
n (%) value at 6 months |
||
|
|
Control group (n=59) |
Intervention group
(n=59) |
Control group (n=47) |
Intervention group
(n=46) |
|
Achieved the term
healthy with a score of at least 75% in the fat-fish-fruit-green score |
0 (0%) |
1 (2%) |
0 (0%) |
5 (11%) |
Results
of linear and logistic mixed models measured at 0, 6 and 12 months.
The
estimates are the crude proportions, medians or means and proportions with
outcome in intervention and
control groups.
|
Healthy diet changes in scores |
|
0 months |
6 months |
12 months |
|
|||
|
|
N * |
Control |
Intervention |
Control |
Intervention |
Control |
Intervention |
p-value † |
|
Fat score, mean |
303 |
0.55 |
0.56 |
0.55 |
0.66 |
0.57 |
0.71 |
<0.0001 |
|
Fish-fruit-green score, mean |
303 |
0.43 |
0.43 |
0.40 |
0.53 |
0.41 |
0.55 |
<0.0001 |
* N is the number of observations where
each person can have up to three observations. † P-value from interaction term
between the intervention group and time (0, 6 and 12 months). These were
adjusted for sex and age (continuous).
|
Quantitative Findings: Healthy diet score
showed that only five patients in the intervention group achieved the term
“healthy” with a score of at least 75% in the fat score and the fish-fruit-green
score. Differences in the fat and fish-fruit-green scores analysed separately
showed a significantly higher score in the intervention group at 6 and 12
months (P<0001). In the
intervention group, it was on the items “Intake of nuts” (47%), “Less fat
cold cuts” (43%), “Breakfast cereals with more whole grains and fiber” (36%),
“Fish for lunch” (36%), and “Meat with less fat” (34%) that the largest
proportions had improved their diet between baseline and 12 months follow-up. |
|
Qualitative
Findings: 'The
participants described how they found it useful to learn about healthy food
from a dietician: “Even though
I am a chef, I got some good advice from the dietitian, so now I am eating
healthier”. Some participants found that their basic
knowledge about healthy food was limited and suggested splitting the
dietician’s sessions in two. If it had been possible to split the sessions,
the participants would have had an opportunity to practise some of the advice
in real life after a first session and then prepare questions in preparation
for a second dietary advice session. Participants also described difficulties
in changing their eating habits when they could not feel the difference in
their bodies or health right away. |
|
Mixed-Methods
Inferences: Expansion Qualitative
and quantitative findings regarding healthy diet expanded each other as the
quantitative findings in sub-analyses showed that some changes in diet are
possible, and the qualitative findings indicate that the participants could
adapt some of the advice about a healthier diet. |
Table
6:
Joint table regarding participating in the intervention - exercise sessions and
education sessions.
|
Quantitative Findings: |
|
Education session with vascular nurse had 39
participants out of 43 (91%). Education sessions with dietician had 36
participants out of 43 (84%). Only 16 participants out of 43 (37%) accepted
the offer of individual dietician guidance. In the per-protocol analyses, we included 39
patients who completed at least 70% of the 24 exercise sessions and
participated in the treadmill follow-up test at 6 months. These findings make
estimates and differences stronger in favour of the intervention group with a
further 50 metres longer walking distance that increased 45% more in the
intervention group compared with the control group (95% CI: 1.17-1.80;
P=.001). Improvement at the 6-month follow-up was 400 metres in the
intervention group versus 253 metres in the control group. |
|
Qualitative
Findings: All
participants expressed that education about the disease and diet is important
but highlighted the two talented physiotherapists. They described how a local
setting, the great variation in exercise, team spirit, having fun, playing,
and competition are motivational factors of participation. They looked
forward to what the physiotherapists would come up with next time because it
led to different and fun training every time. They described how to exercise
with others like themselves, so they do not feel alone, helped them get
going. A patient explained: “…It gives a
lot more, more power so you want to do everything when you share it and do it
in common.” |
|
Mixed-Methods Inferences: Expansion Qualitative and quantitative findings regarding
participating in the interventions exercise sessions with physiotherapists
and education sessions with vascular nurse and dietician expanded each other.
Quantitative findings indicated that participating in the intervention
depends on what the participants expressed in the qualitative findings of important
motivational factors. |
Table
7:
Joint table regarding components of the rehabilitation and the ideal
rehabilitation programme.
|
Quantitative Findings: |
|
A total of 35 participants out of 43 (81%) wished
to continue the training in the healthcare center or participate in a similar
programme if possible. |
|
Qualitative
Findings: Interdisciplinary
intervention in a local community setting with physiotherapists, vascular
nurse and dietician is important. There were only a few new suggestions on
how the ideal rehabilitation programme should be. Dietician sessions should
be split in two, allowing practising between the sessions and an experienced
senior dietician “in eye-level” with the participants. The 35 participants
who wished to continue the training after the 12-week intervention were very
sad when it ended. They expressed it very clearly: “I wish so much I could
continue the exercise in the team every week all year”. “I like the variation
in the exercises, and I wanted to continue with the team, even though I had
to pay for it.” |
|
Mixed-Methods Inferences: Confirmation Qualitative and quantitative findings confirmed
each other as both datasets show a strong wish to continue the exercise after
12-weeks, while the qualitative findings indicate that the programme fits
patients with claudication well, with only few suggestions to a new
programme. |
Discussion
This study integrated qualitative and quantitative factors affecting the intervention of a cardiovascular rehabilitation programme for patients with IC. The findings primarily confirmed and further expanded each other. However, two discordant results were also evident. The findings confirmed each other regarding walking distance, physical activity, Vascular Quality of Life (VQ6), general condition in the legs, and components of the rehabilitation and the ideal rehabilitation programme. The qualitative and quantitative findings regarding healthy diet expanded each other. The anxiety and depression scale (HADS) and general condition in the legs were discordant. There was a weak discordant correlation between perception of walking abilities and the measured maximum walking distance. In the CIPIC Rehab study, walking distance increased 37% more in the intervention group compared to the control group. Furthermore, per-protocol analyses showed a further 47 metres longer walking distance that increased 45% more in the intervention group compared with the control group (walking advice group). In per-protocol analyses, mean walking distance increased from 281 metres at baseline to 400 metres at 6-month follow-up in the intervention group and from 188-253 in the control group. The mean improvement in walking distance was 129 metres in the intervention group and 24 metres in the control group.
Over the past 30 years, treadmill-based SET programs have shown improvement in walking ability assessed by graded treadmill testing, and a meta-analysis of 25 randomized trials showed statistically significant 180 metres (95% CI, 130-238) improvement in maximum walking distance [1]. A multicenter randomized trial by Nicolaï and colleges included 304 patients with IC. Patients were randomized to exercise therapy in the form of “go home and walk” advice (WA) (as the control group in the CIPIC Rehab study), SET (treadmill) or SET (treadmill) with feedback (performance-based accelerometer) provided by a local physiotherapist. The median (interquartile range) change in walking distance between change in walking distance measured by a treadmill at 12 months and baseline in metres was 110 (0-300) in the walking advice group, 310 (145-995) in the SET group, and 360 (173-697) in the SET with feedback group (P<.001 WA vs SET) [28].
The CIPIC Rehab study showed that the 6-min walking test was improved by 47 metres in the intervention group. A study with structured home-based walking exercise intervention found improvement in the 6-min walking test from 41 to 53 metres at 6 months follow-up compared to a control group. In that study, the intervention improves the 6-minute walking distance more than it improves maximum walking distance at a treadmill test, whereas a supervised treadmill exercise intervention improves treadmill walking more than it improves the 6-minute walking test. Based on these randomized trials, it can be discussed that these results may be related to the fact that a supervised treadmill exercise intervention specifically trains the participants to the treadmill walking measure, whereas a structured intervention focuses on over-ground walking. Clinically meaningful change in the 6-minute walking test distance has been defined: A small change has been defined as 20 m, and a large, meaningful change has been defined as 50 m. However, these findings of meaningful change were not explicitly derived from people with PAD, but results were recognizable in the CIPIC Rehab study.
A systematic review of recruitment for RCT testing SET for patients with PAD concluded that 69% of 1541 eligible participants with PAD refuse participation, and many refuse because of SET programmes’ burdensome requirements [29]. The large number of people who find the demands of SET too difficult a community-based cardiovascular rehabilitation programme in a local setting as the CIPIC Rehab study could be a realistic and successful alternative, even though the effect on walking distance is not as high as in a supervised treadmill exercise intervention. The qualitative and quantitative findings regarding physical activity confirmed each other indicating that pedometer and logbook are important tools to increase daily physical activity. The effectiveness of pedometer interventions with goal setting and logbook for steps to promote walking has been documented in systematic and meta-analytic reviews that report such interventions can increase daily steps by approximately 2000 to 2500 steps per day [30]. The utility of pedometers or other wearable accelerometers has not been fully explored in exercise trials in patients with IC but holds promise [1]. A recent systematic review shows some evidence that home-based wearable activity monitors are beneficial for improving walking ability and quality of life in patients with IC [31]. In the CIPIC rehab study, we did not use pedometers to measure the participants' daily steps but only as a motivational tool for the individual patient. The participants’ experiences of using a pedometer and how great impact the pedometer had on their daily physical activity can be used in future clinical practice.
The qualitative and quantitative findings regarding Vascular Quality of Life (VQ6) and general condition in the legs confirmed each other, while the quantitative and qualitative findings regarding the anxiety and depression scale (HADS) and general condition in the legs were discordant. It is well known from systematic reviews that there are high prevalence rates of anxiety and depressive disorders among patients with PAD (11-48%) associated with comorbidity, lower-income, loneliness, and health behaviour [32]. An intervention with a specific focus on anxiety and depression might have changed the findings. However, changes in the disease specific VQ6 were significant and confirmed by participants who expressed that they were feeling better mentally. The qualitative and quantitative findings regarding healthy diet expanded each other. Despite the low percentage of “healthy” participants, primarily caused by low intake of vegetables and fruit, some changes in diet are possible. The participants find education about diet important with significant changes on the intake of nuts, cold cuts, whole grains, fish, and fat. It is well known that most patients with IC are overweight, have poor nutrition, with diets particularly high in saturated fat, sodium, and cholesterol, and low in fiber vitamins and minerals [33, 34]. Health behaviour is by nature challenging to change, and research has shown that despite evidence to support the benefits of dietary modification in risk reduction, adults with IC continue to consume poor diets [35]. The small but significant changes in diet in The CIPIC Rehab study are related to small changes easy to adapt to in everyday life.
Maybe small and easy changes should be a focus-area on future guidance instead of ambitions of fundamental changes in diet. The qualitative and quantitative findings regarding participating in the interventions exercise sessions with physiotherapists and education sessions with vascular nurse and dietician expanded each other. Group sessions and individual counselling were included in the intervention. As a knowledge, interactions with others, and the individual’s ability to perform and learn a new skill in the local environment contribute to enhancing participation and motivation [36, 37]. The participants highlighted that team spirit, having fun, playing, and competition were motivational factors indicating that a higher percentage of participation improved the walking distance and expanded motivation for participating. The qualitative and quantitative findings regarding components of the rehabilitation and the ideal rehabilitation programme confirmed each other. The qualitative analysis provided additional information regarding how the rehabilitation intervention may have improved and additional benefits experienced by the participant and programme evaluation.
Limitations
Because the questionnaire variant was used as an add-on to the quantitative instrument, the items generally do not result in a rigorous context-based qualitative data set, also called “mixed methods light” [11]. However, the qualitative database does provide emergent themes and interesting quotes that can be used to validate and embellish the quantitative survey findings. Other researchers like Bryanton and Weeks collected data based on a survey with multiple-choice questions and open-ended questions to gain multiple perspectives [20]. An inherent limitation of qualitative studies is their lack of generalizability. However, the findings are viewed as generalizable for IC patients. Validated scales were used in the quantitative study. The study only included the voices of the participant, leaving out the voice of other relevant parties, such as physiotherapists, dietician or politicians and administrators in the health care sector. Even though all stakeholders could not be included in this mixed-methods study, the voice of the patients was heard. Complex interventions have many potentials “active ingredients” that combine different components in a whole that is more than the sum of its parts. Randomized controlled trials are the most rigorous way to evaluate the effectiveness of interventions, regardless of their complexity. Because of their multifaceted nature in a social context, complex interventions pose methodological challenges [13]. “Good” randomized controlled trials have been defined as those having a high-quality intervention, adequate evaluation of the intervention and its delivery, documentation of external factors that may influence the outcome, and culturally sensitive intervention. The additional costs associated with this would probably be balanced by greater explanatory power and understanding of the generalizability of the intervention [13]. The use of validated instruments and conducting the survey face-to-face improved data collection.
Conclusion
The CIPIC Rehab study provides new empirical knowledge concerning rehabilitation for patients with IC. A combination of the quantitative results and qualitative findings provided valuable insights for interpreting the trial outcomes and understanding the feasibility of implementing the intervention in clinical practice. The findings of this study offer important guidance for a cardiovascular rehabilitation programme for patients with IC and add empirical evidence regarding how a mixed methods study can be used to obtain an understanding of a complex intervention.
Conflicts of Interest
None.
Ethical Approval
The study complied with the Declaration of Helsinki and was approved by the regional research ethics committee (J. No.:H-17004183) and the Danish Data Protection Agency (J.No.:2012-58-0004).
Consent
Informed written consent was given and signed.
Author Contributions
All authors have agreed on the final version with a substantial contribution to the concept, design, analysis, interpretation, and drafting of the article.
Funding
This study was funded by Danish Regions grant number [A968], Capital Region of Denmark - Centre for Clinical Research and Prevention grant number [P-2017-2-04] and [P-2019-2-03], Danish Nurses Organization grant number [A2227], and Novo Nordisk Foundation grant number [19 0C 0059070].
Article Info
Article Type
Research ArticlePublication history
Received: Tue 10, Aug 2021Accepted: Sat 04, Sep 2021
Published: Fri 01, Oct 2021
Copyright
© 2023 Maj Siercke. This is an open-access article distributed under the terms of the Creative Commons Attribution License, which permits unrestricted use, distribution, and reproduction in any medium, provided the original author and source are credited. Hosting by Science Repository.DOI: 10.31487/j.JICOA.2021.04.01
Figures & Tables
Table
1:
Complementary quantitative and qualitative data. The CIPIC Rehab Study.
|
Quantitative Data Collected
Through Questionaries, Patient Medical Records And Survey With Closed-Ended
Questions |
Qualitative Data Collected Through Semi-Structured Focus Group
Interviews And Survey Open-Ended Questions |
|
Walking Distance ·
Treadmill test,
maximal walking distance ·
6-min walking
test ·
Self-reported
walking distance before claudication appears |
Walking Distance ·
Experiences with
walking ·
Managing physical
activity and burning leg pain
|
|
Physical Activity ·
Level of physical
activity/30 min/day ·
Use of pedometer
and logbook ·
30-second chair
stand test |
Physical Activity ·
What motivates
physical activity? ·
How do pedometer,
logbook impact physical activity |
|
The
Vascular Quality Of Life Questionnaire The
Hospital Anxiety And Depression Scale ·
Condition in the
legs compared to baseline |
The
Vascular Quality Of Life Questionnaire The
Hospital Anxiety And Depression Scale ·
Ability to walk
and feeling better mentally |
|
Healthy diet ·
Nutritional screening ·
Fat-fish-fruit green score (‘hjertekost’) ·
Changes in the score ·
Bmi and waist measurements |
Healthy diet ·
Was advice from the dietician useful? ·
Impact on changes? |
|
Participation in the intervention ·
Exercise sessions
(physiotherapist) ·
Education
(vascular nurse) ·
Education
(dietician) |
Participation in the
intervention ·
What do you think
about the sessions with the physiotherapist, nurse and dietitian? |
|
Components in the rehabilitation programme ·
Duration ·
Content ·
Setting |
Components in the rehabilitation programme ·
How should the ideal rehabilitation programme be? |
Table 2: Joint display related to walking distance and management of the disease.
Maximum walking distance at baseline, 6 months and 12 months follow-up.
Quantitative Findings:
At 6 months, maximum walking distance increased 37% more in the intervention group compared to the control group (95% CI: 1.10-1.70; P=0.005) (see below). The main effect of intervention was adjusted for sex, age (continuous), and baseline value (time 0). The estimate is the exponential log-transformed mean difference for maximum walking distance, meaning the relative extra meters in the intervention group compared to the control group. At 12-months, walking distance increased 40 % more in the intervention group compared to the control group (95% CI: 1.09;1.80 p=0.008).
6-min walking test: In the intervention group (n=40), 6 min walking test improved on average 47 metres between baseline and 12 weeks follow-up (paired t-test: p<0.001).
30-second chair stand test: In the intervention group (n=39), the Chair stand test improved with 2 stands on average between baseline and 12 weeks follow-up (paired t-test: p<0.001).
To evaluate the association between the patients’ perception of walking abilities and the measured maximum walking distance, the correlation between self-reported walking distance before claudication appears and maximum walking distance was estimated (n=59). Both were measured at baseline: The analysis showed a Pearson correlation coefficient of 0.22 (p=0.09), which indicates that the two were weakly correlated at baseline (see below). This correlation was, however, not statistically significant.
Correlation between self-reported walking distance before claudication appears and maximum walking distance.
Qualitative Findings:
The participants experienced significant burning leg pain during physical activity. The pain was described as “now my muscles are burning up” and occurred after physical activity. During the intervention, the participants expressed how they were encouraged and supported by the physiotherapist to exercise despite their leg pain. They explained how they had become convinced that training was an essential aspect of managing their disease and learning about the benefits of exercising despite the pain experienced in pushing their limits and delaying the onset of pain. A patient explained:
“…it hurts right away, but I am walking anyway because I’ve been told it helps - that it should cure me …so, I try to ignore it…and now I can walk one kilometre without my muscles burning up...” (D)
Mixed-Methods Inferences: Confirmation
Qualitative and quantitative findings regarding walking distance confirmed each other. Quantitative evidence finds that walking distance increases, and qualitative findings indicate that the intervention influences walking distance and management of burning leg pain.
Mixed-Methods Inferences: Discordance
Qualitative and quantitative findings regarding the perception of walking abilities and the measured maximum walking distance indicates that the two were weakly correlated, however not statistically significant.
Table
3:
Joint display related to physical activity, pedometer and logbook.
|
|
n (%) at baseline |
n (%) at 6 months |
n (%) at 12 months |
||||
|
|
Control group (n=59) |
Intervention group (n=59) |
Control group (n=47) |
Intervention group (n=46) |
Control group (n=46) |
Intervention group (n=47) |
|
|
Physical
activity min.30/min/day |
21 (36%) |
18 (31%) |
15 (32%) |
24 (52%) |
11 (25%) |
24 (52%) |
|
|
Physical activity 30/min/day was significantly
higher in the intervention group after 12 months (P=.010) Control group n=11 (25%) Intervention group n=24
(52%) |
|||||||
|
Intervention
group |
3 months n
(%) |
6 months n
(%) |
12 months n
(%) |
||||
|
|
n=43 |
n=49 |
n=49 |
||||
|
Use of pedometer |
41 (95%) |
39 (80%) |
36 (73%) |
||||
|
|
n=43 |
n=49 |
n=47 |
||||
|
Use of logbook |
39 (91%) |
30 (61%) |
19 (40%) |
||||
|
Quantitative
Findings: Physical
activity (self-reported) was significantly higher in the intervention group
compared with the usual care group (P=.002). The main part of participants in
the intervention group used pedometer at 3 months and at 6 months follow-up,
but use decreased to 73 % at 12 months follow-up. The logbook was also used
by most participants at 3 months follow-up, and 61% used logbook at 6 months
follow-up. At 12 months follow-up, use of logbook declined to 40% of the
participants. Among the users of a pedometer, 82% reported that it had “great
impact” at 6 months follow-up, and the same was reported by 52% of the users
at 12 months follow-up. Among the users of a logbook, 73% reported that it
had “great impact” at 6 months follow-up, and 44% of the users reported the
same at 12 months follow-up. |
|||||||
|
Qualitative Findings: The participants pointed out that they regarded
the pedometer as a powerful instrument for motivation and they felt obliged
to walk when they saw the numbers on the pedometer. Although almost all the
participants used the logbook, for some of them, it was only in the beginning
that they found it meaningful when they used it to map their walking route
routine. Others used the logbook every day and found it helped to motivate
them to go out for a walk and do something about their daily steps goal.
Patients explained: “…I am using the pedometer, looking at it every
day... I am completely dependent on that pedometer.”(B) “…at 11.45 p.m. my alarm rings on my phone and I
find the logbook and write my steps down...that logbook means everything for
me…” (F) |
|||||||
|
Mixed-Methods
Inferences: Confirmation Qualitative
and quantitative findings regarding physical activity and use of pedometer
and logbook confirmed each other. Both datasets indicate that pedometer and logbook
are powerful tools to increase daily physical activity. |
|||||||
Table
4:
Joint display regarding health-related quality of life (VQ6 & HADS) and
general condition in the legs.
|
Quantitative Findings: |
Results
of linear and logistic mixed models with explorative outcomes measured at 0, 6
and 12 months.
The
estimates are the crude proportions, medians or means and proportions with
outcomes in intervention and control groups. * N is the number of observations
where each person can have up to three observations. † P-value from interaction
term between the intervention group and time (0, 6 and 12 months). These were
adjusted for sex and age (continuous).
|
|
|
0 months |
6 months |
12 months |
|
|||
|
|
N * |
Control |
Intervention |
Control |
Intervention |
Control |
Intervention |
p-value † |
|
Vascular Quality of Life Questionnaire, means |
303 |
14.7 |
14.6 |
15.6 |
17.3 |
16.0 |
17.1 |
0.02 |
|
HADS-A > 8, % |
303 |
12% |
19% |
11% |
17% |
15% |
21% |
0.96 |
|
HADS-D > 8, % |
303 |
9% |
14% |
6% |
4% |
2% |
4% |
0.76 |
|
General condition in the legs compared to baseline |
303 |
- |
- |
9% |
28% |
22% |
36% |
|
|
Self-reported improvement in the legs among participants that did not
improve on their maximum walking distance (<60 metres difference) between
baseline and follow-up. |
||||||||
|
|
6 months |
12 months |
||||||
|
|
Control (n=32) |
Intervention (n=19) |
Chi2- p-value |
Control (n=26) |
Intervention (n=15) |
Chi2- p-value |
||
|
Self-reported improvement in the legs compared to baseline |
34% |
63% |
0.05 |
38% |
60% |
0.18 |
||
|
Quantitative Findings: Vascular Quality of Life
(VQ6) showed a significantly better score in the intervention group compared
with the usual care group at 6 and 12 months (P=.020). A higher value indicates
better health status. |
||||||||
|
The anxiety and depression scale (HADS) showed no significant
differences between the groups. High prevalence of anxiety and depressive disorders among patients
with PAD have previously been found. HADS score of 8-10 indicates the
possible presence of a mood disorder, and > 11 indicates the probable
presence of a mood disorder. |
||||||||
|
General self-reported
condition in the legs compared to baseline showed that at 6 months, 9% in the
control group and 28% in the intervention group felt that the condition was
much better. At 12 months, 22% in the control group and 36% in the
intervention group felt that the condition was much better. It is possible
that participants in the intervention group who did not improve on their
maximum walking distance still felt that they had improved their general
condition in the legs. Therefore, it was evaluated if the proportion of
participants with self-reported improvements in the legs at follow-up was
larger in the intervention group compared to the control group. This analysis
was only performed among participants without improvements in maximum walking
distance, and therefore more participants in the control group than in the
intervention group were included. The results showed that 34% of the
participants in the control group experienced better condition in the legs at
6 months follow-up. In the intervention group, 63% experienced the same. The
result was statistically significant (p=0.05). The same trend was seen
regarding results on 12 months follow-up, but the result was not
statistically significant (p=0.18). |
||||||||
|
Qualitative Findings: The participants expressed improvement in
well-being and feeling better mentally during the intervention. Knowledge
about the disease helped to manage the pain: “…in my head, it helps a lot
to know, now you are making… [collateral circulation] …now it is good…” (D);
“…It occurred to me…when it hurts it is doing good…” (J). When the
intervention ended, they felt it was difficult to exercise on their own, and
they felt sad about missing their exercise community: “…something
is missing afterwards. Walking alone is not the same …” (G); “I had a
mental downturn when it stopped…” (F). |
||||||||
|
Mixed-Methods Inferences: Concordance Qualitative and quantitative findings regarding
VQ6, general condition in the legs and feeling better mentally confirmed each
other as both indicated that participating in the intervention improved
quality of life and general condition in the legs. Knowledge about the
disease and feeling better mentally can explain the improvement in general
condition in the legs, as some of the patients did not improve walking
distance but an improved general condition in the legs. |
||||||||
|
Mixed-Methods
inferences: Discordance Qualitative
and quantitative findings regarding HADS, general condition in the legs, and
feeling better mentally were discordant as HADS showed no significant
difference between the groups and qualitative findings indicate a difference. |
||||||||
Table
5:
Joint table regarding a healthy diet.
|
Quantitative Findings: |
||||
|
Healthy diet total
scores |
n (%) value at baseline |
n (%) value at 6 months |
||
|
|
Control group (n=59) |
Intervention group
(n=59) |
Control group (n=47) |
Intervention group
(n=46) |
|
Achieved the term
healthy with a score of at least 75% in the fat-fish-fruit-green score |
0 (0%) |
1 (2%) |
0 (0%) |
5 (11%) |
Results
of linear and logistic mixed models measured at 0, 6 and 12 months.
The
estimates are the crude proportions, medians or means and proportions with
outcome in intervention and
control groups.
|
Healthy diet changes in scores |
|
0 months |
6 months |
12 months |
|
|||
|
|
N * |
Control |
Intervention |
Control |
Intervention |
Control |
Intervention |
p-value † |
|
Fat score, mean |
303 |
0.55 |
0.56 |
0.55 |
0.66 |
0.57 |
0.71 |
<0.0001 |
|
Fish-fruit-green score, mean |
303 |
0.43 |
0.43 |
0.40 |
0.53 |
0.41 |
0.55 |
<0.0001 |
* N is the number of observations where
each person can have up to three observations. † P-value from interaction term
between the intervention group and time (0, 6 and 12 months). These were
adjusted for sex and age (continuous).
|
Quantitative Findings: Healthy diet score
showed that only five patients in the intervention group achieved the term
“healthy” with a score of at least 75% in the fat score and the fish-fruit-green
score. Differences in the fat and fish-fruit-green scores analysed separately
showed a significantly higher score in the intervention group at 6 and 12
months (P<0001). In the
intervention group, it was on the items “Intake of nuts” (47%), “Less fat
cold cuts” (43%), “Breakfast cereals with more whole grains and fiber” (36%),
“Fish for lunch” (36%), and “Meat with less fat” (34%) that the largest
proportions had improved their diet between baseline and 12 months follow-up. |
|
Qualitative
Findings: 'The
participants described how they found it useful to learn about healthy food
from a dietician: “Even though
I am a chef, I got some good advice from the dietitian, so now I am eating
healthier”. Some participants found that their basic
knowledge about healthy food was limited and suggested splitting the
dietician’s sessions in two. If it had been possible to split the sessions,
the participants would have had an opportunity to practise some of the advice
in real life after a first session and then prepare questions in preparation
for a second dietary advice session. Participants also described difficulties
in changing their eating habits when they could not feel the difference in
their bodies or health right away. |
|
Mixed-Methods
Inferences: Expansion Qualitative
and quantitative findings regarding healthy diet expanded each other as the
quantitative findings in sub-analyses showed that some changes in diet are
possible, and the qualitative findings indicate that the participants could
adapt some of the advice about a healthier diet. |
Table
6:
Joint table regarding participating in the intervention - exercise sessions and
education sessions.
|
Quantitative Findings: |
|
Education session with vascular nurse had 39
participants out of 43 (91%). Education sessions with dietician had 36
participants out of 43 (84%). Only 16 participants out of 43 (37%) accepted
the offer of individual dietician guidance. In the per-protocol analyses, we included 39
patients who completed at least 70% of the 24 exercise sessions and
participated in the treadmill follow-up test at 6 months. These findings make
estimates and differences stronger in favour of the intervention group with a
further 50 metres longer walking distance that increased 45% more in the
intervention group compared with the control group (95% CI: 1.17-1.80;
P=.001). Improvement at the 6-month follow-up was 400 metres in the
intervention group versus 253 metres in the control group. |
|
Qualitative
Findings: All
participants expressed that education about the disease and diet is important
but highlighted the two talented physiotherapists. They described how a local
setting, the great variation in exercise, team spirit, having fun, playing,
and competition are motivational factors of participation. They looked
forward to what the physiotherapists would come up with next time because it
led to different and fun training every time. They described how to exercise
with others like themselves, so they do not feel alone, helped them get
going. A patient explained: “…It gives a
lot more, more power so you want to do everything when you share it and do it
in common.” |
|
Mixed-Methods Inferences: Expansion Qualitative and quantitative findings regarding
participating in the interventions exercise sessions with physiotherapists
and education sessions with vascular nurse and dietician expanded each other.
Quantitative findings indicated that participating in the intervention
depends on what the participants expressed in the qualitative findings of important
motivational factors. |
Table
7:
Joint table regarding components of the rehabilitation and the ideal
rehabilitation programme.
|
Quantitative Findings: |
|
A total of 35 participants out of 43 (81%) wished
to continue the training in the healthcare center or participate in a similar
programme if possible. |
|
Qualitative
Findings: Interdisciplinary
intervention in a local community setting with physiotherapists, vascular
nurse and dietician is important. There were only a few new suggestions on
how the ideal rehabilitation programme should be. Dietician sessions should
be split in two, allowing practising between the sessions and an experienced
senior dietician “in eye-level” with the participants. The 35 participants
who wished to continue the training after the 12-week intervention were very
sad when it ended. They expressed it very clearly: “I wish so much I could
continue the exercise in the team every week all year”. “I like the variation
in the exercises, and I wanted to continue with the team, even though I had
to pay for it.” |
|
Mixed-Methods Inferences: Confirmation Qualitative and quantitative findings confirmed
each other as both datasets show a strong wish to continue the exercise after
12-weeks, while the qualitative findings indicate that the programme fits
patients with claudication well, with only few suggestions to a new
programme. |
*All participants who completed the intervention were included (n=43) before or after the conducted focus-group interviews.
I: Intervention Group; C: Control Group.
References
1. Treat Jacobson D,
McDermott MM, Bronas UG, Campia U, Collins TC et al. (2019) Optimal Exercise
Programs for Patients With Peripheral Artery Disease: A Scientific Statement
From the American Heart Association. Circulation 139: e10-e33. [Crossref]
2. Creswell JW, Plano
Clark VL (2018) Designing and Conducting Mixed Methods Research. Thou Oaks
SAGE Publi 544.
3. Siercke M, Jørgensen LP, Missel M, Thygesen LC, Møller
SP et al. (2021) Cardiovascular Rehabilitation Increases Walking Distance in
Patients With Intermittent Claudication. Results of the CIPIC Rehab Study: A
Randomised Controlled Trial. Eur J Vasc Endovasc Surg S1078-5884:
00299-00309. [Crossref]
4. Kumlien C,
Nordanstig J, Lundström M, Pettersson M (2017) Validity and test retest
reliability of the vascular quality of life Questionnaire-6: a short form of a
disease-specific health-related quality of life instrument for patients with
peripheral arterial disease. Health Qual Life Outcomes 15: 187. [Crossref]
5. Hjerteforeningen,
Lipidklinikken, Hjertekost (2014) Valideret skema: Department of Cardiology,
Aalborg University Hospital & The Danish Heart Foundation.
6. Siercke M, Berg SK, Missel M (2021) Spurred by
pedometers, unity and fun exercise: A qualitative study of participation in
rehabilitation for patients with intermittent claudication (The CIPIC Rehab
study). J Vasc Nurs 39: 59-66.
7. Molina AJ,
Fernández D, Delgado M, Martín V (2010) Sensitivity and specificity of a
self-administered questionnaire of tobacco use; including the Fagerström test. Int
J Nurs Stud 47: 181-189. [Crossref]
8. Sobell LC, Brown J,
Leo GI, Sobell MB (1996) The reliability of the Alcohol Timeline Followback
when administered by telephone and by computer. Drug Alcohol Depend 42:
49-54. [Crossref]
9. Bjelland I, Dahl
AA, Haug TT, Neckelmann D (2002) The validity of the Hospital Anxiety and
Depression Scale. An updated literature review. J Psychosom Res 52:
69-77. [Crossref]
10. SST (2013) National
Clinical Guideline on Cardiac Rehabilitation. Dan Heal Autho.
11. Creswell WJ, Plano
Clark VL (2018) Designing and conducting mixed methods research. Los Ange:
SAGE 3.
12. Siercke M,
Jørgensen LP, Missel M, Thygesen LC, Blach PP et al. (2020) Cross-sectoral
rehabilitation intervention for patients with intermittent claudication versus
usual care for patients in non-operative management - the CIPIC Rehab Study:
study protocol for a randomised controlled trial. Trials 21: 105. [Crossref]
13. Oakley A, Strange
V, Bonell C, Allen E, Stephenson J et al. (2006) Process evaluation in
randomised controlled trials of complex interventions. BMJ 332: 413-416.
[Crossref]
14. Ankle Brachial
Index Collaboration, Fowkes FGR, Murray GD, Butcher I, Heald CL et al. (2008)
Ankle brachial index combined with Framingham Risk Score to predict
cardiovascular events and mortality: a meta-analysis. JAMA 300: 197-208.
[Crossref]
15. Nicolaï SPA,
Viechtbauer W, Kruidenier LM, Candel MJJM, Prins MH et al. (2009) Reliability
of treadmill testing in peripheral arterial disease: a meta-regression
analysis. J Vasc Surg 50: 322-329. [Crossref]
16. Klarlund Pedersen
B, Andersen LB (2018) Fysisk aktivitet - håndbog om forebyggelse og behandling.
Kbh.: Dani Heal Author: SST, Rosen-Schul Dist 4.
17. Malterud K, Siersma
VD, Guassora AD (2016) Sample Size in Qualitative Interview Studies: Guided by
Information Power. Qual Health Res 26: 1753-1760. [Crossref]
18. Krueger RA, Casey
MA (2015) Focus Groups: A Practical Guide for Applied Research. SAGE Publi
5.
19. Braun V, Clarke V
(2006) Using thematic analysis in psychology. Qual Res Psych 3: 77-101.
20. Bryanton O, Weeks
LE (2014) Informing the Development of Educational Programs to Support Older
Adults in Retiring From Driving. Educ Geront 40: 756-766.
21. O’Cathain A, Murphy
E, Nicholl J (2010) Three techniques for integrating data in mixed methods
studies. BMJ 341: c4587. [Crossref]
22. Adamson J, Ben
Shlomo Y, Chaturvedi N, Donovan J (2009) Exploring the impact of patient views
on ‘appropriate’ use of services and help seeking: a mixed method study. Br
J Gen Pract 59: e226-e233. [Crossref]
23. Guetterman TC,
Fetters MD, Creswell JW (2015) Integrating Quantitative and Qualitative Results
in Health Science Mixed Methods Research Through Joint Displays. Ann Fam Med
13: 554-561. [Crossref]
24. Fetters MD, Curry
LA, Creswell JW (2013) Achieving integration in mixed methods
designs-principles and practices. Health Serv Res 48: 2134-2156. [Crossref]
25. Johnson RB,
Christensen LB (2019) Educational Research: Quantitative, Qualitative, and
Mixed Approaches.
26. Aboyans V, Ricco
JB, Bartelink MLEL, Björck M, Brodmann M et al. (2018) Editor's Choice - 2017
ESC Guidelines on the Diagnosis and Treatment of Peripheral Arterial Diseases,
in collaboration with the European Society for Vascular Surgery (ESVS). Eur
J Vasc Endovas Surg 55: 305-368. [Crossref]
27. Flick U (2014) An
Introduction to Qualitative Research. Los Ange: SAGE 5: 587.
28. Nicolaï SPA,
Teijink JAW, Prins MH, Exercise Therapy in Peripheral Arterial Disease Study
Group (2010) Multicenter randomized clinical trial of supervised exercise
therapy with or without feedback versus walking advice for intermittent
claudication. J Vasc Surg 52: 348-355. [Crossref]
29. Harwood AE, Smith
GE, Cayton T, Broadbent E, Chetter IC (2016) A Systematic Review of the Uptake
and Adherence Rates to Supervised Exercise Programmes in Patients with
Intermittent Claudication. Ann Vasc Surg 34: 280-289. [Crossref]
30. Bravata DM, Smith
Spangler C, Sundaram V, Gienger AL, Lin N et al. (2007) Using pedometers to
increase physical activity and improve health: a systematic review. JAMA
298: 2296-2304. [Crossref]
31. Chan C, Sounderajah
V, Normahani P, Acharya A, Markar SR et al. (2021) Wearable Activity Monitors
in Home Based Exercise Therapy for Patients with Intermittent Claudication: A
Systematic Review. Eur J Vasc Endovasc Surg 61: 676-687. [Crossref]
32. Brostow DP, Petrik
ML, Starosta AJ, Waldo SW (2017) Depression in patients with peripheral
arterial disease: A systematic review. Eur J Cardiovasc Nurs 16:
181-193. [Crossref]
33. Gardner AW, Bright
BC, Ort KA, Montgomery PS (2011) Dietary intake of participants with peripheral
artery disease and claudication. Angiology 62: 270-275. [Crossref]
34. Sagris M,
Kokkinidis DG, Lempesis IG, Giannopoulos S, Rallidis L et al. (2020) Nutrition,
dietary habits, and weight management to prevent and treat patients with
peripheral artery disease. Rev Cardiovasc Med 21: 565-575. [Crossref]
35. Delaney CL, Miller
MD, Dickinson KM, Spark JI (2014) Change in dietary intake of adults with
intermittent claudication undergoing a supervised exercise program and compared
to matched controls. Nutr J 13: 100. [Crossref]
36. Raedeke TD, Dlugonski D (2017) High Versus Low Theoretical Fidelity Pedometer Intervention Using Social-Cognitive Theory on Steps and Self-Efficacy. Res Q Exerc Sport 88: 436-446. [Crossref]
37. Bandura A (1977) Self-efficacy: toward a unifying theory of behavioral change. Psychol Rev 84: 191-215. [Crossref]