Identification of Prognosis-Related Genes of Acute Myeloid Leukemia
A B S T R A C T
Background: Acute myeloid leukemia (AML) is a clinically and genetically heterogeneous hematological malignancy and relapse is the main reason for the poor therapeutic effect and low survival rate. Bioinformatic technology could screen out relative genes that promote the recurrence of AML, providing a theoretical basis for further improving the precision stratification treatment of AML.
Methods: In this study, gene expression profiles of Dataset Acute Myeloid Leukemia (OHSU, Nature 2018) and GSE134589 were downloaded from cBioPortal and GEO, respectively. R software and limma packages were used to identify the DEGs and then run GO enrichment, KEGG pathway, and PPI network. CIBERSORTx was used to enumerate tumor-infiltrating immune cells. Prognosis-related genes were selected by univariate and multivariate Cox proportional hazards regression analyses and the expression of them were verified by GEPIA. Kaplan-Meier curve analysis could compare the survival time. ROC curve analysis was performed to predict the value of the selected genes.
Results: Functional analysis showed that the up-regulated DEGs were strikingly enriched in Cytokine-cytokine receptor interaction and positive regulation of cytokine production, and the down-regulated DEGs in the regulation of cell-cell adhesion, TNF signaling pathway. CIBERSORTx analysis revealed that the immune response of AML acted as an intricate network and proceeded in a tightly regulated way. Cox analysis showed that ALDH1L2, KLK1, and LRRN2 were correlated with AML prognosis.
Conclusion: ALDH1L2, KLK1, and LRRN2 are prognosis-related genes in AML, which may, together with some immune pathways, induce poor prognosis and can be used as potential biomarkers in AML treatment.
Keywords
Acute myeloid leukemia, bioinformatic analysis, AML microenvironment, prognosis, relapse
Introduction
Acute myeloid leukemia (AML) is a clinically and genetically heterogeneous disease characterized by malignant clonal proliferation of myeloid progenitors in the hematopoietic system, resulting in the accumulation of leukemic blasts in the bone marrow (BM) and blood [1]. Traditional chemotherapy combined with hematopoietic cell transplantation (HCT) as a fundamental strategy for AML has changed significantly in the past few years, on account of the U.S. Food & Drug Administration (FDA) has approved several new drugs for AML, including Glasdegib, Venetoclax, and others [2-7]. Notwithstanding the above, deaths due to disease persistence and recurrence remain constant, and overall survival for AML patients remains poor. About 20-30% of patients never achieve complete remission (CR) after first-line intensive treatment and 50% relapse after CR accomplishment [1, 8].
In recent years, in addition to the advent of new drugs that profoundly affect the treatment landscape of AML, the use of cytogenetic abnormalities and gene mutations for risk stratification and prognosis assessment has also been further improved with the deepening understanding of the pathogenesis of AML [9-12]. The 2017 edition of the European LeukemiaNet (ELN) recommendations for diagnosis and management of AML in adults, including a revised version of the risk stratification by genetics. For example, monosomal karyotype, RUNX1, ASXL1, and TP53 mutations have been added as features of the adverse-risk group due to their independent associations with risk [13-17]. However, according to this proposal, approximately 30% of AML patients are still listed as having intermediate-risk, many of whom do not carry prognostic nuclear abnormalities or gene mutations, and the choice of the ideal strategy remains unclear. Therefore, the current risk stratification and prognosis assessment of AML patients need to be further improved. Considering that the incidence of AML relapse remains one of the major problems in AML treatment and that patients with relapsed AML respond less to treatment and have poorer overall survival. We selected 709 adult AML patients from TCGA and GEO datasets, including those with de novo AML and relapsed AML patients, to screen relapse-related genes and explore their influence on the prognosis of AML patients so as to provide a theoretical basis for hierarchical management of relapsed AML.
Notably, AML is composed not only of leukemic cells but also of non-leukemic cells, in which the immune microenvironment may play an important role in promoting the development and recurrence of AML [18]. In recent years, several promising preclinical and clinical immunotherapies, including immune checkpoint inhibitors and active or passive immunotherapies, have shown promising results in a variety of cancers, but the effect is not obvious for AML, suggesting that AML has a unique mechanism to evade treatment [19-23]. To better understand the role of immunity in AML, we summarized the number of immune cells in AML from the perspective of the diversity and nature of infiltrating immune cells in AML. CIBERSORTx is a multifunctional transfer algorithm based on gene expression that quantifies cell components from gene expression profiles of large tissues [24]. In this study, we used CIBERSORTx to enumerate 22 different functional immune cell types in AML to define the landscape of relapsed AML and de novo AML. More importantly, we studied its relationship and survival with other immune cells. We hope this study will provide some important information about the complex mechanisms in the incidence of AML relapse and help to improve treatment strategies for AML.
Materials and Methods
I Dataset Collection
The gene expression profile of Dataset GSE134589 was downloaded from Gene Expression Omnibus (GEO) database (https://www.ncbi.nlm.nih.gov/geo/). This dataset contains the RNA-sequencing profiling of 432 acute myeloid leukemia samples. Except for complete remission patients, we included 368 diagnosis samples and 35 relapsed samples to compare the mRNA levels of relapsed patients and those with de novo. Gene expression profile of Dataset Acute Myeloid Leukemia (OHSU, Nature 2018) was downloaded from cBioPortal for Cancer Genomics (cBioPortal) database (http://www.cbioportal.org/). This dataset contains 672 acute myeloid leukemia samples (with 454 matched normals) and both provided RNA sequencing data and clinical information. A total of 266 de novo and 40 relapsed AML patients were included in the analysis, excluding M3 leukemia (according to the French-American-British (FAB) classification systems).
II Identification of Differentially Expressed Genes (DEGs) in Relapsed and de novo AML Patients
Ensemble BioMart databank GRCh37.p13 version supplied annotations to selected genes, and differentially expressed genes (DEGs) between relapsed and de novo patients were defined as those genes with |log2FC| > 1.5, p-value < 0.05. Package ‘limma’ was used to screen out the DEGs between relapsed and de novo AML samples. The volcano plot was completed by the ‘ggpubr’ and the ‘ggthemes’ package in R 4.0.1.
III Functional and Pathway Enrichment Analysis
To examine a complete collection of functional annotations of DEGs, Gene Ontology (GO) term enrichment analysis and Kyoto Encyclopedia of Genes and Genomes (KEGG) pathway analysis were performed by using the ‘cluster Profiler’ R package. The ‘cluster Profiler’ R package was also used for the visualization of GO and KEGG results. p-value<0.05 was set to be significant. ‘Cluster Profiler’ is a package of ‘Bioconductor’, it implements methods to investigate and visualize functional profiles (GO and KEGG) of gene and gene clusters. The download code is “BiocManager::install("Cluster Profiler")”.
IV Protein-Protein Interaction Network (PPI) Analysis and Visualization
The STRING online database provided PPI (protein-protein communication) information (https://string-db.org/). We used the STRING database to investigate the interactions between DEGs and visualize the results using Cytoscape software. Cytoscape MCODE plug-in provided access to select the significant modular of PPI network. The patterns default parameters as follows: node density cutoff=0.1, node score cutoff=0.2, degree cut off=2, k-core=2, and max. depth=100. For genes in the hub module, we use ClueGO+CluePedia for functional enrichment analysis.
V Enumeration of Tumor-Infiltrating Immune Cells
CIBERSORTx is a powerful immune infiltrate analysis tool that can distinguish between each immune cell subtype and precisely calculate and quantify different immune cell proportions. The obtained p-value indicates the statistical significance and can help filter out samples with insignificant efficiency. Before running CIBERSORTx, the gene expression data downloaded from cBioPortal and GEO datasets must be processed as described by Binbin Chen et al. [25]. Then, the data was uploaded to the CIBERSORTx internet portal with some permutations being set to 100 (https://cibersortx.stanford.edu/). Related proportions of 22 infiltrating immune cells together with CIBERSORTx metrics of CIBERSORTx P-value, Pearson correlation coefficient, and root mean squared error (RMSE) were evaluated for each sample concurrently. Samples with P < 0.05 in CIBERSORTx analysis result were used in further analysis. Mann-Whitney U test was used to compare differences in immune cell subtypes in relapsed and de novo groups.
VI Construction of a Prognostic Signature
Univariate Cox proportional hazards regression analysis was performed to investigate the influence of each gene on overall survival. With the cutoff of p<0.05, DEGs were considered to be prognosis-related. Multivariate Cox proportional hazards regression analysis was further performed on the prognosis-related genes. Cox proportional hazards regression with a p<0.05 was set for risk score of developing relapsed AML in the patient. According to the mean risk score, patients were divided into low and high-risk groups. The Kaplan-Meier curve analysis was further conducted to estimate the relationship between the risk score and overall survival. p<0.05 was a significant cutoff. Time-dependent receiver operating characteristic (ROC) curve analysis was also performed to evaluate the 4-year predictive value of the outcomes, and the area under the curve (AUC) of the ROC curve was calculated to examine the classifier performance.
VII Validation of Real Prognosis-Related Genes
The prognosis-related genes were finally validated in Gene Expression Profiling Interactive Analysis (GEPIA: http://gepia.cancer-pku.cn/). Differential expression of AML patients and their normal samples were compared by using the GEPIA database. Genes with statistically significant differences in expression were defined as the ‘real’ prognosis-related genes.
VIII Statistical Analysis
The log1.5FC values of the computationally selected mRNAs were already normalized by R package. The Student’s t-test was used to compare gene expression between relapsed and de novo AML groups. Univariate and multivariate Cox regressions were conducted by using the ‘survival’ package in R package. The OS between different groups was compared by Kaplan-Meier analysis with the log-rank test. All statistical analyses were performed with R software, and statistical significance was set at probability values of p < 0.05.
Results
I Identification of DEGs
Complete clinical data and RNA sequence data of 306 non-M3 AML patients (266 patients with de novo AML and 40 patients with relapsed/refractory AML) and 403 archival BM samples (n=368 with de novo AML and n=35 with relapsed/refractory AML) from the GEO database were contained in our present study. The subtypes were classified according to the FAB classification systems in which M3 subtype was removed from the present analysis regarding the separate properties. Through the limma software package, 451 and 55 DEGs from OHSU and GSE134589 were extracted, respectively. The differential expression of varied genes from two sets of sample data included in each of the two datasets is shown in (Figures 1A & 1B). Results showed that a total of 451 DEGs were detected in OHSU dataset, including 86 downregulated genes (logFC< - 1.5) and 365 up-regulated genes (logFC> 1.5), and 55 DEGs were identified in GSE134589, including 18 downregulated genes (logFC< - 1.5) and 37 up-regulated genes (logFC> 1.5).
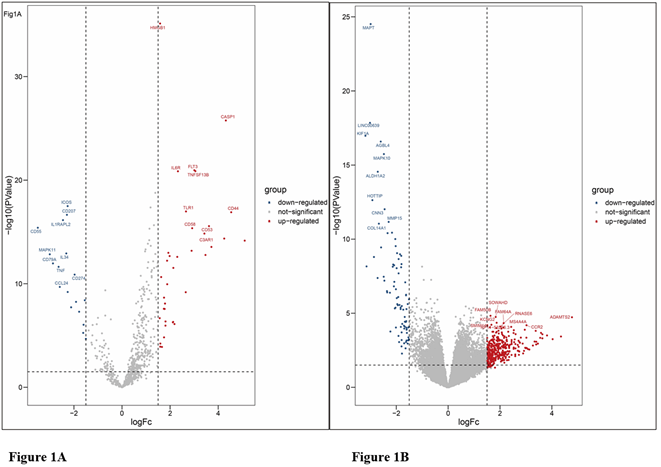
Figure 1: Volcanic maps of all genes. A) Volcanic maps of GSE134589 dataset; B) Volcanic maps of OHSU dataset. Red spot, the expression is up-regulated; Blue spot, the expression is down-regulated; Gray spot, not significantly dysregulated.
II Functional and Pathway Enrichment Analysis of DEGs
The results of functional and pathway enrichment analysis are shown in (Figures 2A-2E). Gene Ontology (GO) analysis of up-regulated DEGs in OHSU showed that DEGs were related to leukocyte migration, the regulation of ion transmembrane transport, negative regulation of cell activation, T cell-mediated immunity, and positive regulation of interleukin-8. Gene Ontology (GO) analysis of down-regulated DEGs of OHSU showed no functional or pathway enriched. Gene Ontology (GO) analysis of down-regulated DEGs of the GSE134589 dataset showed that regulation of cell-cell adhesion, leukocyte proliferation, positive regulation of T cell activation, and proliferation events were mostly enriched. Among the functional and pathway enrichment analysis, the Cytokine-cytokine receptor interaction events, TNF-signaling pathway, and RIG-I-like receptor signaling pathway were enriched most. Gene Ontology (GO) analysis of up-regulated DEGs of GSE134589 dataset showed that positive regulation of cytokine production, leukocyte migration, lymphocyte and mononuclear cell proliferation, as well as cytokine biosynthetic and metabolic process, were mostly enriched. Among the functional and pathway enrichment analysis, Cytokine-cytokine receptor interaction, hematopoietic cell lineage, viral protein interaction with cytokine and cytokine receptor, Toll-like receptor signaling pathway, and Th17 cell differentiation were enriched most.

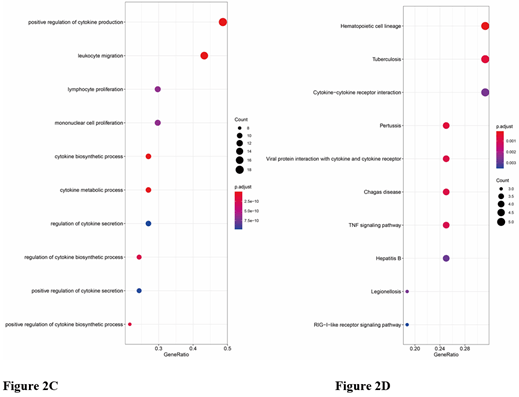

Figure 2: Functional and pathway enrichment analysis of DEGs. A) The GO biological process enrichment analysis of up-regulated DEGs of OHSU. B-E) The bubble chart showed the top 10 pathways with a significant difference in GSE134589. B) The GO biological process enrichment analysis of down-regulated DEGs. C) The GO biological process enrichment analysis of up-regulated DEGs. D) The KEGG enrichment analysis of down-regulated DEGs. E) The KEGG enrichment analysis of up-regulated DEGs.
III PPI Network and Analysis on Clusters
STRING mapped 451 DEGs of OHSU and 55 DEGs of GSE134589 into two PPI networks containing 278, 54 nodes and 863, 352 edges, respectively. (Figures 3A & 3B). Then MCODE was used to discover clusters in the network. Four clusters (the top two significant modules of each dataset) were selected for GO term and KEGG pathway enrichment analysis. Among them, cluster 1 of OHSU contained 22 nodes and 102 edges, with the highest score (Figure 3C), cluster 2 contained 11 nodes and 25 edges (Figure 3D), cluster1 of GSE134589 contained 20 nodes and 66 edges (Figure 3E), cluster 2 of GSE134589 contained 13 nodes and 58 edges (Figure 3F). We then combined the 4 clusters of two data sets for ClueGo analysis. The results show that the positive regulation of mononuclear cell proliferation, leukocyte migration, cytokine biosynthetic process, lymphocyte proliferation, phospholipase activity, and T cell costimulation events were mostly enriched (Figure 4).
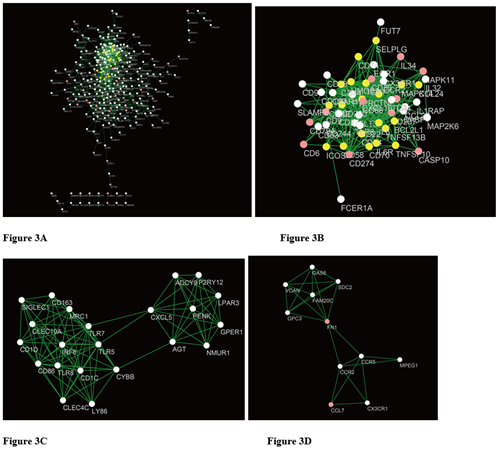

Figure 3: A) The PPI analysis of OHSU at STRING (Link). B) The PPI analysis of GSE134589 at STRING. C) & D) Cluster analysis of the OHSU PPI network [C). Cluster1; D) Cluster2]. E) & F) Cluster analysis of the GSE134589 PPI network [E) Cluster1; F) Cluster2].

Figure 4: GO and KEGG analyses on the hub modules.
IV The Landscape of Immune Infiltration in Relapsed and de novo AML Patients
We first exhibited the landscape of 22 immune cell subpopulations infiltration in AML, and subsequently, we investigated the difference between relapsed and de novo patients using the CIBERSORTx algorithm. The portion of immune cells varied distinctly between groups. Compared with de novo AML, relapsed AML contained a greater number of neutrophils. However, plasma cells, T cells CD4 naive, macrophages M2, T cells CD4 memory resting, dendritic cells resting, mast cells resting, and eosinophils fractions were relatively lower (Table 1, Figure 5A). The proportions of 22 TIICs were weakly-to-strongly correlated in AML. T cells CD4 naive and T cells gamma delta showed the strongest positive correlation (Pearson correlation=0.34), while T cells CD4 naive and monocytes showed the strongest negative correlation (Pearson correlation=0.28). Altogether, these results revealed that the immune response of AML acted as an intricate network and proceeded in a tightly regulated way (Figure 5B).
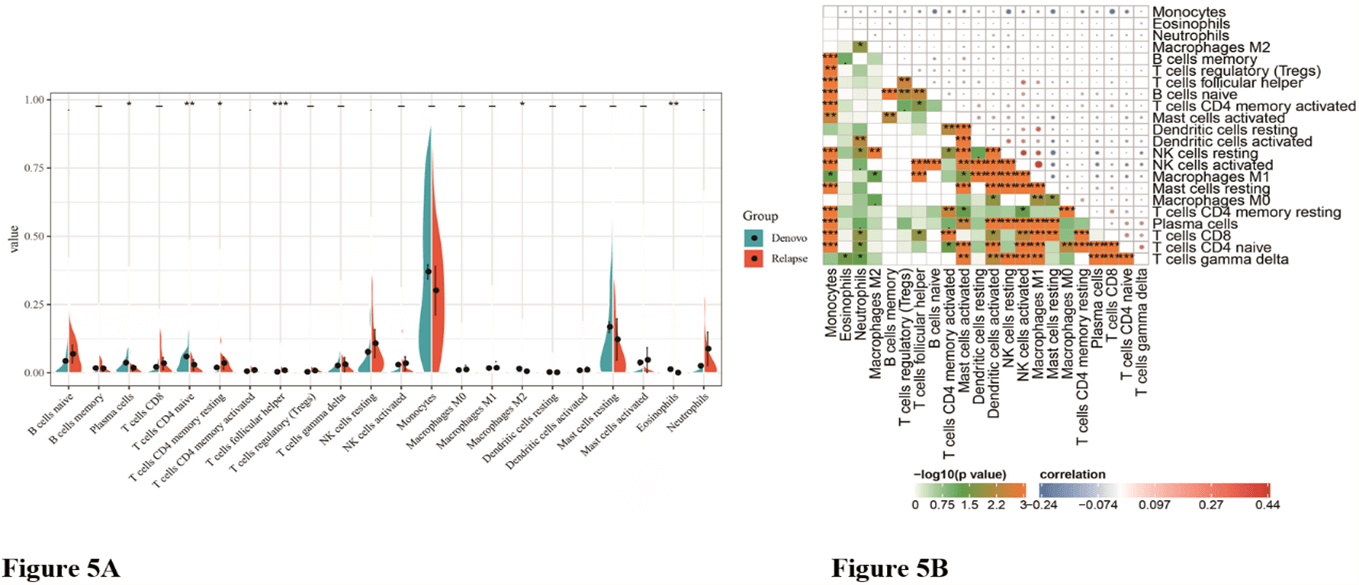
Figure 5: The difference of immune infiltration between de novo AML and relapsed AML. A) Violin plot visualizing the differentially infiltrated immune cells; B) Correlation heatmap depicting correlations between infiltrated immune cells in AML.
|
Cell type |
CIBERSORT fraction in %
of all infiltrating immune cells (mean± SD) |
|
||
|
B cells naive |
0.042±0.060 |
0.069±0.077 |
0.111 |
|
|
B cells memory |
0.017±0.033 |
0.015±0.023 |
0.741 |
|
|
Plasma cells |
0.036±0.043 |
0.018±0.025 |
0.002 |
|
|
T cells CD8 |
0.021±0.033 |
0.034±0.053 |
0.245 |
|
|
T cells CD4 naive |
0.060±0.071 |
0.029±0.047 |
0.006 |
|
|
T cells CD4 memory
resting |
0.019±0.044 |
0.035±0.053 |
0.150 |
|
|
T cells CD4 memory
activated |
0.005±0.011 |
0.009±0.021 |
0.303 |
|
|
T cells follicular
helper |
0.003±0.010 |
0.009±0.017 |
0.124 |
|
|
T cells regulatory
(Tregs) |
0.003±0.017 |
0.007±0.023 |
0.443 |
|
|
T cells gamma delta |
0.026±0.033 |
0.030±0.062 |
0.747 |
|
|
NK cells resting |
0.076±0.100 |
0.107±0.121 |
0.229 |
|
|
NK cells activated |
0.029±0.054 |
0.034±0.060 |
0.711 |
|
|
Monocytes |
0.370±0.252 |
0.301±0.210 |
0.136 |
|
|
Macrophages M0 |
0.009±0.019 |
0.011±0.037 |
0.801 |
|
|
Macrophages M1 |
0.017±0.045 |
0.018±0.054 |
0.890 |
|
|
Macrophages M2 |
0.015±0.029 |
0.005±0.013 |
0.002 |
|
|
Dendritic cells resting |
0.002±0.001 |
0.001±0.003 |
0.788 |
|
|
Dendritic cells
activated |
0.008±0.027 |
0.010±0.027 |
0.749 |
|
|
Mast cells resting |
0.167±0.187 |
0.122±0.180 |
0.245 |
|
|
Mast cells activated |
0.037±0.090 |
0.047±0.109 |
0.684 |
|
|
Eosinophils |
0.012±0.037 |
0.001±0.002 |
<0.001 |
|
|
Neutrophils |
0.025±0.054 |
0.088±0.144 |
0.045 |
|
The significance of bold
values is p < 0.05.
V Identification of Clinical Implications of TIICs Subsets
Owning to the missing survival data in included GEO datasets, we investigated whether there was a statistical relationship between specific TIICs and AML overall survival obtained from OHSU by univariate Cox regression using the survival R package. After a restriction of the CIBERSORTx filter to P < 0.05, there were 53 patients with available data on overall survival. Only two meaningful TIICs subsets were selected. T cells CD4 memory activated (HR=22492961.769; z=2.130; P=0.033) and macrophages M2 (HR=1575810.697; z=1.983; P=0.047) were both significantly associated with a poor outcome (Figure 6A). The corresponding Kaplan-Meier curve is depicted in (Figure 6B). The distribution of risk score, survival status was also analysed (Figure 6C).
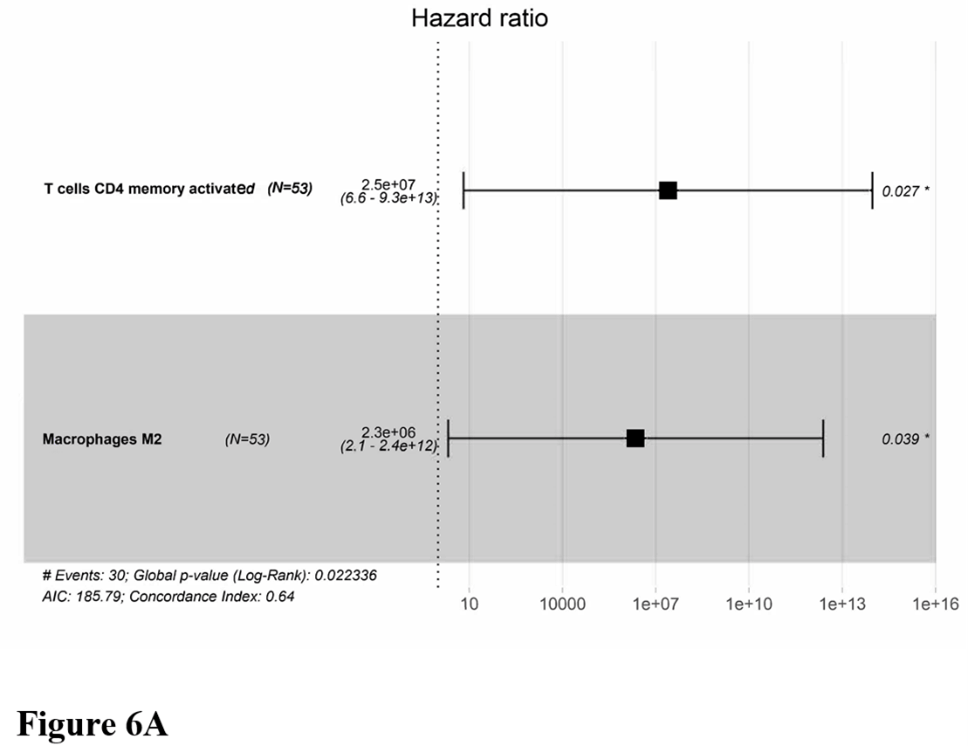

Figure 6: Clinical implications of TIICs subsets. A) Forest map of multivariate cox regression. B) Survival plots of the median of immune cell subpopulations showed no statistical significance. C) The risk scores according to TIICs subsets for all patients in the OHSU cohort are plotted in ascending order and marked as low risk (blue) or high risk (red), as divided by the threshold (vertical black line).
VI Identification of Prognostic Signature
Of the OHSU data containing patient clinical information with 451 DEGs, the univariate Cox proportional hazards regression analysis screened out 27 prognostic-related genes. We then used the GEPIA database to verify the expression levels of obtained genes and screened 5 genes were significantly different between AML patients and healthy controls (Figures 7A-7E); multivariate Cox proportional hazards regression analysis was further performed on. The 5 genes, which screened ALDH1L2, KLK1, and LRRN2. The risk score for predicting overall survival was calculated as follows: Risk score=0.344* ALDH1L2+0.309* KLK1+ 0.254* LRRN2 (Figure 8A). According to the risk score, patients were divided into low- and high-risk groups. Survival analysis showed that low-risk patients had longer overall survival than high-risk patients (Figure 8B). The distribution of risk score, survival status was shown in (Figure 8C). The AUC of the 4-year survival TIME ROC curve analysis was 0.73 (Figure 8D).
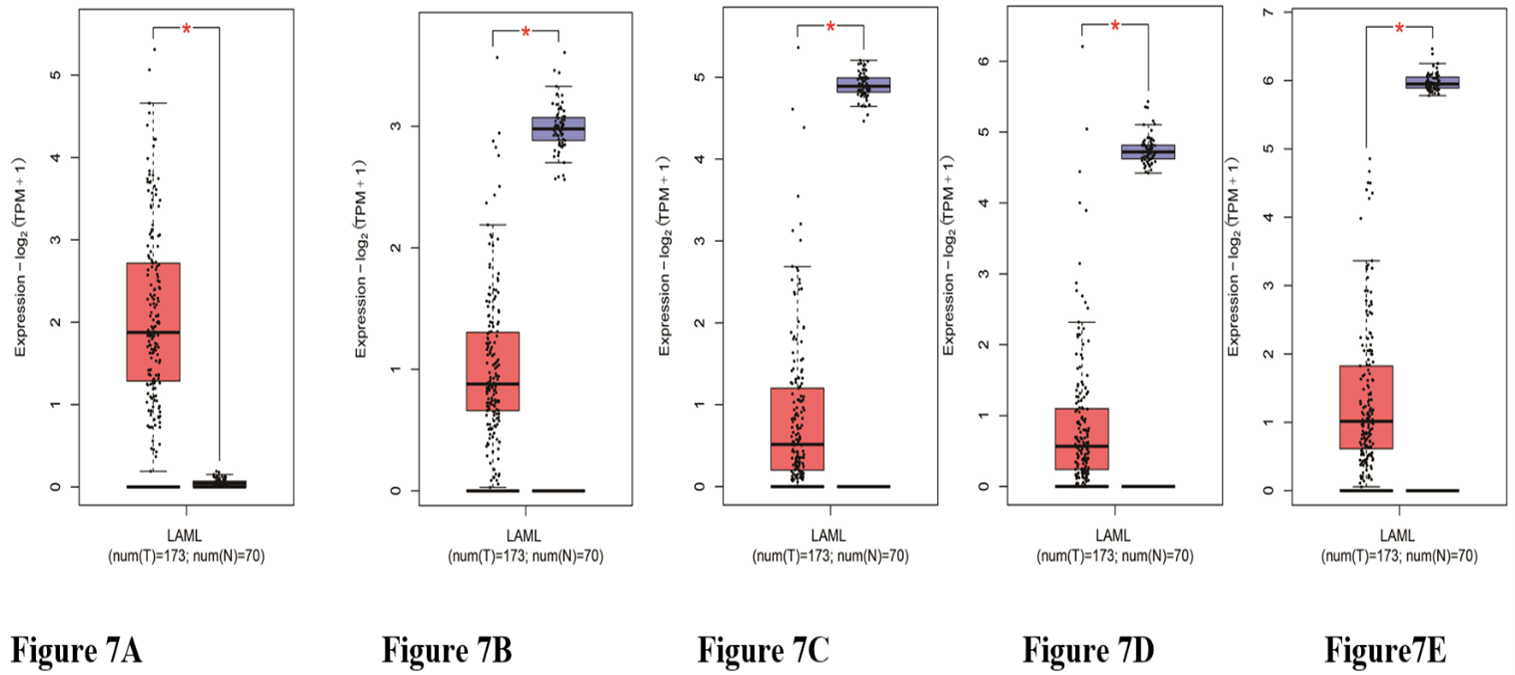
Figure 7: The expression of the prognosis-related genes between AML patients and their normal samples. A) LRRN2 B) ALDH1L2. C) KLK1. D) PROS1. E) PSAT1. Red represents AML samples; Blue represents healthy control samples.


Figure 8: Survival prognosis model on the 3 prognosis-related genes. A) Forest map of multivariate cox regression. B) Survival analysis showed that the patients in the high-risk group had worse overall survival than those in the low-risk group in the OHSU cohort. C) The risk scores according to prognosis-related genes for all patients in the OHSU cohort are plotted in ascending order and marked as low-risk (blue) or high-risk (red), as divided by the threshold (vertical black line). D) ROC analysis was performed to calculate the most optimal cutoff value to divide the AML patients into high-risk and low-risk groups.
Discussion
In this study, we screened out AML relapse-related DEGs based on TCGA and GSE134589 datasets. The up-regulated DEGs were strikingly enriched in the immune signaling pathway, Cytokine-cytokine receptor interaction, toll-like receptor signaling pathway, and Th17 cell differentiation, and the down-regulated DEGs in Cytokine-cytokine receptor interaction, tumor necrosis factor (TNF)-signaling pathway and RIG-I-like receptor signaling pathway. We further screened out 332 hub DEGs, most of which were enriched in the positive regulation of mononuclear cell proliferation, leukocyte migration, cytokine biosynthetic process, lymphocyte proliferation, phospholipase activity, and T cell costimulation events. Cytokine-cytokine receptor interaction plays a significant role in the pathogenesis of various types of lymphomas [26]. Toll-like receptors (TLRs) and RIG-I-like receptors (RLRs) are protective immune guards, which can initiate signaling pathways completing activation of NF-kappaB, MAP kinases, and IRFs that manage the transcription of genes encoding type I interferon and other inflammatory cytokines [27, 28].
Previous studies have delineated that TLRs are in connection with hematopoietic damage, leading to expanded HSC proliferation and an increased bias toward myeloid cell differentiation, contributing its strength to the development of hematopoietic malignancies and bone marrow failure [29-32]. This may be owing to the release of pro-inflammatory cytokines that could form a microenvironment accessory to promoting tumorigenesis. Th17 cells were known as a subgroup of Th cells showing pro-inflammatory as well as tumor-promoting qualities in diverse cancer types [33, 34]. The TNF-signaling pathway is a principal mediator of apoptosis, inflammation, and immunity, and it has been implicated in the pathogenesis of a broad spectrum of human diseases, including diabetes, cancer, and different type of inflammatory diseases [35]. Similarly, researchers have illustrated that regulation of phospholipase activity fosters the development of tumors [36]. It is not difficult to find that DEGs were mainly enriched in the immune regulation, as same as inflammation and apoptosis pathways, exhibiting pro-inflammatory and tumor-promoting characteristics, play an important role in generating a microenvironment conducive to the extension of tumor cells. All these findings point out the possible relationship between some DEGs and relapsed AML development, which may give a new direction for relapsed AML research.
Through the enrichment of DEGs, we found that most of the genes related to the recurrence of AML are gathered in the immunocorrelation pathways. Earlier studies have also told that the immune response plays an essential role in the evolution and migration of various tumors, and immunotherapy and targeted therapy are also considered as two dominant agents in tumor therapy in addition to chemotherapy. Therefore, in this study, the CIBERSORTx algorithm was used to presume the percentage of 22 TIICs subsets from AML transcriptomes from OHSU and GSE134589 databases and to reveal distinguished patterns of TIICs in initial and recurrent AML, as well as the associations between different immune cell subsets with clinical outcomes. We observed notable differences in immune cell composition between relapsed AML and de novo AML. Compared with de novo AML, relapsed AML contained a greater number of neutrophils. However, plasma cells, T cells CD4 naive, macrophages M2, T cells CD4 memory resting, dendritic cells resting, mast cells resting, and eosinophils fractions were relatively lower.
Moreover, our work validated the findings that certain immune cell subsets can also predict clinical outcomes besides the Immunocore. By univariate Cox regression analysis, we found that T cells CD4 memory activated and macrophages M2 are significantly associated with poor outcome. Paradoxically, in this study, the immune cell subpopulation, which forecasted poor prognosis, did not have a significantly high expression in relapsed AML. On the contrary, macrophages M2 expressed lower than that of de novo AML, while T cells CD4 memory activated made no significant difference. Since only two data sets were included in this study, and only 53 patients in one data set were used for immune-related prognostic analysis, more clinical data will be needed to investigate the role of immune cell subsets in relapsed AML. It is worth noting that in multiple situations, the immune function may vary greatly, although there is no difference in the number of immune cells. Subsequent studies can specifically study the functions of T cells and macrophages in the recurrence of AML.
We found the expression of ALDH1L2, KLK1, and LRRN2 were significantly different in relapse and de novo AML and were negatively related to the overall survival of the AML patients. ALDH1L2 encodes for a mitochondrial FDH and is involved in controlling the metabolic period of tetrahydrofolate (THF) in mitochondria. In recent years, the significance of mitochondrial metabolism in tumor cells has attracted more and more attention. ALDH1L2 has been shown to promote melanoma metastasis in vivo, and shorter survival has been reported in colorectal and lung adenocarcinoma studies [37-39]. KLK1 belongs to the serine protease family of proteolytic enzymes, and growing evidence suggests that many KLKs are implicated in carcinogenesis [40]. LRRN2, also known as GAC1, was found overexpressed in malignant gliomas and is a candidate for the target gene in the 1q32.1 amplicon in malignant gliomas [41]. In the present study, we verified the prognostic value of ALDH1L2, KLK1, and LRRN2 in AML, which broadens the landscape of ALDH1L2, KLK1, and LRRN2 research and can guide the future exploration into relapsed AML mechanism.
Acknowledgment
This work was supported by the [Key Medical Projects of Jiangsu Province #1] under Grant [number BE2017747]; [Key Medical of Jiangsu Province #2] under Grant [number ZDXKB2016020] and [Jiangsu Social Development Project#3] under Grant [number BE2018711].
Conflicts of Interest
None.
