Journals
Effect of Different Level of Molasses Inclusion on Feed Intake, Body Weight Gain and Carcass Parameters of Afar Bull
A B S T R A C T
The experiment was conducted to evaluate the effect of supplementing different levels of molasses concentrates mix with a basal diet of cultivated pasture hay on intake, body weight and carcass quality of Afar bull. The experiment included three bulls in each group and a total of 12 bulls with mean initial live weight of 158 ± 1.20 kg, were used for the experiment in a complete randomized block design (RCRD). The experiment was consisted of 180 days of feeding trial followed by carcass evaluation. The concentrate mix were 2:1 (wheat bran and Cotton seed cake) The CP content of the cultivated hay, concentrate mix and molasses were 9.16, 25.2, and 3.8 %, respectively. Results showed that, the mean final weight for Tx1, Tx2, Tx3, Tx4 were 271.65Kg, 255.83kg, 243.79kg and 239.50 respectively. Significant differences in daily body weight gain and final body weight among the treatment were observed but carcass parameters were not significantly recorded. The Tx1 and Tx2 have a tendency to achieve a higher average daily weight gain (ADG), final body weight, hot carcass weight and feed conversion efficiency compared with Tx3 and Tx4. From the present study, it can be concluded that, the inclusion of 20% molasses in the diet of a mixed ration of Afar bulls can be finished with good performance without adverse effect on health. Further studies are required on the effects of age and feeding duration on carcass characteristics of Afar bulls.
Keywords
Afar,bulls,carcass characteristics,feed,treatment
Background and justification
Ethiopia is a home for many livestock species and suitable for livestock production. It is believed to have the largest livestock population in Africa [1-3]. An estimate indicates that the country is a home for about 55 million cattle, 27.3 million sheep and 28.16 million goats. From the total cattle population 98.95% are local breeds and the remaining are hybrid and exotic breeds. 99.8% of the sheep and nearly all goat population of the country are local breeds [1]. Afar region is predominating by pastoral communities whose livelihood is entirely dependent on livestock herding. The livestock sector is also dependent on the natural pasture of the range lands. However, almost all of the available range lands of the region are characterized as over grazed. Therefore, low quality and inadequacy of feeds as well as malnutrition are considered to be the major constraints hampering productivity of livestock in the region. Cattle breed in Afar region is believed to be multipurpose, though mainly used for milk production traditionally [4]. It is characterized by its resistance to feed shortage, diseases and heat stress. Cattle play a significant role, directly or indirectly, in achieving food self-sufficiency as well as a means of investment [5]. Feed and water scarcity in quality and quantity especially during the long dry season are among noted production constraints of the livestock sector [6]. Feed production covers requirements only in exceptional good years; the deficit reaching 35% in normal years and 70% in bad years (FAO, 2005). Molasses is a sticky dark by-product of processing sugar cane or sugar beets into sugar. Molasses can be a source of quick energy and an excellent source of minerals for farm animals and even humans. Molasses can also be a key ingredient for cost effective management of feeds and pastures. The calcium content of sugar cane molasses is high (up to one percent), whereas the phosphorus content is low. Cane molasses is also high in sodium, potassium, magnesium and sulphur.
Molasses can reduce the dusty powdery nature of some finely ground feeds. In this role, it makes a feed mixture more palatable and edible to livestock. Molasses can be added to replace missing sugar and trace minerals and help with fermentation in cases of low-quality forages especially with low sugar levels. Supplementing poor quality hay with molasses will increase feed intake and improve palatability. Microbes in the rumen break down the sugars in molasses rapidly, which extensively causes a rapid release of energy that makes molasses very useful for balancing other feeds in the dairy diet all year round. It is important to distinguish between low- and high-level usage of all types of molasses. At low levels (<20 percent of the diet dry matter), the effect of the soluble carbohydrates in the molasses tends to be complementary rather than competitive and there appears to be little or no depression in the degree to which the basal feed resource is fermented. Beyond a concentration of 20 percent in the diet dry matter, there is increasing competition for substrate by the rumen microorganisms, with the result that the basal diet is used less and less efficiently according to the amount of molasses that is fed.
When molasses accounts for more than 50 percent of the diet, the digestibility of all types of feeds that accompany the molasses is depressed often to the point of only half the value recorded when molasses is not given (Encarnación and Hughes-Jones, 1981). These effects are obviously undesirable if the accompanying feed is composed mainly of cell wall carbohydrate: however, if the feed is rich in protein, starch or lipids-which can be digested by gastric enzymes in the small intestine-then depressing the extent to which these nutrients are fermented in the rumen becomes an advantage to the host animal.
To minimize the impact of fluctuations in seasonal feed availability, supplementation of concentrates is known to improve intake and digestibility of roughages [7]. In Afar region even though to get commercial concentrate is very difficult and expensive, fortunately enough Tendaho sugar factory has already started producing molasses which can be used as a supplement to all kind of animals. However, how to feed molasses to the animals and how much they should be offered need a deep study. Therefore, the objective of this study is to determine how much molasses should be offered to animals without compromising weight loss and any health problems.
Specific objectives
✔ To assess the comparative feeding value of molasses as replacement for Energy sources. ✔ To promote molasses as energy feed sources for growing Afar Bull.
Materials & Methods
I Description of the study area
The experiment was conducted at Dubti Pastoral and Agro Pastoral Research Center (DPARC), Ethiopia. The site is located between latitude 110 27’ North; longitude 410 20’ East and an altitude of 382 meter above sea level. The mean annual rainfall and temperature of the area is 400 mm and 34.1 °C, respectively. The types of soil in the study area are sandy loam soil. The major vegetation cover of the area is Prosopis juliflora, Acacia nilotica and other acacia species.
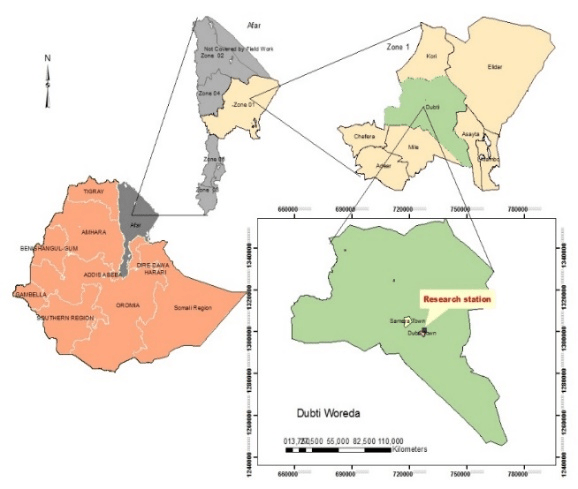
Figure 1: study area
II Management of animals
A total of twelve healthy Afar bulls with the age of 1.3-1.5 years were purchased from local markets in Asayta. Age of each animal was estimated using dental examination. The purchased bulls were reached at Dubti Pastoral and Agro-pastoral Research Center; each experimental animal kept in quarantine for about three weeks and treated for internal and external parasites by using Albendazole and accarcide respectively. They were also vaccinated against pasteurollosis and anthrax using anthelmintic and acaridae and they penned based on their body weight under experimental diet.
III Experimental design and treatments
A randomized complete block design (RCBD) was used for the experiment. At the end of the quarantine period, animals were blocked into four blocks of three animals each based on initial live weight, and animals within a block were randomly assigned to one of the four treatments. At the end of the quarantine period, animals were blocked into 4 treatments based on their body weight (Table 1). Treatments consisted of mixed concentrate + 20% inclusion molasses (T1), mixed concentrate + 15% inclusion molasses (T2), mixed concentrate + 10% inclusion molasses (T3) and 0% inclusion (T4). Supplements were offered twice a day at 8:00 and 16:00 h in two equal portions. Hay and mixed concentrate refusals were collected, weighed, and discarded before the morning meal. Roughage will be made available to the animals ad libitum. And water will also be made available for free choice. After 21 days of adaption periods the amount of feeds provided for the experimental bulls were slightly increased based on the weight change of the bulls. Each treatment groups were kept under the respective dietary rations for 180days and then feeding of bulls were stopped for carcass evaluation.
Table 1: Treatment arrangement
|
Ratio of Concentrate mix |
Treatments |
|
||
|
1CSC:2 WB |
Tx1 (20% molasses) |
Tx2 (15% molasses) |
Tx3 (10% molasses) |
Tx4 (0% molasses) |
|
|
3 |
3 |
3 |
3 |
CSC: Cotton seed cake; WB: Wheat bran
IV Feeds and feed preparation
Irrigated improved pasture hay of Panicum antidotal was used as a basal diet for this experiment. The grass/hay used for the study was harvested at 50% heading dried and stored under shade. Supplemental feeds were used for the study are concentrate mix with molasses inclusion.
V Feed Intake
Refusals feeds from each treatment group were collected and weighed every morning before the daily feed allowance was provided for the bulls. Feed intake was determined daily by subtracting the feed left over from the quantity of feed offered to each animal. Grab samples from the three feeds (hay and the molasses inclusion concentrate mix supplements) was taken some time in the middle of each week, and a composite sample one for each feed type were formed for the entire feeding trial for chemical analysis.
VI Live weight
Initial body weight (BW) of each animal was determined by taking mean of two consecutive weights after overnight fasting. All data on weight gain/ change of each fattening bulls were collected every two weeks (fortnightly) up to the end of fattening periods. Daily BW gain was calculated as the difference between the final and initial BW divided by the number of feeding days. The feed conversion efficiency (FCE) was calculated as the proportion of daily DM intake to the daily BW gain.
Live weight of the animals was measured every 14 day afterwards, after overnight fasting. Average daily weight (BW) gain was calculated as the difference between the final and initial BW divided by the number of feeding days. Mean daily body weight change was calculated as; ADG (kg/d) = (Final body weight(Kg)-Initial live weight (Kg))/(No. of feeding days)
VII Feed conversion efficiency
Feed conversion efficiency is used to know how efficient the sheep are converting the feed into meat. It was measured using the formula suggested by Gülten et al. (2000) [8]. Feed conversion efficiency = (Average daily live weight gain (g))/(Average daily feed intake (g))
VIII Chemical analysis
Samples of feed offered, refusals and feces were dried at 55ºC in a forced draft oven for about 72 hours and ground to pass 1 mm mesh screen size. The ground samples were stored in airtight plastic containers pending chemical analysis. Dry matter (DM), ash and crude protein (CP) were analyzed according to AOAC (1990) [9]. Neutral detergent fiber (NDF), acid detergent fiber (ADF), and acid detergent lignin (ADL) were analyzed using the procedures of Van Soest and Robertson (1991) [10]. Hemicellulose (HEM) and cellulose were calculated from the differences between NDF and ADF, and from the ADF and ADL, respectively. Apparent digestibility percentage of DM, CP, Ash, NDF, ADF and ADL was determined using the following formula [11]. Nutrient digestibility = (Nutrient intake-Nutrient excreted in feaces)/(Nutrient intake) *100
IX Carcass parameter evaluation
At the end of the experimental period two fattened bulls were randomly selected from each treatment group and slaughtered at Dubti research center mini slaughterhouse. After the animals were slaughtered and skinned, all important internal organs of each bulls such as kidney, heart, liver, lung, spleen, empty gut, heart fat, kidney fat, mesenteric and omental fat were gutted (dressed) and measured. Dressing percentage was calculated as proportion of hot carcass weight to slaughter and empty body weights. Dressing percentage based on SW = ((Hot carcass weight(Kg))/(Slaughter weight(Kg)))*100
X Partial budget analysis
Samples of feed offered, refusals and feces were dried at 55ºC in a forced draft oven for about 72 hours and ground to pass 1 mm mesh screen size. The ground samples were stored in airtight plastic containers pending chemical analysis. Dry matter (DM), ash and crude protein (CP) were analyzed according to AOAC (1990) [9]. Neutral detergent fiber (NDF), acid detergent fiber (ADF), and acid detergent lignin (ADL) were analyzed using the procedures of Van Soest and Robertson (1991) [10]. Hemicellulose (HEM) and cellulose were calculated from the differences between NDF and ADF, and from the ADF and ADL, respectively. Apparent digestibility percentage of DM, CP, Ash, NDF, ADF and ADL was determined using the following formula [11]. The partial budget analysis was taken to determine cost benefit (profitability) analysis supplementation of different proportions of concentrate mix, molasses and panicum antidotale grasses in feed of Afar bull. The variable costs were calculated from supplementary feed and basal feed costs and medication which are supplied for each experimental bull treatment costs. The partial budget analysis was calculated from the variable costs and benefits. At the end of the experiment, the selling price of each experimental bull was estimated by three experienced local cattle dealers and the average of those three-estimation price was taken. The variable costs were calculated from supplementary feed and basal feed costs which are supplied for each experimental bull treatment costs. The total returns (TR) were determined by calculating the difference between the estimated selling prices and purchasing price of experimental Afar bull. Net return (NR) was calculated as; NR = TR – TVC The change in net return (ΔNR) was calculated as the difference between change in total return (ΔTR) and the change in total variable costs (ΔTVC). ΔNR = ΔTR – ΔTVC
XI Statistical analysis
Data were analyzed using analysis of variance (ANOVA) following the General Linear Model procedure of SAS [12]. Treatment means were separated by least significant difference (LSD). The model used for data analysis was; Yij= μ + Ti + Bj+ eij, Where Yij = response variable, μ = overall mean, Ti = treatment effect, Bj = block effect and eij = random error.
Result and Discussion
I Chemical Composition of Feeds
The chemical composition of the treatment feeds is given in (Table 2). The CP content of hay and molasses used in the current study is low, whereas the CP content of CSC and WB was higher as compared to that in the basal diet and molasses. The NDF content was higher in the basal diet and followed by WB, whereas ADL contents were more in the basal feed and NSC as compared to that in WB.
The CP contents for the present study for cotton seed cake, Wheat bran, and molasses 30.1%, 21% and 3.8% respectively. The CP content of grass hay in the present study was 9.5 g/kg DM which was comparable to the CP content of a good quality grass 10.5 g/kg DM noted by David Hutcheson 2006 [13]. Similarly, Seyoum et al. (2007) reported that, the CP content of improved Panicum antidotal was 9.2 g/kg DM which is similar to the present result [14]. The higher CP content of hay in the present study might be attributed to the improved quality of grass species, the type of the soil which the plant grown and the right stage of maturity at harvest.
The CP content of hay used in this study can satisfy the maintenance required in feeds to support acceptance rumen microbial activity and the maintenance requirement of CP for the host ruminant [15, 11]. However, the high content of cell wall fractions in the hay may imply low feed intake, since a major factor regulating forage intake is NDF content due to its effects on rumen fill, which is directly correlated with rumination or chewing time [16]. The CP content of molasses in this study is 3.8% while carbohydrate content is 12.5% which was similar to the CP content of a good molasses noted by Asfaw (2011) (4 g/kg DM) and 12% carbohydrate content respectively [17]. In this study molasses plays supports microbes in the rumen break down the sugars in molasses rapidly, which extensively causes a rapid release of energy that makes molasses very useful for balancing other feeds in the diet all year round. Feeding molasses to fatten bull were improved intake of pastures/hay; and enhance microbial digestion help maintain body condition and appetite and result in less feed waste.
Table 2: Chemical composition of treatment feed ingredients
|
Chemical Composition |
Feeds |
||||
|
Hay |
Molasses |
CSC |
WB |
Concentrate mix |
|
|
DM (g/kg) |
916 |
724.5 |
957 |
939 |
948 |
|
OM (g/kg DM) |
901 |
812.14 |
901 |
953 |
927 |
|
CP (g/kg DM) |
9.5 |
38.42 |
315 |
201 |
258 |
|
NDF (g/kg DM) |
600 |
- |
382 |
414 |
398 |
|
ADF (g/kg DM) |
402 |
- |
312 |
126 |
219 |
|
ADL (g/kg DM) |
50 |
- |
141 |
33 |
87 |
|
Hemicelluloses (g/kg DM) |
198 |
- |
86 |
306 |
196 |
|
Cellulose (g/kg DM) |
352 |
- |
147 |
133 |
140 |
|
DE (MJ/kg) |
1148 |
12.5 |
871.9 |
351.24 |
611.6 |
CSC: cotton Seed Cake; WB: Wheat bran; DM: dry matter; OM: organic matter; CP: crude protein; NDF: neutral detergent fiber; ADF: acid detergent fiber; ADL: acid detergent lignin; DE: digestible energy.
The chemical composition of wheat bran in the various studies would be vary, the difference could be attributed to differences in the variety of the wheat grain and the type of the soil as well as the method of wheat flour processing employed [11]. For instance, in fine wheat feed, the CP content is generally within the range of 16–21%, and the coarse wheat feed or bran usually contains less CP. The CP content of CSC used in this study was similar to that reported by (Hailemariam T. et al., 2008), (Kuswati et at.,2014) and (Maggioni D, 2010) with values 29.11%, 28.8% and 28.6%, respectively [18-20].
Table 3: Daily dry matters and nutrients intake of Afar Bull feed different level of molasses inclusion on the diet of feeds.
|
Intake (g/d) |
20% Molasses |
15%Molasses |
10%Molasses |
0%Molasses |
SEM |
|
Hay DM intake |
1890.8b |
1648.1a |
1345.2c |
1138.96c |
0.001 |
|
Supp. DM intake |
1250.11a |
1137.10a |
994.24a |
902.5 a |
0.91 |
|
Tot. DM intake |
2348.91b |
2210.64ab |
2130.85c |
1991.46c |
0.02 |
|
Tot. DM intake (% BW) |
38.46 b |
32.59 a |
29.97 a |
28.49a |
0.05 |
|
OM intake |
5346.4a |
5231.8ab |
5101.3ab |
5010.3ab |
1.47 |
|
CP intake |
869.6a |
789.1a |
701.2a |
670.9a |
1.97 |
|
NDF intake |
1648.4b |
1614.9ab |
1549.2a |
1421.1a |
0.54 |
|
ADF intake |
1997.1a |
1920.9ab |
1901.4c |
998.6c |
0.51 |
a,b,cmeans within the same within a row not bearing a common superscript differ significantly (p<0.05); SEM: standard error mean; DM: dry matter; OM: organic matter; CP: crude protein; NDF: neutral detergent fiber; ADF: acid detergent fiber;
II Feed intake
Results of the nutrient intake of cattle fed concentrate mix with molasses are shown in (Table 3). As the result shows the restricted inclusion of molasses in the diet increases hay dry matter intake (HDMI), total dry matter intake (TDMI), organic matter intake, and crude fiber intake, this result in line with Yesihak YM et al., 2014 who stated that, supplementing hay with molasses will increase feed intake and improve palatability [21]. The high DMI of bulls fed Tx1 20% molasses and Tx2 15% molasses diet results high nutrient intake and high gain as first and second respectively. The daily weight gain of bulls fed 20% (Tx1) molasses and 15% (Tx2) molasses was showed better records, this may result in microbes in the rumen break down the sugars in molasses rapidly, which extensively causes a rapid release of energy. Dry matter intake as percentage of body weight in the present study was increased. Total dry matter intake of bull showed increment throughout the experimental period particularly Tx1 and Tx2 in descending order.
III Live Weight Gain and Feed Conversion Efficiency
Mean initial and final live weight, average daily gain (ADG) of the experimental bull on the different treatment feeds are presented in (Table 4). Initial body weight which has a direct effect on the final weights, the result showed that, all the treatments of the initial body weights was similar among the treatments, In the present study, Tx1 (20%) molasses and Tx2 (15%) molasses appear to have better growth performance in descending order. While Tx3 (10%) molasses and Tx4 (0%) molasses were took longer time to attain good body weight gain. This maybe as a result of the optimum quantity balanced ration fed with restricted inclusion of molasses were positively influenced the experimental treatment. Final body weight and total body weight gain was significant (P<0.05) difference among the treatments. Similarly, Feed conversion efficiency (FCR) difference was significantly (P<0.05) observed among the treatments. This study in line with Kuswati et al., 2014 who revealed that, molasses was incorporated into the diet at the rate of about 20 per cent, equivalent to replacing 23 per cent of the maize, with no adverse effect on the performance of cattle in feedlot [19]. The diets containing molasses up to and including 20 percent produced higher body and carcass weight gains than the conventional maize-based diet with no molasses. This confirms the results of the earlier work in which a diet containing 20 per cent molasses produced marginally higher carcass weight gains than the conventional high maize diet [19].
Table 4: Body weight gain of Afar Bull feed different level of molasses inclusion on the diet of Afar bull feeds.
|
BW parameters |
20% Molasses |
15%Molasses |
10%Molasses |
0%Molasses |
SEM |
|
Body weight (kg) |
|
|
|
|
|
|
Initial(kg) |
160.55a |
155.90a |
157.53a |
158.40a |
0.094 |
|
Final(kg) |
271.65a |
255.83b |
243.79c |
239.50c |
0.013 |
|
Total body gain |
111.1a |
99.93ab |
8626c |
810.1c |
0.012 |
|
ADG (g/kg) |
0.692c |
0.641bc |
0.545a |
0.512a |
0.011 |
|
FCR (g DMI/g ADG) |
11.18a |
12.15ac |
14.44b |
15.94b |
0.014 |
A, B, C means within the same row not bearing a common superscript differ significantly (P<0.05); ADG: average daily weight gain; SEM: standard error mean
Dressing percentage of slaughtered bulls in this experiment was in the range of 50.3% and 46.7% (Table 5). The dressing percentage of this trial for (Tx1) 50.3%, (Tx2) 49.3%, (Tx3) 48.9% and (Tx4) was 46.7%. The dressing percentage finding of supplemented of Afar bulls in this study was lower than other indigenous Ethiopian breeds such as Ogaden and Borana bulls where an average dressing percentage of 56% and 61% were reported by Yoseph et al., 2011 and Mieso et al., 2013 [22, 23]. Variation may occur as a result of differences on the genotypes, age of experimental animals. As the result indicated that, no significant difference was noticed on the weights of hot carcass among the four treatment groups statistically. This may be due to similarity of age and breed of the experimental animals. However, there is no difference (P >0.05) among the four treatment groups statistically but still slight differences was observed among the treatments, this differences might be the differences in final live body weights of the experimental bulls.
Table 5: Effects of different level of molasses inclusion on carcass characteristics of Afar bull
|
Item |
20% Molasses (Tx1) |
15%Molasses (Tx2) |
10%Molasses (Tx3) |
0%Molasses (Tx4) |
SEM |
|
Slaughter body weight (kg) |
294.51a |
274.42ab |
254.78c |
246.59c |
0.034 |
|
Hot carcass weight Kg
|
148.14a |
135.37ab |
124.29b |
115.17bc |
0.05 |
|
Dressing percentage |
50.3a |
49.3a |
48.9a |
46.7a |
0.41 |
a, b, c, means with different superscripts in row are significantly different (P<0.05) SEM: standard error mean;
IV Carcass parameters/ measurement
Mean carcass trait of Afar bulls fed improved pasture hay (panicum antidole) with the inclusion of molasses with concentrate mix (2:1ratio) were indicated in (Table 6). Analysis of final body weight, average daily gain, and total weight change and carcass parameters gave advantage to Tx1 and followed by Tx2 as compared to Tx3 and Tx4. Thus, the response of bulls in growth rate and carcass parameters is mainly associated dietary protein intake with restricted molasses inclusion in the diet. In the current study, lung with trachea, Testicles, gallbladder, kidney, kidney fat, liver fat, spleen with pancreases were not different by among the treatments. Blood, liver with bladder, gut fill, empty gut, fore leg and hind leg, visceral fat and total red meat were greater (P<0.01) for Tx1 bulls. As the result exhibited largely, Tx1 bulls were significantly higher (P<0.01) in total edible offal’s.
Table 6: Effects of feeds on carcass characteristics of Afar bulls
|
Carcass parameters/traits |
Units |
Tx1 |
Tx2 |
Tx3 |
Tx4 |
|
weight of blood |
Kg |
7.5 |
5 |
4 |
3.9 |
|
lungs with trachea |
Kg |
5 |
4.0 |
3.75 |
3.60 |
|
liver with bladder |
Kg |
4.9 |
3.2 |
3.2 |
3.1 |
|
spleen with pancreas |
Kg |
0.75 |
0.74 |
0.5 |
0.5 |
|
Gut fill |
Kg |
96 |
68 |
66 |
65 |
|
Empty gut |
Kg |
16 |
11 |
10 |
9.5 |
|
Fat omental |
Kg |
3.4 |
3.1 |
2.0 |
2.0 |
|
Kidney |
Kg |
0.81 |
0.80 |
0.59 |
059 |
|
Bone |
Kg |
39 |
38.5 |
35.5 |
35.0 |
|
Head |
Kg |
22 |
21.5 |
18 |
18 |
|
skin |
Kg |
29 |
29 |
27 |
26 |
|
Testis and penis |
Kg |
0.75 |
0.75 |
0.75 |
0.75 |
|
Hind leg 1 |
Kg |
24 |
16 |
13 |
12.5 |
|
Hind leg 2 |
Kg |
22 |
16.5 |
13 |
13 |
|
Fore leg 1 |
Kg |
19 |
13 |
11 |
10 |
|
Fore leg 2 |
Kg |
17 |
12 |
12.5 |
12 |
|
Heart |
Kg |
1.5 |
1.5 |
0.9 |
0.9 |
|
Testicle |
Kg |
0.7 |
0.5 |
0.5 |
0.5 |
|
Gall bladder |
Kg |
0.47 |
0.47 |
0.47 |
0.47 |
|
kidney fat |
Kg |
1 |
1 |
1 |
1 |
|
liver fat |
Kg |
0.2 |
0.2 |
0.2 |
0.2 |
|
Total read meat |
Kg |
132 |
117 |
98 |
97.7 |
Table 7: Partial budget analysis of treatment diets
|
Parameters Treatments |
|
|
Purchase price of bull (ETB/head) |
T1 (20%) T2 (15%) T3 (10%) T4 (0%) |
|
5000 4900 5000 4950 |
|
|
Panicum hay ( ad libitum) |
1244 1244 1244 1244 |
|
Cane molasses consumed (kg/head) |
36 27 18 - |
|
Total supplement consumed (kg/head) |
162 162 162 162 |
|
Total feed consumed (kg/head) |
1406 1406 1406 1406 |
|
Cost of Panicum hay grass (ETB/head) |
1492.8 1492.8 1492.8 1492.8 |
|
Cost for molasses (ETB/head) |
25.2 18.9 12.6 - |
|
Cost of supplemented feed (ETB/head) |
810 810 810 810 |
|
Cost of medication (ETB/head) |
15 15 15 15 |
|
Total variable cost (ETB/head) (TVC) |
2343 2336.7 2330.8 2317.8 |
|
Gross income (R) (ETB/head) |
11450 10610 9720 9100 |
|
Change in net income (ETB/head) |
4107 3373 2389 1833 |
V Partial budget analysis
In computing the partial budget analysis includes all variable costs, change in net income and change in net profit. In this study feed, medication and animal cost were considered as variable costs whereas the sale of sheep also used as an income source. The partial budget analysis of Afar bull fed on different level of molasses inclusion in the diet with concentrates mix presented (Table 7). The partial budget analysis was made to evaluate the economic advantages of different level of molasses inclusions in the diet. The result of this study indicated that higher net income (4107ETB/bull) was obtained from the bull supplemented with (Tx1) 20% inclusions of molasses treatments; followed by Tx2 (15%), T3 (10%), T4 (0%), in decreasing order respectively. As the result indicated that, there was no loss of Birr/Bull in all treatments. Based on this study the net profit income, Tx1 (20%) inclusions of molasses treatments counterweights other treatments and is endorsed as best. However, all different level of inclusion of molasses used in this study persuaded positive net profit and income. For small scale agro pastorals that pampered with capital shortage and possess better access and use of molasses, promoting cattle fattening using the defined feed technology believed to play significant role in optimizing economic benefits for small scale agro pastorals.
Conclusion and Recommendation
Based on the result of our study, we concluded that in the diet with 20% molasses limit obtained the best result in nutrient immersion, weight gain, carcass yield, average daily gain and Nitrogen balance. If it exceeds at higher levels, its feeding value could be expected to decline. As the result revealed that, Afar bull can be fed molasses in the diets which were best up to 20% of molasses inclusion where it a chef preferable weight without adverse effect and a remarkable change in nutrient immersion and nitrogen balance. Hence molasses improves feed intake, weight gain; nitrogen balance, carcass yield, average daily weight gain and it enhance mechanical digestion of fiber.
Therefore, benefits of feeding molasses in this study concluded that, there is no doubt that molasses is an excellent source of energy and minerals for large ruminants (Afar bull finishing). The overall results of the present study revealed that bull fed 20% molasses inclusion as energy supplement were performed better than bull fed lower than 20% molasses inclusion as feed supplements. Moreover, it is very useful for large ruminant producers that could feel confident feeding molasses, a safe and economical supplement and it has an advantage of high digestible energy.
Article Info
Article Type
Research ArticlePublication history
Received: Wed 08, May 2019Accepted: Tue 09, Jul 2019
Published: Sat 20, Jul 2019
Copyright
© 2023 Anwar Seid. This is an open-access article distributed under the terms of the Creative Commons Attribution License, which permits unrestricted use, distribution, and reproduction in any medium, provided the original author and source are credited. Hosting by Science Repository.DOI: 10.31487/j.JFNM.2019.02.03
Author Info
Corresponding Author
Anwar SeidAfar Pastoral and Agro Pastoral Research Institute, Department of livestock research directorate, P.O. Box 16, Samara, Ethiopia
Figures & Tables
Table 1: Treatment arrangement
|
Ratio of Concentrate mix |
Treatments |
|
||
|
1CSC:2 WB |
Tx1 (20% molasses) |
Tx2 (15% molasses) |
Tx3 (10% molasses) |
Tx4 (0% molasses) |
|
|
3 |
3 |
3 |
3 |
CSC: Cotton seed cake; WB: Wheat bran
Table 2: Chemical composition of treatment feed ingredients
|
Chemical Composition |
Feeds |
||||
|
Hay |
Molasses |
CSC |
WB |
Concentrate mix |
|
|
DM (g/kg) |
916 |
724.5 |
957 |
939 |
948 |
|
OM (g/kg DM) |
901 |
812.14 |
901 |
953 |
927 |
|
CP (g/kg DM) |
9.5 |
38.42 |
315 |
201 |
258 |
|
NDF (g/kg DM) |
600 |
- |
382 |
414 |
398 |
|
ADF (g/kg DM) |
402 |
- |
312 |
126 |
219 |
|
ADL (g/kg DM) |
50 |
- |
141 |
33 |
87 |
|
Hemicelluloses (g/kg DM) |
198 |
- |
86 |
306 |
196 |
|
Cellulose (g/kg DM) |
352 |
- |
147 |
133 |
140 |
|
DE (MJ/kg) |
1148 |
12.5 |
871.9 |
351.24 |
611.6 |
CSC: cotton Seed Cake; WB: Wheat bran; DM: dry matter; OM: organic matter; CP: crude protein; NDF: neutral detergent fiber; ADF: acid detergent fiber; ADL: acid detergent lignin; DE: digestible energy.
Table 3: Daily dry matters and nutrients intake of Afar Bull feed different level of molasses inclusion on the diet of feeds.
|
Intake (g/d) |
20% Molasses |
15%Molasses |
10%Molasses |
0%Molasses |
SEM |
|
Hay DM intake |
1890.8b |
1648.1a |
1345.2c |
1138.96c |
0.001 |
|
Supp. DM intake |
1250.11a |
1137.10a |
994.24a |
902.5 a |
0.91 |
|
Tot. DM intake |
2348.91b |
2210.64ab |
2130.85c |
1991.46c |
0.02 |
|
Tot. DM intake (% BW) |
38.46 b |
32.59 a |
29.97 a |
28.49a |
0.05 |
|
OM intake |
5346.4a |
5231.8ab |
5101.3ab |
5010.3ab |
1.47 |
|
CP intake |
869.6a |
789.1a |
701.2a |
670.9a |
1.97 |
|
NDF intake |
1648.4b |
1614.9ab |
1549.2a |
1421.1a |
0.54 |
|
ADF intake |
1997.1a |
1920.9ab |
1901.4c |
998.6c |
0.51 |
a,b,cmeans within the same within a row not bearing a common superscript differ significantly (p<0.05); SEM: standard error mean; DM: dry matter; OM: organic matter; CP: crude protein; NDF: neutral detergent fiber; ADF: acid detergent fiber;
Table 4: Body weight gain of Afar Bull feed different level of molasses inclusion on the diet of Afar bull feeds.
|
BW parameters |
20% Molasses |
15%Molasses |
10%Molasses |
0%Molasses |
SEM |
|
Body weight (kg) |
|
|
|
|
|
|
Initial(kg) |
160.55a |
155.90a |
157.53a |
158.40a |
0.094 |
|
Final(kg) |
271.65a |
255.83b |
243.79c |
239.50c |
0.013 |
|
Total body gain |
111.1a |
99.93ab |
8626c |
810.1c |
0.012 |
|
ADG (g/kg) |
0.692c |
0.641bc |
0.545a |
0.512a |
0.011 |
|
FCR (g DMI/g ADG) |
11.18a |
12.15ac |
14.44b |
15.94b |
0.014 |
A, B, C means within the same row not bearing a common superscript differ significantly (P<0.05); ADG: average daily weight gain; SEM: standard error mean
Table 5: Effects of different level of molasses inclusion on carcass characteristics of Afar bull
|
Item |
20% Molasses (Tx1) |
15%Molasses (Tx2) |
10%Molasses (Tx3) |
0%Molasses (Tx4) |
SEM |
|
Slaughter body weight (kg) |
294.51a |
274.42ab |
254.78c |
246.59c |
0.034 |
|
Hot carcass weight Kg
|
148.14a |
135.37ab |
124.29b |
115.17bc |
0.05 |
|
Dressing percentage |
50.3a |
49.3a |
48.9a |
46.7a |
0.41 |
a, b, c, means with different superscripts in row are significantly different (P<0.05) SEM: standard error mean;
Table 6: Effects of feeds on carcass characteristics of Afar bulls
|
Carcass parameters/traits |
Units |
Tx1 |
Tx2 |
Tx3 |
Tx4 |
|
weight of blood |
Kg |
7.5 |
5 |
4 |
3.9 |
|
lungs with trachea |
Kg |
5 |
4.0 |
3.75 |
3.60 |
|
liver with bladder |
Kg |
4.9 |
3.2 |
3.2 |
3.1 |
|
spleen with pancreas |
Kg |
0.75 |
0.74 |
0.5 |
0.5 |
|
Gut fill |
Kg |
96 |
68 |
66 |
65 |
|
Empty gut |
Kg |
16 |
11 |
10 |
9.5 |
|
Fat omental |
Kg |
3.4 |
3.1 |
2.0 |
2.0 |
|
Kidney |
Kg |
0.81 |
0.80 |
0.59 |
059 |
|
Bone |
Kg |
39 |
38.5 |
35.5 |
35.0 |
|
Head |
Kg |
22 |
21.5 |
18 |
18 |
|
skin |
Kg |
29 |
29 |
27 |
26 |
|
Testis and penis |
Kg |
0.75 |
0.75 |
0.75 |
0.75 |
|
Hind leg 1 |
Kg |
24 |
16 |
13 |
12.5 |
|
Hind leg 2 |
Kg |
22 |
16.5 |
13 |
13 |
|
Fore leg 1 |
Kg |
19 |
13 |
11 |
10 |
|
Fore leg 2 |
Kg |
17 |
12 |
12.5 |
12 |
|
Heart |
Kg |
1.5 |
1.5 |
0.9 |
0.9 |
|
Testicle |
Kg |
0.7 |
0.5 |
0.5 |
0.5 |
|
Gall bladder |
Kg |
0.47 |
0.47 |
0.47 |
0.47 |
|
kidney fat |
Kg |
1 |
1 |
1 |
1 |
|
liver fat |
Kg |
0.2 |
0.2 |
0.2 |
0.2 |
|
Total read meat |
Kg |
132 |
117 |
98 |
97.7 |
Table 7: Partial budget analysis of treatment diets
|
Parameters Treatments |
|
|
Purchase price of bull (ETB/head) |
T1 (20%) T2 (15%) T3 (10%) T4 (0%) |
|
5000 4900 5000 4950 |
|
|
Panicum hay ( ad libitum) |
1244 1244 1244 1244 |
|
Cane molasses consumed (kg/head) |
36 27 18 - |
|
Total supplement consumed (kg/head) |
162 162 162 162 |
|
Total feed consumed (kg/head) |
1406 1406 1406 1406 |
|
Cost of Panicum hay grass (ETB/head) |
1492.8 1492.8 1492.8 1492.8 |
|
Cost for molasses (ETB/head) |
25.2 18.9 12.6 - |
|
Cost of supplemented feed (ETB/head) |
810 810 810 810 |
|
Cost of medication (ETB/head) |
15 15 15 15 |
|
Total variable cost (ETB/head) (TVC) |
2343 2336.7 2330.8 2317.8 |
|
Gross income (R) (ETB/head) |
11450 10610 9720 9100 |
|
Change in net income (ETB/head) |
4107 3373 2389 1833 |
References
- CSA (2013) Agricultural Sample Survey, 2012/13 (2005 EC), Volume II: Report on Livestock and livestock characteristics (Private peasant holdings).
- Solomon A, Workalemahu A, Jabbar MA, Ahmed MM, Hurissa B (2003) Livestock marketing in Ethiopia: A review of structure, performance and development initiatives. Socioeconomics and Policy Research Working Paper 52. Kenya. Int Livestock Res Inst (ILRI).
- Tilahun H, Schmidt E (2012) Spatial Analysis of Livestock Production Patterns in Ethiopia. Int Food Policy Res Inst.
- Metaferia F, Cherenet T, Gelan A, Abnet F, Tesfay A et al. (2011) A Review to Improve Estimation of Livestock Contribution to the National GDP. Ministry of Finance and Economic Development and Ministry of Agriculture.
- Joanne P, Asnake A, Kassaye H (2005) Livelihood emergency assessment in Afar region. OXFAM Int 44.
- Mengistu A (2003) Country Pasture/Forage Resource Profiles.
- Jokthan GE (2003) Effect of different energy sources on intake and weight gain of white Fullani cattle. Nat Open Univer.
- Gülten K, Rad F, Kindir M (2000) Growth performance and feed conversion efficiency of Siberian Sturgeon juveniles (Acipenser baeri) reared in concentrate ways. Turkey J Veterin Animal Sci 24: 435-442.
- AOAC (1990) Official Methods of Analysis, 15th ed. Association Official Analytical Chemists 1298.
- Van Soest PJ, Robertson JB (1991) Analysis of forages and fibrous feeds. A Laboratory Manual for Animal Science 613.
- McDonald P, Edwards RA, Greenhalgh JFD, Morgan CA (2002) Animal Nutrition 6th Edition. Pearson Educational Limited. Edinburgh Great Britain 255-657.
- SAS (2002) Guide to personal computers, version 9. Statistical analys syst inst Inc.
- David Hutcheson (2006) Feeding to Produce Export Quality Ethiopian Beef: Requirements and Recommendations. Ethiopia Sanitary & Phytosanitary Standards and Livestock & Meat Marketing Program (SPS-LMM). Texas Agricultural Experiment Station/Texas A&M University System. Animal Agricultural Consult Inc.
- Bediye S, Sileshi Z, Fekadu D (2007) Chemical composition and nutritive values of Ethiopian feeds. Research Report 73. Ethiopia Inst Agricul res (EIAR).
- Van Soest PJ (1994) Nutritional Ecology of the Ruminant. 2nd ed. Cornell University Press, London.
- Behnke R (2010) Contribution of Livestock to the Economies of IGAD Member States: Study Findings, Application of the Methodology in Ethiopia and Recommendations for Further Work.
- Asfaw N, Rashid S, Berhanu G (2011) Livestock Production and Marketing, Development Strategy and Governance Division, International Food Policy Research Institute Ethiopia Strategy Support Program II, Ethiopia.
- Hailemariam T, Getachew L, Dawit A, Asfaw N (2008) Live animal and meat export value chains for selected areas in Ethiopia: Constraints and opportunities for enhancing meat exports. Int Livestock Res Inst (ILRI).
- Kuswati Kusmartono, Susilawati T, Rosyidi D, Agus A (2014) Carcass Characteristics of Brahman Crossbred Cattle in Indonesian Feedlot. IOSR J Agric Vet Sci 7: 19-2.
- Maggioni D, Marques JA, Rotta PP, Perroto D (2010) Animal Performance and Meat Quality of Crossbred Young Bull. Meat Sci 127: 176-172.
- Yesihak YM, Webb EC (2014) Ethiopian beef carcass characteristics. African J Agric Res 9: 3766-3775.
- Yoseph M, Mengistu U, Mohammed YK, Merga B (2011) Effect of strategic supplementation with different proportion of agro-industrial by-products and grass hay on body weight change and carcass characteristics of tropical Ogaden bulls (Bos indicus) grazing native pasture. African J Agric Res 6: 825-833.
- Mieso G, Girma D, Tesfaye AT, Frihiwot M, Tesfaye AA (2013) Evaluation of different feeding options on yearling Borana bulls to attain export market weight at Adami Tulu agricultural research center. Am J Cell Anim Biol 1: 1-9.