Journals
Drying and Properties of Solid Residue from Guava (Psidium guajava) Pulp Processing
A B S T R A C T
The solid residue from pulp production of guava (Psidium guajava) represents around 30% of the raw material. The drying of this residue on drier’ trays at 45, 50, 55, 60, 65 and 70 °C was investigated. After drying, the material was ground in one of two types of mills: a knife or a hammer mill. Guava flour samples were characterized according to their water absorption capacity (WAC), oil holding capacity (OHC), emulsifying and foaming properties, lycopene, total carotenoids and phenolic compounds. The drying curves show typical behaviour and five mathematical models (two-term exponential, Henderson and Pabis, diffusion approximation, Page and logarithmic) were constructed. Of the models tested for the temperatures applied in the experiment, only the Henderson and Pabis model, when adjusted to the experimental data obtained at temperatures of 45 to 50 °C did not represent the drying kinetics of the guava processing solid residue, with coefficients of determination of 0.9376 and 0.6905, respectively. The type of mill and the drying temperature influenced the phenolic compounds, lycopene and total carotenoids. The WAC was higher than the OHC for all drying temperatures, due to the high content of dietary fiber in this residue.
Keywords
Guava, pulp, solid residue, drying
Introduction
In recent decades a large number of papers have demonstrated the importance of the consumption of fruit, due to the presence of functional compounds. However, a portion of industrialized fruit is discarded as solid residue, providing an excellent opportunity for the evaluation of processing residues. The seeds, peel and fruits with low added value for fresh consumption can represent approximately 50 % of the processed fruit and these can be transformed in new products. This potential use is dependent on the characterization of the material properties [1]. Of the great variety of fruits appreciated and exploited worldwide, guava (P sidium guajava) is one of the most complete and balanced due to its nutritional value, low-calorie content and high fiber, bioactive compounds and vitamin C contents [2, 3]. India, China, Thailand, Pakistan and Mexico are the world’s largest guava producers [4].
In guava fruit and its derivatives bioactive compounds such as tannins, flavonoids, essential oils and sesquiterpenoids can be found [2, 3, 5]. In the processing of guava for the production of sweets and pulps, the fruit pulp removal and refining are the main point of the generation of solid residue, which is made up of peels, seeds and residual pulp. In processing to produce pulp the residue constitutes 30% by weight and the seeds represent approximately 6% of this residue. Many studies have been carried out to determine the composition of the residue produced during the industrial processing of guava for application in various sectors [1, 2, 6]. Guava solid residues contain approximately 90.81% of moisture, in a dry basis, around 75% of total carbohydrates, 10% of crude protein, 11.71% of ether extract and 1.25% of ash. Fiber represents the principal component of guava processing solid residue [7].
There are few industrial food plants that carry out processing applying the concept of cleaner production, considering the whole fruit as raw material, looking for further applications for components which are generally considered as residues. This approach leads to the generation of a questionable residue from the microbiological aspect, due to the high moisture content and the low valorization of the 10% of total solids present in this residue. There are several articles focused on the properties of guava processing solid residues and effect of the drying on guava [2, 5, 8]. However, there appears to be no reports available on the characteristics of the flour obtained from this solid residue as raw material. Therefore, the aim of this work was to study the kinetic of the drying at several temperatures and to evaluate the characteristics of flour obtained from a guava pulping residue after drying and grinding using knife mill and hammer mill.
Materials and Methods
The solid residues investigated in this study were obtained from the guava pulp production process carried out by companies located in the city of Petrolina (latitude 09o23'55" S and longitude 40°30'03" W, altitude 376 m above sea level), Pernambuco State, Brazil. After the collection of the solid residues from the guava pulp production machines they were homogenized, packed in polyethylene bags, in portions of approximately 100 g and then frozen at a temperature of -18 ± 1 °C until the experiments were carried out.
The preparation of the drying curves, after determining the moisture content using the gravimetric method, was carried out in an oven with forced air circulation (New Ethics, model400/A, São Paulo, Brazil), set at six different temperatures (45, 50, 55, 60, 65 and 70 °C). The drying curves were constructed in triplicate using data on the point of evaluation (time) and temperature, with masses between 2.0000 and 3.0000 g placed in glass weighing crucibles and kept in an oven with forced air for periods of 10 min. After this time the crucibles were removed and weighed on an analytical balance on a plate protected by a circle of cork. After weighing, the crucibles were returned to the oven for another 10 min and this procedure was performed until the change in weight was less than 1.0 mg for successive weightings, or until the sample reached the equilibrium moisture content. Drying curves for randomized experiments were constructed for the six temperatures studied.
The samples dehydrated at the different temperatures were used to obtain flour by grinding in an IKA® hammer mill (A-11model) and Cadence® knife mill (model MDR301). The dry milled material, called flour, was packed in polyethylene bags which were stored in plastic pots, wrapped in aluminum foil together with a silica gel sachet. For the fitting of the mathematical model to the experimental drying data, a nonlinear regression analysis was performed applying the Gauss-Newton method, using the computational program STATISTICA 7.0®. The values for of the model parameters were estimated as a function of the independent variable time (in min) and the dependent variable relative humidity (RH).
To assess the quality of the fit of different mathematical models with the experimental data the coefficient of determination (R2) and the mean square deviation (MSD) were used as criteria for setting the analysis, as described in Equation1.
Where: RX pred = Moisture content predicted by the model; RX exp = experimentally determined moisture content.
Flours obtained at different drying temperatures and ground in a knife and hammer mill were characterized by scanning electron microscopy (SEM). The samples were fixed with double-sided tape, on aluminum supports, metallized with a gold layer of 350 Å thick, with a metallizer model D2 Diode Sputtering System manufactured by ISI (International Scientific Instruments) and then submitted to analysis in the SEM (JEOL JSM-6390LV). The oil holding capacity (OHC) of the guava solid residue flour was evaluated according to the methodology proposed by Lin et al. with modifications [9]. A sample (0.5 g) of the flour residues was added to 3 mL of cooking corn oil in a pre-weighed Falcon tube. The contents were stirred for 1 min and allowed to stand for 30 min. After this time, they were centrifuged at 2000 x g (Hermle Z 200A, Labortechnik, Berlin, Germany) for 25min and the free oil was discarded. The tube with the residue was weighed and the oil retained after centrifugation was expressed as a percentage.
The water absorption capacity (WAC) of the flours was determined according to the Glória and Regitano-D’arce method, where 5mL of distilled water and 1.0000 g of sample was placed in a previously weighed centrifuge tube [10]. The dispersion was stirred for 1 min on a vortex (Biomixer® QL-901, Brazil) and allowed to stand for 30 min. The supernatant was discarded and the tube with the residue was weighed. The water retained after spinning was considered as absorbed water, and the result was expressed relative to the amount of water absorbed (g water) per gram sample. The foaming properties were evaluated according to Siddiq et al. with modifications [11]. A sample (0.5000 g) of guava residue flour was dispersed in 50 mL of Mc Ilvaine buffer solutions (disodium phosphate –citric acid) with pH 2.5, 5.6 and 8.0. The dispersion was vigorously stirred in a blender (Walita® LiqFaz, Brazil) for 5 min and then transferred to a 50 mL graduated cylinder. The volume of foam formed was recorded as the foaming capacity (mL/100 mL).
The emulsifying properties of the guava residue flour were determined according to Kaur and Singh [12]. Samples (0.3500 g) of flour were homogenized for 30 sec with 5 mL of distilled water in a Vortex (Biomixer®). Corn oil (2.5 mL) was added and the mixture was homogenized again for 30 sec. Another 2.5 mL of corn oil was then added and the mixture was homogenized for a further 90 sec. The material was centrifuged at 500 x g for 5 min. The emulsifying activity was calculated by dividing the volume of the emulsified layer by the total volume before centrifugation. The stability of the emulsion was determined following the same procedure used to determine the emulsifying activity. However, before the centrifugation the samples were subjected to thermal treatment at 85 °C for 15 min. The emulsion stability was determined as the percent of emulsifying activity after the heating.
The samples obtained were evaluated for the content of total carotenoids and lycopene by the spectrophotometric method, according to Rodriguez-Amaya [13]. To determine the total phenolic content of the flours in the dehydrated residue from the guava processing, hydroalcoholic extracts (methanol: water) were obtained according to Bloor [14]. The content of total phenolics (µg gallic acid g-1) was estimated using the Folin-Ciocalteu reagent [15]. All assays were carried out at least in triplicate. Data were presented as the average and the standard deviation. Averages were compared applying analysis of variance (ANOVA) and mean separations Tukey’s multiple range test (P ≤ 0.05).
Results and Discussion
Guava pulp processing residue was dried at six different temperatures and the drying profile was obtained. Table 1 show the values for the equation parameters of the mathematical models tested: diffusion approximation, two-term exponential, Handerson and Pabis, logarithmic and Page, respectively, which were fitted to the experimental values for the drying kinetics of the guava solid residue. The diffusion approximation model provided the best fit with the data for the drying of the solid residue at a temperature of 60 °C, since at this temperature the coefficient of determination (R2= 0.9995) was closest to 1. The mean square deviation (MSD) (0.008) also corroborates the finding that the diffusion approximation model gave the best fit with the data for drying at 60o C (Table 1).
Table 1: Parameters of the models: diffusion approximation, two term exponential, Henderson and Pabis, logarithmic and Page, coefficient of determination (R2) and mean square deviation (MSD) for the drying of guava pulp processing residue at 45, 50, 55, 60, 65 and 70 °C.
|
Diffusion aproximation |
|||||
|
|
a |
k |
B |
R2 (decimal) |
MSD |
|
45 |
0.00315 |
0.107893 |
0.134411 |
0.9991 |
0.011 |
|
50 |
-0.02322 |
1.119691 |
0.012708 |
0.9955 |
0.026 |
|
55 |
0.00272 |
0.248668 |
0.060365 |
0.9979 |
0.018 |
|
60 |
0.08126 |
0.245399 |
0.061820 |
0.9995 |
0.008 |
|
65 |
-130.875 |
0.023288 |
0.997606 |
0.9913 |
0.011 |
|
70 |
-0.00492 |
0.768696 |
0.025576 |
0.9914 |
0.011 |
Two-term exponential
|
|
a |
K |
R2 (decimal) |
MSD |
|
45 |
1.0000 |
0.014545 |
0.9991 |
0.011 |
|
50 |
0.0048 |
2.872565 |
0.9952 |
0.027 |
|
55 |
0.0077 |
1.927482 |
0.9979 |
0.018 |
|
60 |
0.0835 |
0.181095 |
0.9949 |
0.008 |
|
65 |
0.0052 |
3.356372 |
0.9986 |
0.014 |
|
70 |
0.0034 |
5.672267 |
0.9969 |
0.023 |
Henderson and Pabis
|
|
a |
K |
R2 |
MSD |
|
45 |
0.10928 |
-2.36567 |
0.9376 |
0.093 |
|
50 |
0.17277 |
-45.1983 |
0.6905 |
0.298 |
|
55 |
0.99855 |
0.015029 |
0.9985 |
0.018 |
|
60 |
0.95865 |
0.015777 |
0.9987 |
0.013 |
|
65 |
1.00798 |
0.017625 |
0.9987 |
0.014 |
|
70 |
1.02696 |
0.01999 |
0.9974 |
0.021 |
Logarithmic
|
|
a |
k |
c |
R2 (decimal) |
MSD |
|
45 |
1.006174 |
0.0138 |
-0.015438 |
0.9995 |
0.008 |
|
50 |
1.017238 |
0.0136 |
-0.011265 |
0.9953 |
0.026 |
|
55 |
1.001110 |
0.0137 |
-0.028462 |
0.9990 |
0.012 |
|
60 |
0.960831 |
0.0154 |
-0.006084 |
0.9988 |
0.013 |
|
65 |
1.015021 |
0.0166 |
-0.017076 |
0.9993 |
0.010 |
|
70 |
1.056659 |
0.0175 |
-0.048354 |
0.9987 |
0.015 |
Page
|
|
n |
k |
R2 |
MSD |
|
45 |
1.010566 |
0.013873 |
0.9917 |
0.010 |
|
50 |
1.013976 |
0.01306 |
0.9953 |
0.026 |
|
55 |
1.027929 |
0.013288 |
0.9980 |
0.017 |
|
60 |
0.918992 |
0.023463 |
0.9978 |
0.017 |
|
65 |
1.052065 |
0.013980 |
0.9990 |
0.012 |
|
70 |
1.082752 |
0.013831 |
0.9979 |
0.019 |
The two-term exponential model provided the best fit with the data for drying at 45 °C, since for this temperature the coefficient of determination (R2=0.9991) was closest to 1. The MSD (0.011), although higher than the result obtained for the drying temperature of 60 oC, is the second lowest for the samples evaluated, which corroborates the finding that the two-term exponential model gives the best fit with the data for drying at 45 oC. The Henderson and Pabis model provided the best fit with the data for the drying of the solid residue at 60 oC, since at this temperature the coefficient of determination (R2= 0.9987) was closest to 1, and the MSD (0.013) also corroborated this finding (Table 1).
Previous studies on a model for the drying kinetics of guava processing residue could not be found in the literature. The logarithmic model as well as the two-term exponential model provided a good fit for data obtained for the guava residue drying at 45 °C, with R2= 0.9995 and an MSD value of 0.008 (Table 1). With regard to the Page Model (Table 1), the highest value for the determination coefficient (R2= 0.9990) was obtained for the drying temperature of 65 ºC, although the MSD value for this temperature was slightly higher than that obtained for the drying temperature of 45 oC, suggesting that the Page model best fits the data related to drying at 65 °C.
Therefore, for temperatures applied in the experiment, of the models tested, only the Henderson and Pabis model fitted to the experimental data obtained at temperatures of 45 to 50 °C (with coefficients of determination of 0.9376 and 0.6905, respectively) did not represent the drying of the guava processing residue. However, all of the other models tested, for which the determination coefficients were > 0.99 and the mean square deviations were < 0.02, can be used to predict the drying kinetics of the solid residue produced during guava pulping, for the drying temperatures studied in this experiment. In relation to the best fit, the highest values for the determination coefficient (R2 = 0.9995) were obtained for the drying temperatures of 60 oC and 45 oC applying the diffusion approximation model and logarithmic models, respectively, the MSD being 0.008 for both models.
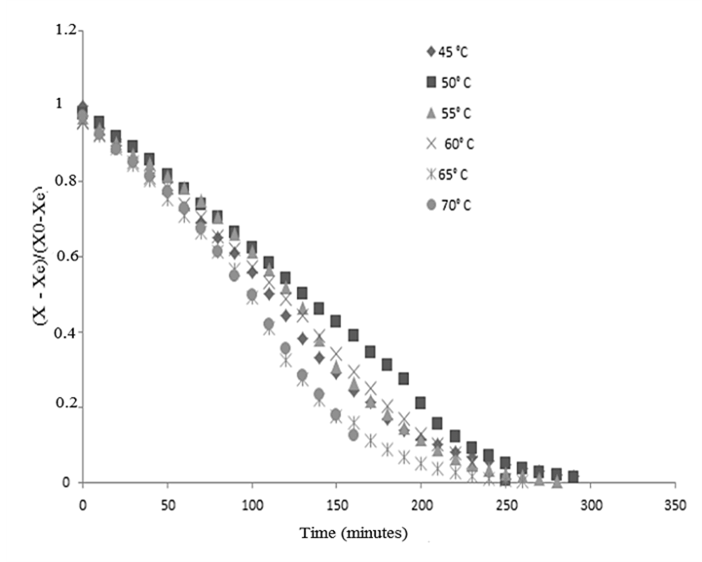
Figure 1: Kinetics of the drying of guava processing residues at six temperatures.
The data points for the drying of the guava solid residue at temperatures of 45, 50, 60, 65 and 70 °C, expressed by dimensionless moisture content, on a dry basis (db), are shown (Figure 1) as a function of the drying time in min. The behaviour of the drying curves does not present a period of constant drying for the conditions tested, despite the high initial moisture content of this residue (1.5304 db). In a general sense, the behaviour of the guava solid residue was the same as that of other agricultural products [16, 17]. For lower drying temperatures (45 and 50 oC), the stabilization of the moisture ratio occurred after 250 min and for a temperature of 70 oC (the highest temperature studied in our experiments), the stabilization occurred after 160 min. The drying at 55 oC provided a dried product with the lowest moisture ratio (0.0038), but with a stabilization time of 280 min. In order to find an equation for the drying curves obtained for the guava processing residue fitting was carried out using polynomial equations (Table 2). All of these equations can be used to fit the drying curve model for the guava solid residue since they present R2 values higher than 95 %. But because they are empirical, these equations can be used to predict drying data for the same temperatures and conditions investigated in our study.
Table 2: Equations for the kinetics of the guava solid residue drying at six temperatures.
|
Temperature (°C) |
Equation |
R2 ( %) |
|
45 |
y = 5.0 x 10-6x2 – 0.0064x + 1.5958 |
0.9931 |
|
50 |
y = 1.0x10-6x2 – 0.0056x + 1.5878 |
0.9947 |
|
55 |
y = 7.0x10-6x2 – 0.008x + 1.6533 |
0.9791 |
|
60 |
y = -1.0x 10-6x2 – 0.0054x + 1.5576 |
0.9978 |
|
65 |
y = 1.0x10-5x2 – 0.0098x + 1.6605 |
0.9818 |
|
70 |
y = -2.0x10-5x2 – 0.0054x + 1.5535 |
0.9961 |
The oil holding capacity (OHC) and water-absorption capacity (WAC) are important properties of flour. In this regard, the effect of the kind of mill and the drying temperature were evaluated (Table 3). At general stand point there was a statistical difference (p≥0.05) between the OHC values for samples ground in a knife mill and dried at 50 and 70 oC, but does not a statistical difference between 45, 55, 60 and 65 oC. In this case, does not increase the OHC with the temperature to the knife mill. In the case of the samples ground in a hammer mill, the difference between the data obtained at 60 and 70 oC was significant. There was a general increase in the OHC with the temperature. Thus, the type of fracture can determine the characteristics of the particles. Although the solid residue studied had a crude protein content of around 10 %, no studies on the OHC of this material could be found in the literature. However, in one study of Fontanari et al., a guava seed protein isolate produced at pH values of 10.00 and 11.5, reached 1.75 and 2.25 mL of oil g-1 of protein [18].
Table 3: Oil holding capacity (OHC) (g of oil/g of flour) and water absorption capacity (WAC) (g of water/g of flour) of guava processing residue flour samples produced at different temperatures, ground in a knife or hammer mill.
|
Temperature (oC) |
Knife mill(1) |
|
|
Hammer Mill (1) |
|
|
OHC |
WAC |
|
OHC |
WAC |
|
|
45 |
1.020±0.040ab |
2.253±0.011ce |
|
0.897±0.031ab |
2.457±0.102a |
|
50 |
0.933±0.036b |
1.947±0.024fe |
|
1.020±0.033ab |
2.400±0.053ªb |
|
55 |
0.947±0.018ab |
2.200±0.013dbe |
|
1.007±0.044ab |
2.163±0.082ab |
|
60 |
0.957±0.004ab |
2.073±0.016e |
|
1.213±0.071a |
2.313±0.204ab |
|
65 |
1.007±0.049ab |
2.277±0.096b |
|
1.020±0.127ab |
2.000±0.067b |
|
70 |
1.053±0.016a |
2.437±0.031a |
|
0.950±0.040b |
2.360±0.127ab |
1Average of triplicate analyses ± standard deviation.
Averages followed by the same letters in the same row do not different according to the Tukey test at a 5 % probability.
The water absorption capacity is higher than the oil holding capacity for samples ground using the two milling techniques and also for all drying temperatures applied. This result is related to the fiber content of the residue, as well as the presence of lipids and carotenes, since these components do not have hydrophobic characteristics but instead have hydrophilic canals where water can be bound in this material. On the other hand, the variation in the water absorption capacity was greater for the flour samples obtained in the knife mill compared with those obtained in the hammer mill. This characteristic also varied at a low degree according to the drying temperature, the WAC values for samples produced at 60, 65 and 70 oC being statistically different and also those dried at 45, 50 and 55 oC showed statistically different values (p≥0.05).
The results for WAC obtained in this study, considering all treatments, drying temperatures and milling methods, are higher than those registered for guava seed protein isolate produced at pH 10 and 11 by Fontanari et al., who reported levels of 1.0 to 1.75 mL of water g-1 of protein [18]. Also, these results are similar to the native and toasted soy flour” WAC [19]. On the other hand, for flours of other solid residues, such as pumpkin and papaya seeds, WAC values of between 4.468 and 6.408g of water g-1 of flour, respectively, have been reported [20]. These authors considered that the high WAC was due to the high fiber contents of the pumpkin and papaya seed flours, which were higher than the fiber content of the guava flour obtained in the study reported herein.
Dietary fiber can be used to enrich products and as an ingredient, due to its composition of polysaccharides, lignin, oligosaccharides and resistant starch, along with other compounds, which can confer different functional properties when applied in the food industry. Dietary fiber has important physiological effects and one option for increasing the fiber content of the human diet is the use of fruit processing residues by the food industry [21].
Table 4: Emulsifying activity (EA) of guava solid residue flour obtained using a knife or hammer mill and drying temperatures of 45, 50, 55, 60, 65 and 70 °C.
|
Temperature (oC) |
Knife mill(1) |
Hammer mill(1) |
|
45 |
0.477±0.022a |
0.503±0.018ªb |
|
50 |
0.463±0.016a |
0.453±0.011b |
|
55 |
0.447±0.009a |
0.503±0.016b |
|
60 |
0.460±0.013a |
0.507±0.011a |
|
65 |
0.457±0.011a |
0.487±0.011ªb |
|
70 |
0.463±0.011a |
0.503±0.018ªb |
1Average from triplicate analyses ± standard deviation.
Averages followed by the same letter in the same row do not different according to the Tukey test at 5 % of probability.
With regard to the emulsifying activity (Table 4), the values for the guava processing residue flours produced in the knife mill did not differ with a variation in the drying temperature. The emulsifying properties, which are an important aspect in the preparation of salad dressings and meat products, are related to the aqueous solubility of proteins, since they can reduce the interfacial tension between the hydrophobic and hydrophilic components in foods [21]. Guava residue flour does not present foaming activity, which suggests it is not suitable as an ingredient in foods where this property is required, such as ice cream, mousses, and others.
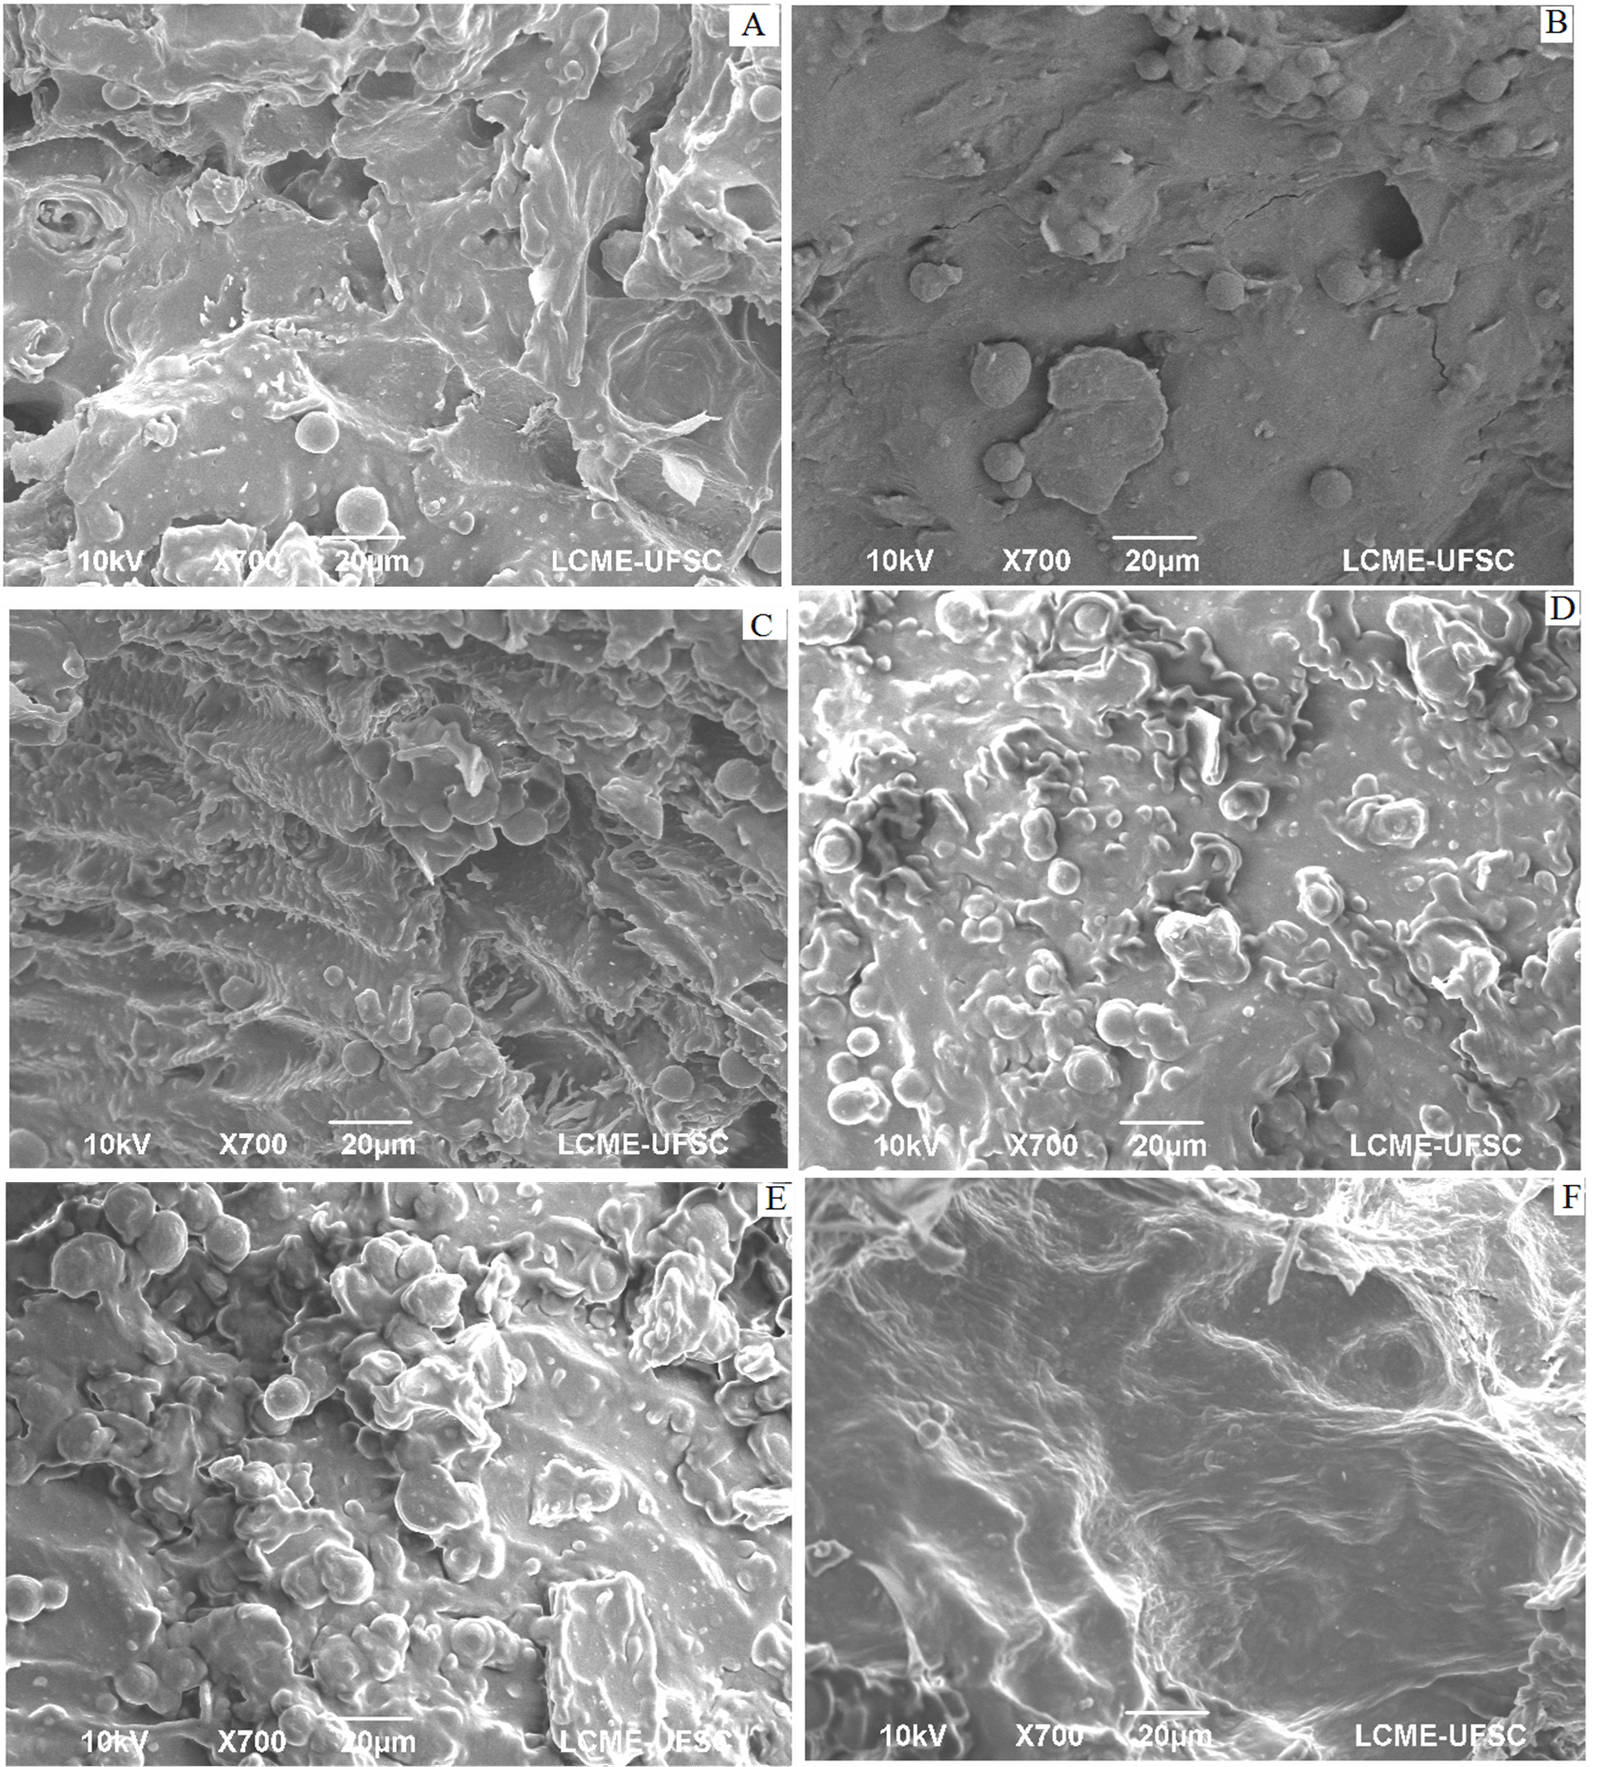
Figure 2: Scanning electronic micrography (700 X) of guava solid residue flour obtained using knife mill, dried at 45 (A), 50(B), 55(C), 60(D), 65(E) and 70(F).
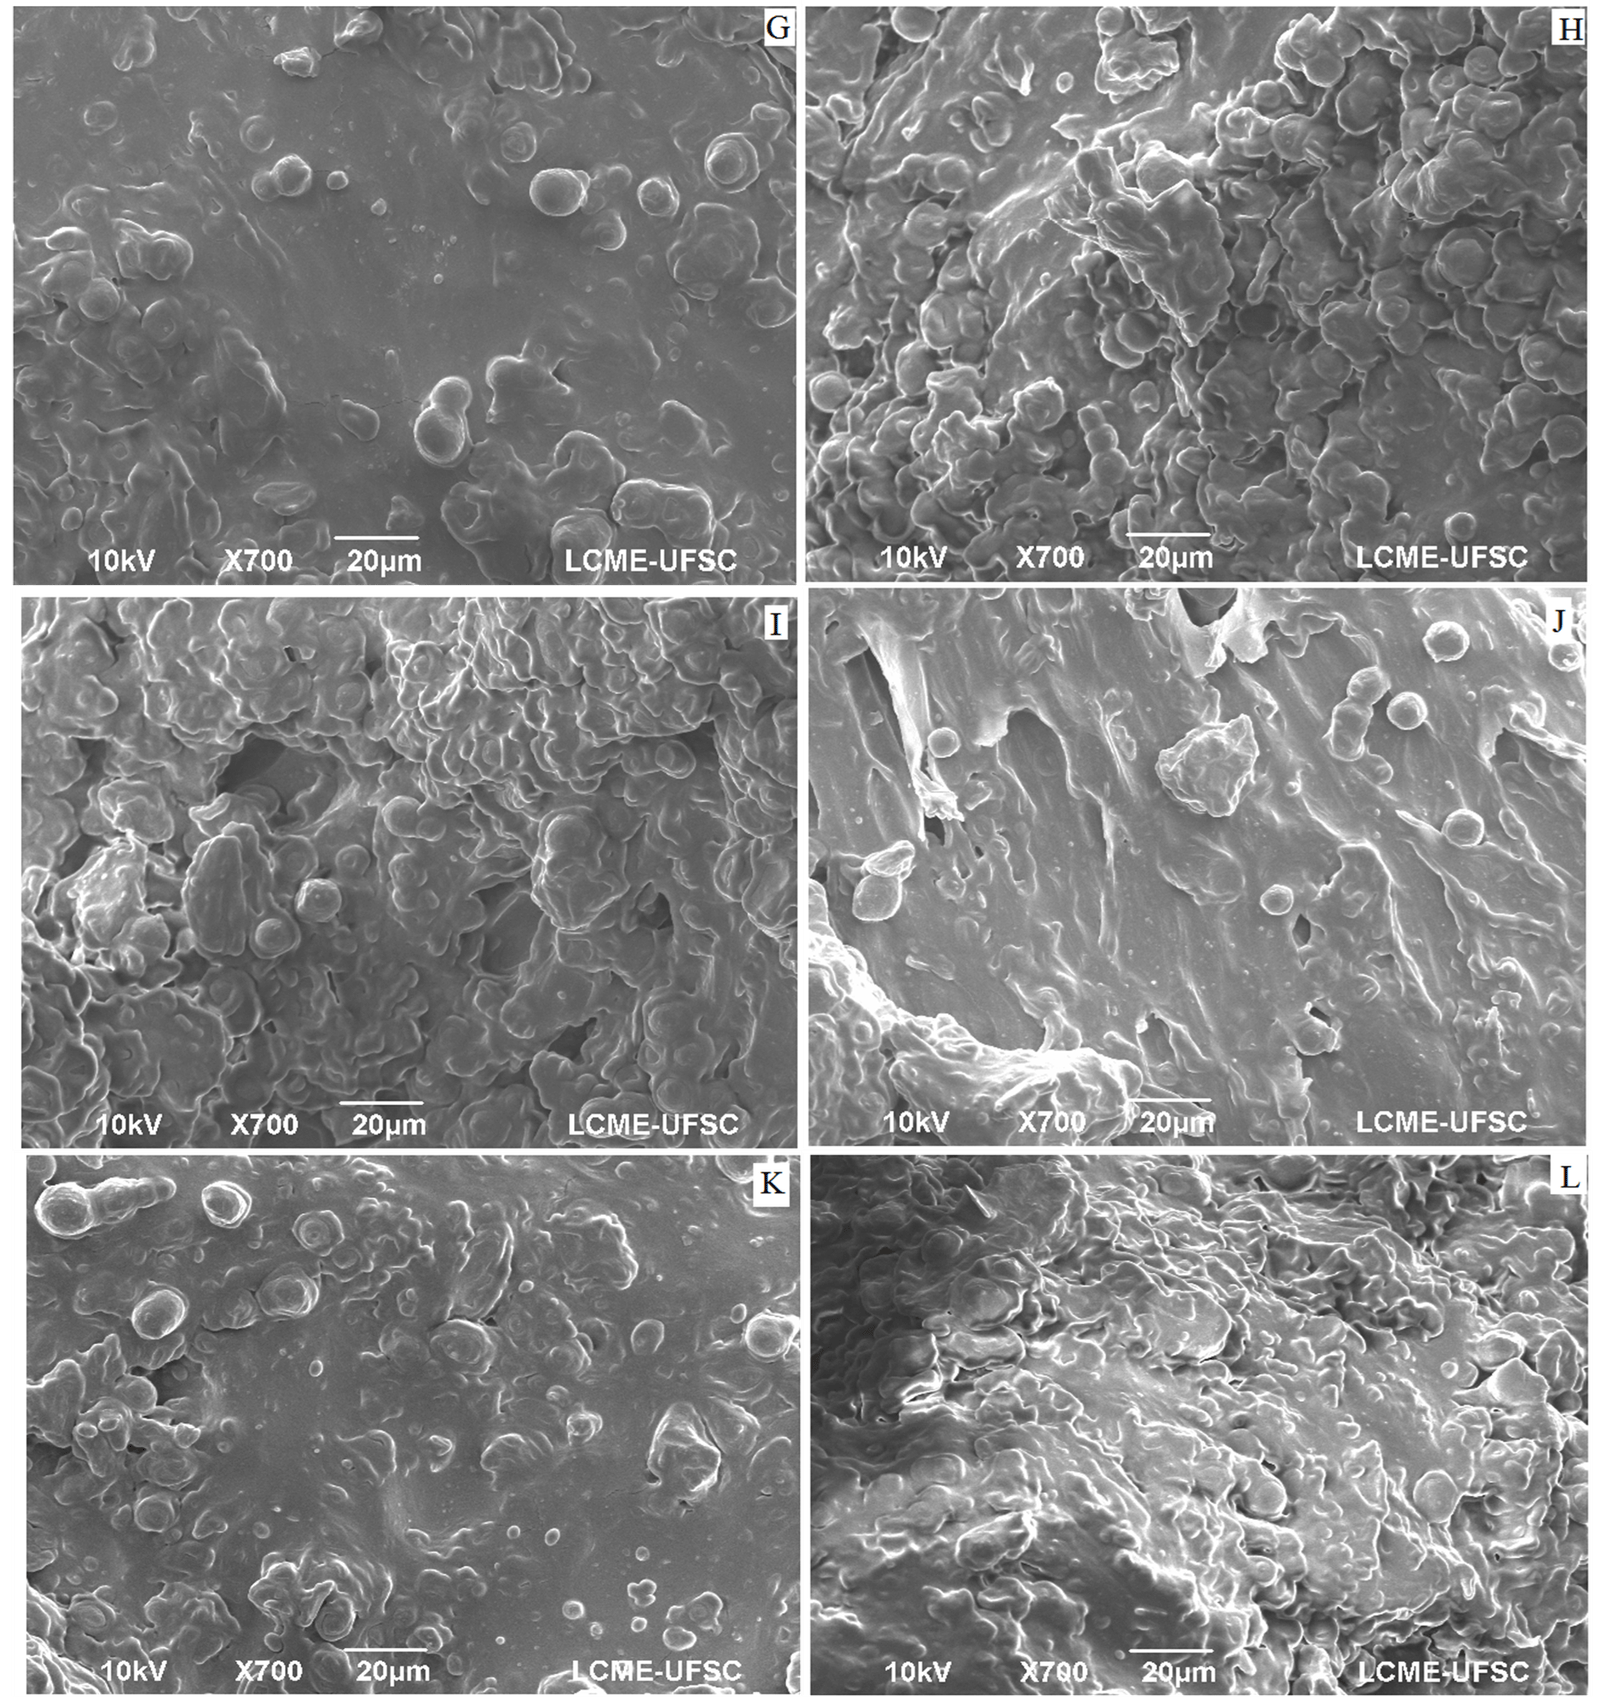
Figure 3: Scanning electronic micrography (700 X) of guava solid residue flour obtained using hammer mill, dried at 45 (G), 50(H), 55(I), 60(J), 65(K) and 70(L).
The type of particle size reduction, by hammer or knife mill, can be investigated by verifying whether the expected effects according to each type of grinding are observed in the microscopic structure of the flour particles. Structural food research, with regard to the identification of components and their interaction, can be performed using scanning electron microscopy [22]. In the micrographs represented by (Figures 2 & 3), the presence of spheroidal shapes on the material surface, both for grinding in a knife mill and as a hammer mill, whose diameters have little variation; so that these structures grow, in number, between drying temperatures of 45 to 55 °C. Regarding the structure, it is possible to observe that the material presents an irregular surface, with smooth parts, striated parts and the orifices of the vascular channels of the vegetable.
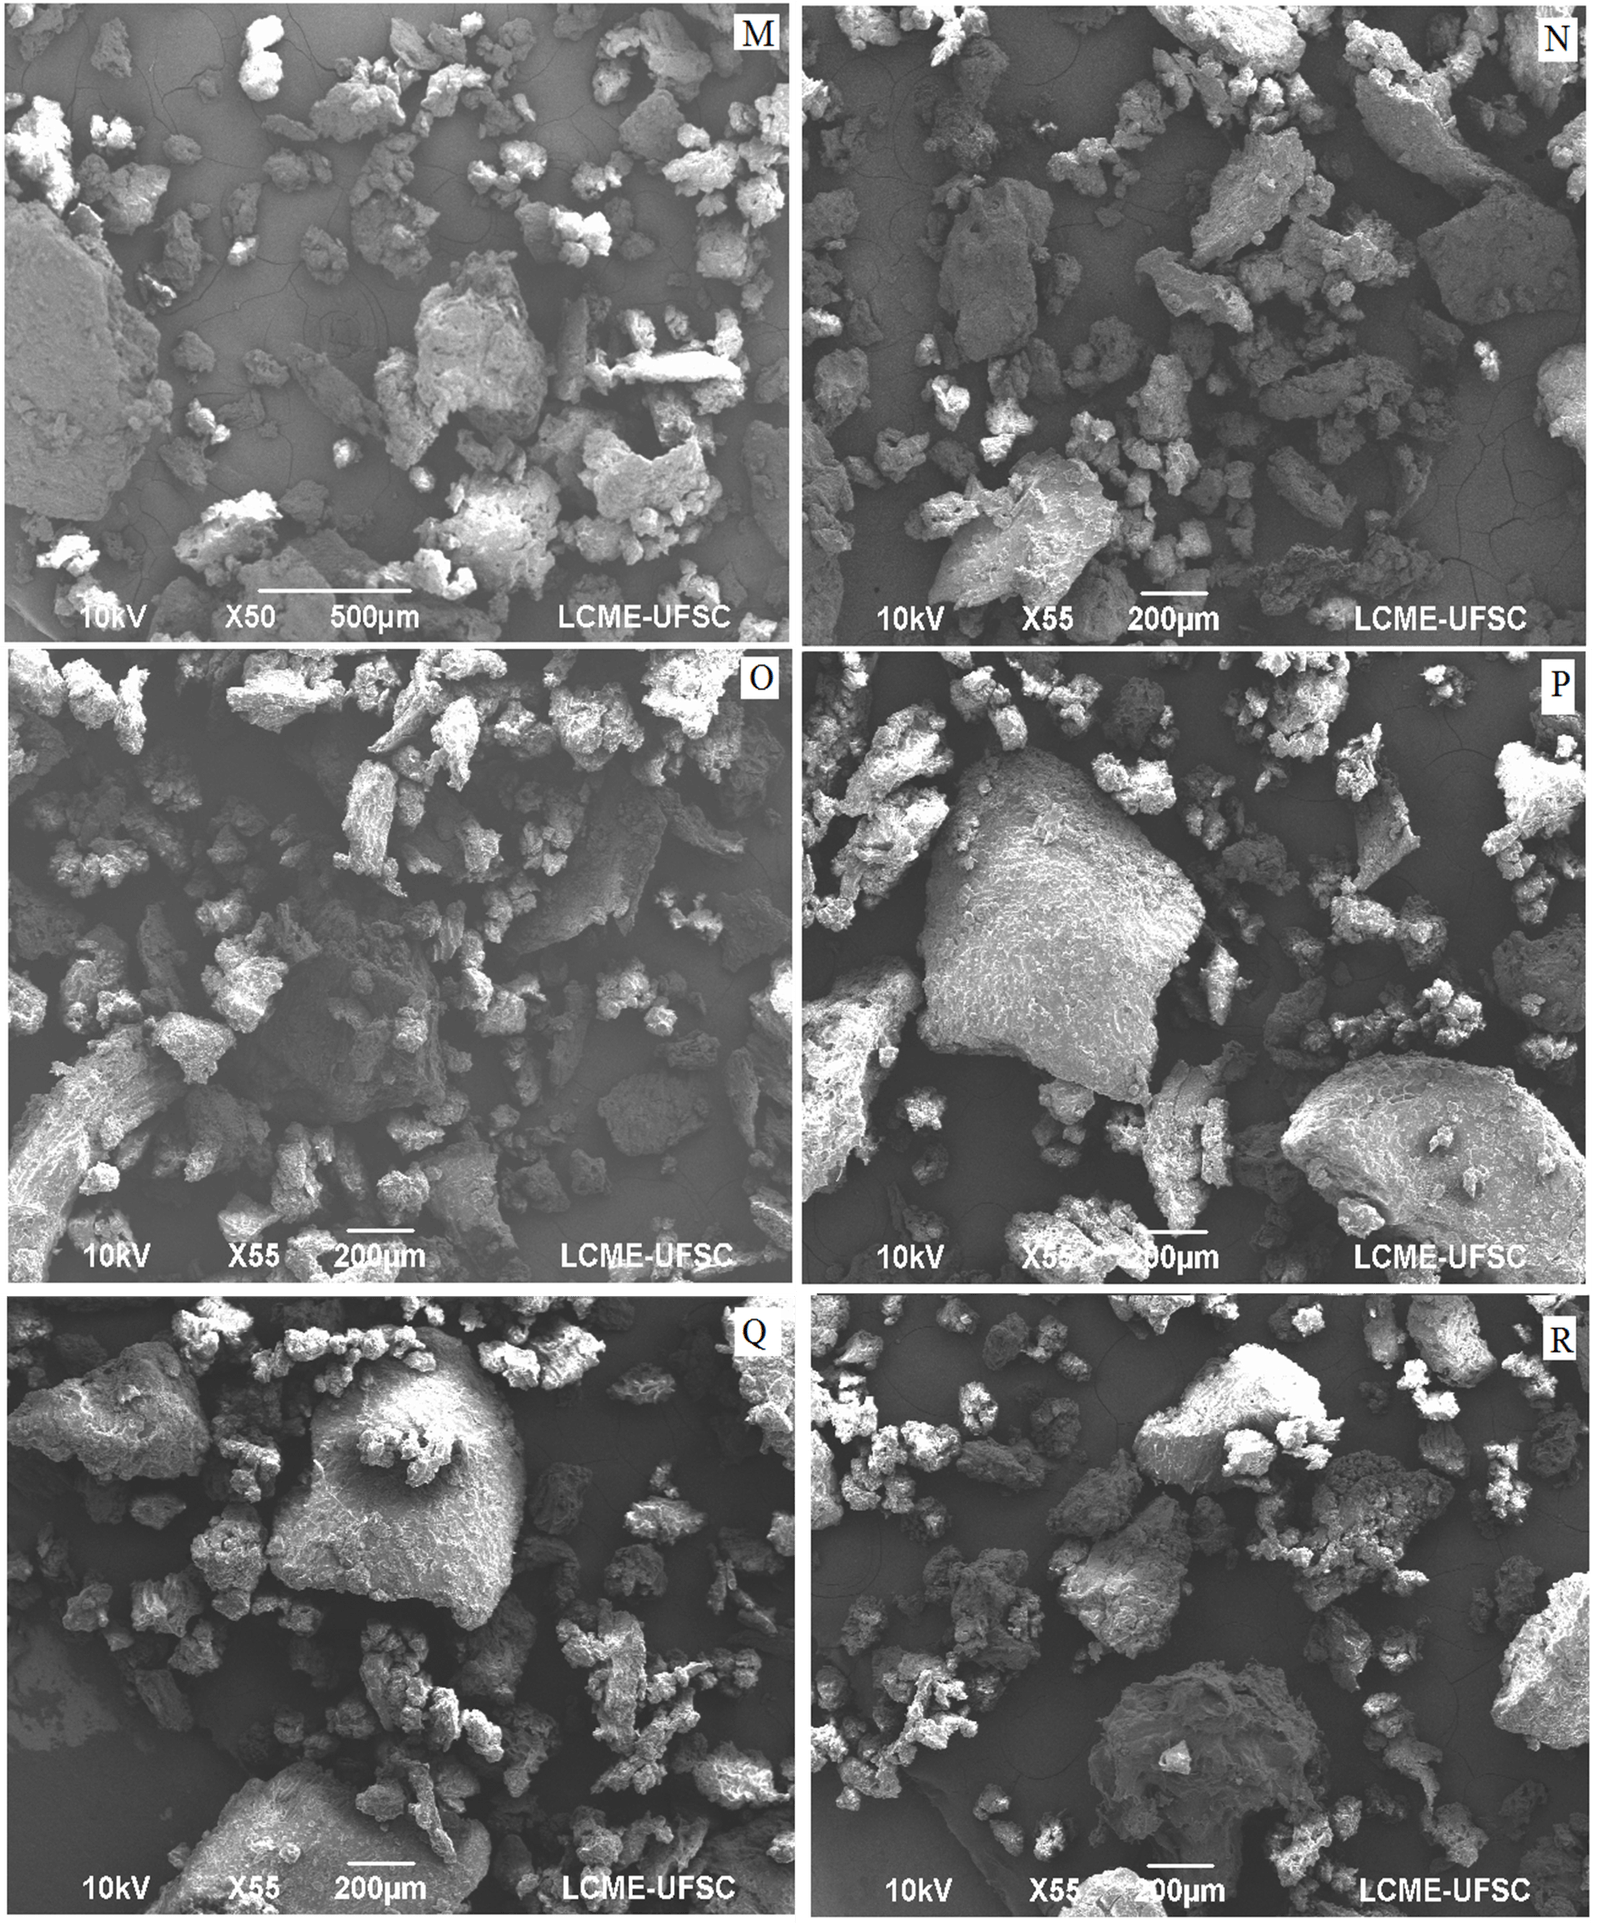
Figure 4: Scanning electronic micrography (55 X) of guava solid residue flour obtained using knife mill, dried at 45 (M), 50(N), 55(O), 60(P), 65(Q) and 70(R).
The micrographs obtained in this work indicate the presence of lignified bodies in plant tissues, such as seeds, leaves and pulp, including Myrtaceae family [23]. The stone cells are regular spheres that commonly occur in Myrtaceae. Regarding the distribution of the particles, in an increase of 55 times (Figures 4 & 5), it is observed that they do not have a defined shape, presenting a spongy surface aspect, typical of flours with high fiber content. Considering the importance of residues as a source of bioactive compounds, lycopene, total carotenoids and phenolic compounds, they were determined in the flours obtained at different drying temperatures ground in a knife and hammer mill (Table 5).
For flours obtained in a knife mill, it is observed that the highest levels of lycopene are relative to the dry material at 50 and 70 °C, with no statistical difference (p≤0.05) between these values. For the dry material at a temperature of 45 °C, the lowest lycopene content was obtained, with a statistically different value (p≥0.05) for temperatures of 50, 65 and 70 °C. When these results are compared with the morphological evaluation based on electron micrographs, it is suggestive to say that the particle size has influenced the best extraction of lycopene (Figure 4). Another factor with the possibility of influencing the lycopene content is the lower exposure of the material during drying, because at higher temperatures, the exposure is lower and in this work the drying times for an initial mass of approximately 3.5 g decreased from five hours and twenty minutes, drying at 45 oC, for three hours drying at 70 °C.
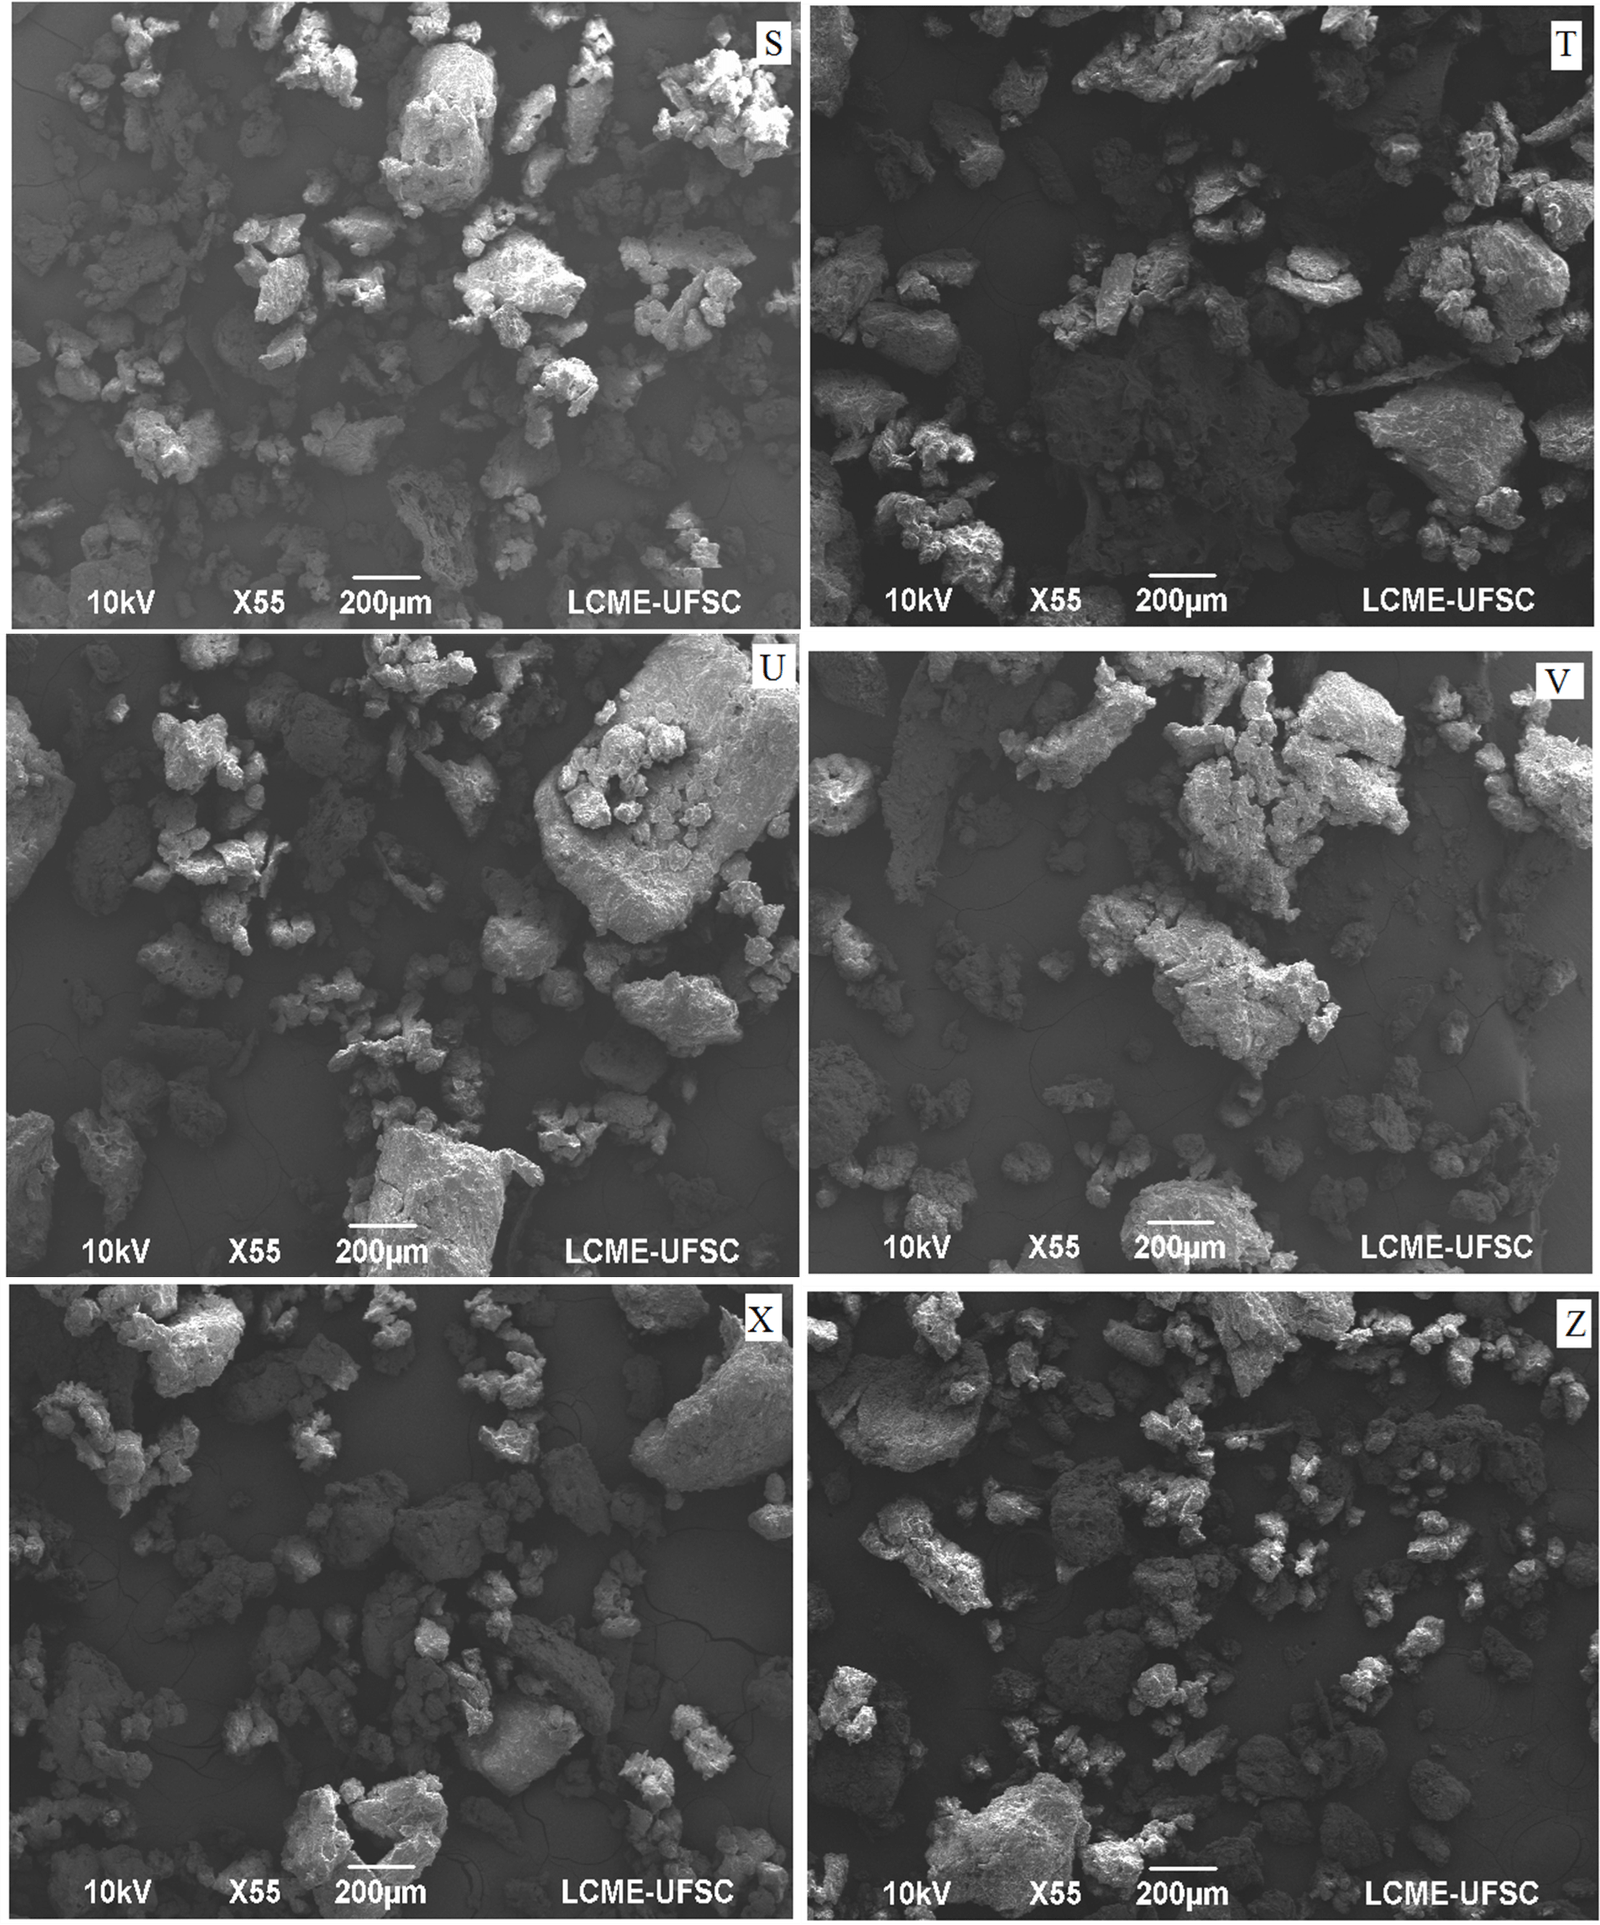
Figure 5: Scanning electronic micrography (55 X) of guava solid residue flour obtained using hammer mill, dried at 45 (S), 50(T), 55(U), 60(V), 65(X) and 70(Z).
Table 5: Total carotenoids, lycopene and phenolic compounds of guava solid residue flour obtained using a knife or hammer mill, drying temperatures of 45, 50, 55, 60, 65 and 70 °C.
|
Temperature (oC) |
Total carotenoids1 |
Lycopene1 |
Phenolic compounds1 |
|||
|
(µg g-1) |
||||||
|
(1) |
(2) |
(1) |
(2) |
(1) |
(2) |
|
|
45 |
3.7±0.24d |
5.9±0.03a |
2.1±0.23c |
4.4±0.03a |
990±41.3b |
987±8.6ª |
|
50 |
5.6±0.82a |
4.7±0.04ab |
3.5±0.39ab |
3.5±0.03b |
1,130±2.,3ª |
876±42.8b |
|
55 |
4.2±0.51c |
1.9±0.36c |
2.6±0.32bc |
1.4±0.27d |
1,010±29.4b |
966±4.21ab |
|
60 |
4.3±0.26b |
2.9±0.16bc |
2.5±0.23bc |
2.2±0.12c |
1,005±53.9b |
914±74.7ab |
|
65 |
4.0±0.61d |
3.1±0.26bc |
2.9±0.16b |
2.6±0.25c |
969±51,2b |
891±126.5ab |
|
70 |
47±0.53a |
4.3±0.38b |
3.9±0.37a |
3.3±0.28b |
965±39.3b |
883±48.6b |
(1) Knife mill; (2) hammer mill
1Average from triplicate analyses ± standard deviation. Averages followed by the same letter in the same column do not different according to the Tukey test at 5 % of probability.
Although not the same residue used in our study, Kong et al. investigated the drying of the residue from a guava pulp decanter, applying the response surface methodology for the optimization of the drying [24]. A temperature of 43.79 oC and a drying time of 6.41 h led to the lowest degree of degradation of the lycopene. The relation between time and temperature was significant in terms of the behaviour of the dependent variables. When comparing the averages for the lycopene content extracted from the material milled in knife and hammer mills, there is a significant difference (p≥0.05) between the lycopene content for material dried at 45 and 50 oC, milled in a knife and hammer mill, respectively. Regarding the lycopene content in solid residues from pulping guava, there are few studies in the literature, most of which are aimed at investigating total carotenoids, antioxidant activity and phenolic compounds.
However, Kong and Ismail evaluated the lycopene content in the residue from the processing of guava to obtain puree, in various stages of the process (decanter, sieves and refiners), finding values of 71.2, 57.7 and 39.4 µg g-1, respectively, values higher than those found in the present work, where residues are predominantly seeds and peels, at final of the process [25]. Another possible difference with the present work is in the drying process, the residues studied by Kong and Ismail, were lyophilized, promoting lower losses of lycopene. In addition to the analytical methodology used, which may have influenced these differences [25]. In fresh guava, the lycopene content can achieve the range of 43.80 to 69.99 µg g-1 [26 - 28]. According to Padula and Rodriguez-Amaya, lycopene accounts for 86% of the carotenoids present in the guava peel [29]. Regarding the daily recommendation of intake (ID) of lycopene, the Institute of Medicine of The National Academy of Sciences, recommends an intake between 5 and 10 mg [30]. Therefore, the residue of the processing of the guava, after drying and grinding, in an amount around of 5.0 g of elaborated product, would meet the daily needs for lycopene intake.
The values for the carotenoid content for the material milled in a knife mill are higher for the temperature of 50 °C, however they do not differ statistically (p≤0.05) from those extracted from the dry material at 60 and 70 °C and also milled in a knife mill; which demonstrates that the drying temperature, under the conditions carried out in the present work, did not interfere with the stability of the carotenoids, in order to degrade them. The lower content of carotenoids extracted from the sample dried at 45 °C, suggests water interference in the matrix, or even greater degradation of carotenoids due to a longer exposure time of the material during the drying step. Regarding the carotenoid content of the dry residue at the temperatures of the present work and ground in a hammer mill, the highest value corresponds to the drying temperature of 45 °C, the opposite behaviour to that observed for a knife mill, this fact suggests that there are differences in particle structure obtained by different milling processes.
Regarding the content of carotenoids extracted from dry samples at other temperatures, it is observed (Table 5) that there were no significant differences (p≤0.05) for the content of carotenoids extracted from the dry material at 50 and 70 °C and at 60 and 65, and 65 and 70 °C, this fact shows that the drying of the residue from the processing of the guava carried out under the conditions of the present study, can affect the stability of the carotenoids present.
Souza et al., carried out the nutritional characterization and evaluated the composition of bioactive substances in Brazilian tropical fruit residues although in this work the lycopene content was not evaluated, it was found for the guava residue 644.9 ± 10.02 μg 100g-1 in total carotenoids, which is equivalent to 6.45 ± 0.01µg g-1, these results being above that found in the present study [31]. The decreasing of carotenoids in this study can be related to the particle size and temperature. The main cause of loss or destruction of carotenoids during processing is oxidation [13]. The degradation of carotenoids by oxidation was also observed by Nunes et al. [8].
The content of phenolic compounds in the residue from the processing of guava (Table 5) is between 883 and 1,130 µg g-1, with statistical difference (p≥0.05) for the dry material at 50 °C and the other temperatures for knife mill and dry material at 45 and 50 and 70 °C for hammer mill, with no statistical difference (p≤0.05) for other drying temperatures. When confronted with the contents of phenolic compounds corresponding to the two milling processes, it appears that the two highest and lowest values correspond to the drying temperatures of 45 and 50 °C, however, in an inverted way, that is, for knife mills, the highest content of phenolic compounds corresponds to the material dried at 50 °C whereas for the hammer mill this content is relative to the dry material at 45 °C, these facts show that in addition to the drying temperature, the grinding process also interferes in the content phenolic compounds that can be extracted from the plant matrix under study.
The behaviour for the content of phenolic compounds verified in the present work through electron micrographs, reinforce the thesis that the spherical forms, verified in the micrographs with a 700-fold magnification (Figures 2 & 3), can be due to lignin, which has an amorphous structure. Souza et al. found a content of phenolic compounds of 24.63 ± 0.29 mg 100 g-1 for the guava industrial residue, which is lower than that found in the present study [31]. Thaipong et al. determined the content of phenolic compounds in six genotypes of red and white guava produced in the states of Florida and Alabama in the United States of America, finding significant differences in the contents of phenolic compounds, expressed in mg of gallic acid per 100g of fresh pulp, with the lowest content corresponding to the Ruby Supreme variety (170.0 ± 5.6) of red pulp and the highest content corresponding to the Allahabad Safeda variety (344.90 ± 33.6) of white pulp [32]. These values are higher than those found in the present work.
Castro-Vargas et al. in order to find other alternatives to strengthen the guava productive chain, a fruit of great importance for Colombia, tested the efficiency of several processes and solvents in the extraction of phenolic compounds from guava seeds [33]. The contents of phenolic compounds, in mg of gallic acid per 100g of seed, varied according to the solvent and method, with the lowest content (50 ± 1 mg 100g-1) for extraction with supercritical CO2 and ethyl acetate as co-solvent and the highest content (176 ± 10 mg 100g-1) for conventional extraction in Soxhlet and using ethanol as solvent extractor, what can justifies the variations found between different researches.
The comparison of the contents of phenolic compounds determined by Thaipong et al. and Castro-Vargas et al., suggests that the contribution of seeds to the content of phenolic compounds in the residue from the processing of guava is significant, since in the present work, the content of phenolic compounds varied, in µg of gallic acid per g of dry residue, between 876 ± 42.8 (drying at 50 °C and grinding in a hammer mill) and 1,130 ± 24.3 (drying at 50 °C and grinding in a knife mill) [32, 33]. According to Hassimotto et al., the total phenolic content in red guava pulp (124.0 mg 100g-1) was lower than that found in the skin of this fruit (420 mg 100g-1) [34].
Fruit residues may represent a good alternative for use as functional foods, but the safety of these residues, regarding the presence of pesticides, toxins and other contaminants, must be considered. Thus, in the food industry, the whole fruit should be considered as a raw material, including the peels and seeds, and the same quality criteria currently applied to the commercialized fruit need to be applied to these components which are generally considered as residues.
Conclusion
The two-term exponential model and the Henderson and Pabis model provided the best fits with the data obtained for flour samples dried at 45 oC. The diffusion approximation model gave a good fit with the data for the guava processing solid residue dried at a temperature of 60 °C, while the Page model provided the best fit with the data for the samples dried at 65 °C. Of the models tested applying the temperatures used in the experiment, only the fits for the Henderson and Pabis model with the experimental data for the samples dried at 45 to 50 °C did not represent the drying kinetics, with coefficients of determination of 0.9376 and 0.6905, respectively.
The WAC was higher than the OHC for the flours produced in knife and hammer mills, for all drying temperatures, which is attributed to the high dietary fiber content of this material. The emulsifying capacity of the guava processing residue flours produced in the knife mill did not vary according to the drying temperature. However, for the samples ground in the hammer mill, the values obtained for samples dried at 50 and 60 ºC showed a statistical difference, but for the other drying temperatures no differences were observed.
Total carotenoids, lycopene and phenolic compounds present in the residue from the guava processing, are influenced by the drying temperature and the type of grinding, with the phenolic compounds present in significant amounts in the studied residue.
Considering the volume of this kind of residue produced globally, future studies should be carried out with the aim of providing a new source of dietary fiber for food formulations.
Acknowledgements
The authors are grateful to the Brazilian governmental agencies CNPq (Conselho Nacional de Desenvolvimento Científico e Tecnológico) (grant number 304741/2014-0), CAPES (Coordenação de Aperfeiçoamento de Pessoal de Nível Superior) for financial support, to the guava pulp plant for supplying the samples and Central Laboratory of Microscopy of the Santa Catarina Federal University.
Conflicts of Interest
None.
Article Info
Article Type
Research ArticlePublication history
Received: Tue 01, Sep 2020Accepted: Wed 07, Oct 2020
Published: Fri 20, Nov 2020
Copyright
© 2023 Edna Regina Amante. This is an open-access article distributed under the terms of the Creative Commons Attribution License, which permits unrestricted use, distribution, and reproduction in any medium, provided the original author and source are credited. Hosting by Science Repository.DOI: 10.31487/j.JFNM.2020.02.07
Author Info
Corresponding Author
Edna Regina AmanteDepartment of Food Science and Technology, Center of Agricultural Science, Federal University of Santa Catarina, Santa Catarina, Brazil
Figures & Tables
Table 1: Parameters of the models: diffusion approximation, two term exponential, Henderson and Pabis, logarithmic and Page, coefficient of determination (R2) and mean square deviation (MSD) for the drying of guava pulp processing residue at 45, 50, 55, 60, 65 and 70 °C.
|
Diffusion aproximation |
|||||
|
|
a |
k |
B |
R2 (decimal) |
MSD |
|
45 |
0.00315 |
0.107893 |
0.134411 |
0.9991 |
0.011 |
|
50 |
-0.02322 |
1.119691 |
0.012708 |
0.9955 |
0.026 |
|
55 |
0.00272 |
0.248668 |
0.060365 |
0.9979 |
0.018 |
|
60 |
0.08126 |
0.245399 |
0.061820 |
0.9995 |
0.008 |
|
65 |
-130.875 |
0.023288 |
0.997606 |
0.9913 |
0.011 |
|
70 |
-0.00492 |
0.768696 |
0.025576 |
0.9914 |
0.011 |
Two-term exponential
|
|
a |
K |
R2 (decimal) |
MSD |
|
45 |
1.0000 |
0.014545 |
0.9991 |
0.011 |
|
50 |
0.0048 |
2.872565 |
0.9952 |
0.027 |
|
55 |
0.0077 |
1.927482 |
0.9979 |
0.018 |
|
60 |
0.0835 |
0.181095 |
0.9949 |
0.008 |
|
65 |
0.0052 |
3.356372 |
0.9986 |
0.014 |
|
70 |
0.0034 |
5.672267 |
0.9969 |
0.023 |
Henderson and Pabis
|
|
a |
K |
R2 |
MSD |
|
45 |
0.10928 |
-2.36567 |
0.9376 |
0.093 |
|
50 |
0.17277 |
-45.1983 |
0.6905 |
0.298 |
|
55 |
0.99855 |
0.015029 |
0.9985 |
0.018 |
|
60 |
0.95865 |
0.015777 |
0.9987 |
0.013 |
|
65 |
1.00798 |
0.017625 |
0.9987 |
0.014 |
|
70 |
1.02696 |
0.01999 |
0.9974 |
0.021 |
Logarithmic
|
|
a |
k |
c |
R2 (decimal) |
MSD |
|
45 |
1.006174 |
0.0138 |
-0.015438 |
0.9995 |
0.008 |
|
50 |
1.017238 |
0.0136 |
-0.011265 |
0.9953 |
0.026 |
|
55 |
1.001110 |
0.0137 |
-0.028462 |
0.9990 |
0.012 |
|
60 |
0.960831 |
0.0154 |
-0.006084 |
0.9988 |
0.013 |
|
65 |
1.015021 |
0.0166 |
-0.017076 |
0.9993 |
0.010 |
|
70 |
1.056659 |
0.0175 |
-0.048354 |
0.9987 |
0.015 |
Page
|
|
n |
k |
R2 |
MSD |
|
45 |
1.010566 |
0.013873 |
0.9917 |
0.010 |
|
50 |
1.013976 |
0.01306 |
0.9953 |
0.026 |
|
55 |
1.027929 |
0.013288 |
0.9980 |
0.017 |
|
60 |
0.918992 |
0.023463 |
0.9978 |
0.017 |
|
65 |
1.052065 |
0.013980 |
0.9990 |
0.012 |
|
70 |
1.082752 |
0.013831 |
0.9979 |
0.019 |
Table 2: Equations for the kinetics of the guava solid residue drying at six temperatures.
|
Temperature (°C) |
Equation |
R2 ( %) |
|
45 |
y = 5.0 x 10-6x2 – 0.0064x + 1.5958 |
0.9931 |
|
50 |
y = 1.0x10-6x2 – 0.0056x + 1.5878 |
0.9947 |
|
55 |
y = 7.0x10-6x2 – 0.008x + 1.6533 |
0.9791 |
|
60 |
y = -1.0x 10-6x2 – 0.0054x + 1.5576 |
0.9978 |
|
65 |
y = 1.0x10-5x2 – 0.0098x + 1.6605 |
0.9818 |
|
70 |
y = -2.0x10-5x2 – 0.0054x + 1.5535 |
0.9961 |
Table 3: Oil holding capacity (OHC) (g of oil/g of flour) and water absorption capacity (WAC) (g of water/g of flour) of guava processing residue flour samples produced at different temperatures, ground in a knife or hammer mill.
|
Temperature (oC) |
Knife mill(1) |
|
|
Hammer Mill (1) |
|
|
OHC |
WAC |
|
OHC |
WAC |
|
|
45 |
1.020±0.040ab |
2.253±0.011ce |
|
0.897±0.031ab |
2.457±0.102a |
|
50 |
0.933±0.036b |
1.947±0.024fe |
|
1.020±0.033ab |
2.400±0.053ªb |
|
55 |
0.947±0.018ab |
2.200±0.013dbe |
|
1.007±0.044ab |
2.163±0.082ab |
|
60 |
0.957±0.004ab |
2.073±0.016e |
|
1.213±0.071a |
2.313±0.204ab |
|
65 |
1.007±0.049ab |
2.277±0.096b |
|
1.020±0.127ab |
2.000±0.067b |
|
70 |
1.053±0.016a |
2.437±0.031a |
|
0.950±0.040b |
2.360±0.127ab |
1Average of triplicate analyses ± standard deviation.
Averages followed by the same letters in the same row do not different according to the Tukey test at a 5 % probability.
Table 4: Emulsifying activity (EA) of guava solid residue flour obtained using a knife or hammer mill and drying temperatures of 45, 50, 55, 60, 65 and 70 °C.
|
Temperature (oC) |
Knife mill(1) |
Hammer mill(1) |
|
45 |
0.477±0.022a |
0.503±0.018ªb |
|
50 |
0.463±0.016a |
0.453±0.011b |
|
55 |
0.447±0.009a |
0.503±0.016b |
|
60 |
0.460±0.013a |
0.507±0.011a |
|
65 |
0.457±0.011a |
0.487±0.011ªb |
|
70 |
0.463±0.011a |
0.503±0.018ªb |
1Average from triplicate analyses ± standard deviation.
Averages followed by the same letter in the same row do not different according to the Tukey test at 5 % of probability.
Table 5: Total carotenoids, lycopene and phenolic compounds of guava solid residue flour obtained using a knife or hammer mill, drying temperatures of 45, 50, 55, 60, 65 and 70 °C.
|
Temperature (oC) |
Total carotenoids1 |
Lycopene1 |
Phenolic compounds1 |
|||
|
(µg g-1) |
||||||
|
(1) |
(2) |
(1) |
(2) |
(1) |
(2) |
|
|
45 |
3.7±0.24d |
5.9±0.03a |
2.1±0.23c |
4.4±0.03a |
990±41.3b |
987±8.6ª |
|
50 |
5.6±0.82a |
4.7±0.04ab |
3.5±0.39ab |
3.5±0.03b |
1,130±2.,3ª |
876±42.8b |
|
55 |
4.2±0.51c |
1.9±0.36c |
2.6±0.32bc |
1.4±0.27d |
1,010±29.4b |
966±4.21ab |
|
60 |
4.3±0.26b |
2.9±0.16bc |
2.5±0.23bc |
2.2±0.12c |
1,005±53.9b |
914±74.7ab |
|
65 |
4.0±0.61d |
3.1±0.26bc |
2.9±0.16b |
2.6±0.25c |
969±51,2b |
891±126.5ab |
|
70 |
47±0.53a |
4.3±0.38b |
3.9±0.37a |
3.3±0.28b |
965±39.3b |
883±48.6b |
(1) Knife mill; (2) hammer mill
1Average from triplicate analyses ± standard deviation. Averages followed by the same letter in the same column do not different according to the Tukey test at 5 % of probability.
References
- Gupta N, Poddar K, Sarkar D, Kumari N, Padhan B et al. (2019) Fruit waste management by pigment production and utilization of residual as bioadsorbent. J Environ Manage 244: 138-143. [Crossref]
- Lima R da S, Ferreira, SRS, Vitali L, Block JM (2019) May the superfruit red guava and its processing waste be a potential ingredient in functional foods? Food Res Int 115: 451-459. [Crossref]
- Irshad Z, Hanif MA, Ayub MA, Jilani MI, Tavallali V (2020) Guava. In.: Medicinal Plants of South Asia. 1st Edition - Elsevier 341-354.
- The Daily Records (2018) http://www.thedailyrecords.com/2018-2019-2020-2021/world-famous-top-10-list/world/largest-guava-producing-countries-world-fruits-states/6566/ 17: 22-14.
- Narváez Cuenca CE, Inampues Charfuelan ML, Hurtado Benavides AM, Parada Alfonso F, Vincken JP (2020) The phenolic compounds, tocopherols, and phytosterols in the edible oil of guava (Psidium guava) seeds obtained by supercritical CO2 extraction. J Food Comp Anal 89: 103467.
- Hernández Acosta M, Castro Vargas HI, Parada Alfonso F (2011) Integrated utilization of guava (Psidium guajava L.): antioxidant activity of phenolic extracts obtained from guava seeds with supercritical CO2-ethanol. J Braz Chem Soc 22:2383-2390.
- Muniz CES, Santiago AM, Gusmão TAS, Oliveira HML, Conrado LdeS et al. (2020) Solid-state fermentation for single-cell protein enrichment of guava and cashew by-products and inclusion on cereal bars. Bioc Agric Biotech 25: 101576.
- Nunes J, Lago MG, Castelo Branco VN, Oliveira FR, Torres AG et al. (2016) Effect of drying method on volatile compounds, phenolic profile and antioxidant capacity of guava powders. Food Chem 197: 881-890. [Crossref]
- Lin MJY, Humbert ES, Sosulski FW (1974) Certain functional properties of sunflower meal products. J Food Sci 39: 368-370.
- Glória MM, Regitano D’arce MAB (2000) Concentrado e isolado proteico de torta de castanha do Pará: obtenção e caracterização química e funcional. Ciência e Tecnologia de Alimentos 20: 240-245.
- Siddiq M, Ravi R, Harte JB, Dolan KD (2010) Physical and functional characteristics of selected dry bean (Phaseolus vulgaris L.) flours. Food Sci Tech 43:232-237.
- Kaur M, Singh N (2005) Studies on functional, thermal and pasting properties of flour from different chickpea (Cicer arietinum L.) cultivars. Food Chem 91: 403-411.
- Rodriguez Amaya DB (2001) Latin American food sources of carotenoids. Arch Latinoam Nutr 49: 74S-84S. [Crossref]
- Bloor SJ (2001) Overview of methods for analysis and identification of flavonoids. Methods Enzymol 335: 3-14. [Crossref]
- Singleton VL, Rossi JA (1965) Colorimetry of total phenolics with phosphomolybdic-phosphotungstic acid reagents. Amer J Enol Vitic 20:144-158.
- Babalis SJ, Belessiotis VG (2004) Influence of the drying conditions on the drying constants and moisture diffusivity during the thin-layer drying of figs. J Food Eng 65: 449-458.
- Mohapatra D, Rao PS (2005) A thin layer drying model of parboiled wheat. J Food Eng 66: 513-518.
- Fontanari GG, Jacon MC, Pastre IA, Fertonani FL, Neves VA et al. (2007) Isolado proteico de semente de goiaba (Psidium guajava): caracterização de propriedades funcionais. Ciência e Tecnologia de Alimentos 27: 73-79.
- Kumar V, Rani A, Hussain L, Yadav M, Jha P et al. (2017) Changes in physicochemical properties of native and toasted defatted soy flour on submission to electron beam radiation. Food Biop Proc 105: 141-146.
- Porte A, da Silva EF, de Almeida VDdosS, da Silva TX, Porte LHM (2011) Propriedades funcionais tecnológicas das farinhas de sementes de mamão (Carica papaya) e de abóbora (cucúrbita sp). Rev Bras Prod Agroind 13: 91-96.
- Kinsella JE (1976) Functional properties in foods: a survey. CRC Crit Rev Food Sci Nut 7: 219-280.
- Aguilera JM, Stanley DW (1990) Microstructural principles of food processing and engineering. New York: Elsevier Science Publishers 641.
- Simpson MG (2020) Cap 9 Plant Morphology. In: Plant Systematics (Third Edition) 469-535. Academic Press.
- Kong KW, Ismail A, Tan CP, Rajab NF (2010) Optimization of oven drying conditions for lycopene content and lipophylic antioxidant capacity in a byproduct of the pink guava puree industry using response surface methodology. LWT - Food Sci Tech 43: 729-735.
- Kong KW, Ismail A (2011) Lycopene content and lipophilic antioxidant capacity of by-products from Psidium guajava fruits produced during puree production industry. Food Byp Proc 89: 53-61.
- Wilberg VC, Rodriguez Amaya DB (1995) HPLC - Quantitation of major carotenoids of fresh and processed guava, mango and papaya. LWT - Food Sci Tech 28: 474-480.
- Yano M, Kato M, Ikoma Y, Kawasaki A, Fukazawa Y et al. (2005) Quantitation of carotenoids in raw and processed fruits in Japan. Food Sci Tech Res 11: 13-18.
- USDA National Nutrient Database for Standard Reference (2015) Disponível em:http:// www.nal.usda.gov/fnic/foodcomp/search/
- Padula M, Rodriguez Amaya DB (1986) Characterisation of the carotenoids and assessment of the vitamin A value of Brazilian guavas (Psidium guajava L.). Food Chem 20: 11-19.
- IOM - Institute of Medicine of The National Academy of Sciences (2015) Dietary Reference Intake (DRI). Food and Nutrition Board. Washington: National Academy Press, 1999: <http://www.nap.edu>
- Souza MSB, Vieira LM, Silva MJM, Lima A (2011) Caracterização nutricional e compostos antioxidantes em resíduos de polpas de frutas tropicais. Ciência e Agrotecnologia 35: 554-559.
- Thaipong K, Boonprakob U, Crosbyb K, Cisneros Zevallosc L, Byrnec DH (2006) Comparison of ABTS, DPPH, FRAP, and ORAC assays for estimating antioxidant activity from guava fruit extracts. J Food Comp Anal 19: 669-675.
- Castro Vargas H, Rodriguez Varekab LI, Ferreira SRS, Parada Alfonso F (2010) Extraction of phenolic fraction from guava seeds (Psidium guajava L.) using supercritical carbon dioxide and co-solvents. J Supercritical Fluids 51: 319-324.
- Hassimotto NMA, Genovese MI, Lajolo FM (2005) Antioxidant activity of dietary fruits, vegetables, and commercial frozen fruit pulps. J Agric Food Chem 53: 2928-2935. [Crossref]