Journals
Diets containing naturally occurring iron or naturally occurring iron plus supplemental ferrous sulfate both maintain normal hematological status in adult dogs
A B S T R A C T
Iron is an essential mineral for dogs due to its roles in physiological processes. The NRC recommends the adequate intake for iron in adult dogs is 0.5 mg/kg of body weight. While iron should be present in high enough concentrations in the diet to maintain normal hematological status and prevent iron deficiency anemia, too much dietary iron can increase lipid oxidation in the food during preparation and storage, subsequently reducing shelf life, palatability, and nutritional content of foods. In general, iron is supplemented to diets to ensure that no dogs are deficient. The primary objective of this study was to investigate the ability of a diet containing either 0 mg/kg or 80 mg/kg supplemental iron to support normal hematological parameters in adult dogs. Twenty-two adult dogs were randomly assigned to one of two treatment diets: Test Diet 1, Experimental maintenance formula with 115 mg/kg endogenous iron + 0 mg/kg supplemental iron; and Test Diet 2, Experimental maintenance formula with 115 mg/kg endogenous iron + 80 mg/kg supplemental iron (ferrous sulfate). Dogs consumed treatment diets for 26 weeks, with clinical assessments (e.g., hemoglobin concentration/total iron binding capacity) assessed throughout the trial (0, 2, 4, and 6 months). Baseline iron related endpoints were not different between diet treatments (P > 0.50), except for mean corpuscular hemoglobin concentrations (P = 0.046). No differences were found for iron related end points between the two diet treatments (P>0.05) at any time point. In some diets no supplemental iron will be needed, based on the diet matrix, whereas others may require some supplemental iron. By reducing iron inclusion in the formulations of canine diets, food stability and shelf life may be improved. This reduction in supplemental iron can also reduce cost of formulation, benefiting food manufacturers, consumers, and adult dogs.
Keywords
Dog,iron,anemia,hematology,supplementation
Introduction
Iron is a dietary, essential trace mineral for dogs, largely due to its role in biochemical activities. Presently, there has been very little research completed regarding iron requirements of adult dogs. Two publications have presented estimates of iron requirements and suggest an iron intake of 1 mg/kg (BW)/day or 26.5 – 27.0 mg/kg diet on a dry matter basis (DMB) is adequate for adult dogs [1, 2]. In growing puppies there have been three key iron-related studies conducted; however, only one was an iron requirement study. Using ferrous sulfate heptahydrate (FeSO4 * 7H2O), Chausow and Czarnecki-Maulden estimated the iron requirement of growing puppies to be 81-84 mg/kg diet [3]. In a study of iron source bioavailability, Fly and Czarnecki-Maulden determined diets containing 20 mg/kg iron (ferrous sulfate) did not support normal hemoglobin levels in puppies [4]. Lastly, Fry and Kirk showed a diet containing 90 mg/kg iron (ferrous chloride) helped restore normal hemoglobin in puppies with iron deficiency anemia [5]. However, care should be taken when applying results from studies in puppies to adult dogs as these two life stages differ in their recommended allowance; NRC recommended allowances for puppies and adult dogs are 88 mg/kg and 30 mg/kg of iron on a DMB, respectively [6].
For a healthy population of animals, iron is largely provided by plant and animal ingredients, but can also be supplemented in organic and inorganic forms such as iron proteinate and ferrous sulfate, respectively. Iron is incorporated into many proteins/enzymes and is involved in oxygen transport and storage [7]. The majority of iron in the body exists in HGB of mature RBCs and erythroid precursors, with smaller amounts in myoglobin, enzymes, and cytochromes [8]. At the core of RBC oxygen transport is the HGB molecule, where heme iron can reversibly bind oxygen for transport [9]. Iron is required in large amounts for erythropoiesis (production of RBCs) and HGB synthesis; inadequate iron intake for RBC production in dogs results in smaller mature RBCs (microcytosis) and low HGB concentration (hypochromasia) [10, 11]. Over time, inadequate iron concentrations in the body will result in iron deficiency anemia. In puppies, feeding an iron deficient diet containing 0 mg/kg of iron on a DM basis induces iron deficiency anemia after 35 days of consumption [5]. The MCV of RBCs and MCHC can be used to assess iron deficiency, and although useful, these measures are insensitive [5]. Therefore, biochemical measures of stored iron have also been used. These include SI, ferritin, and TIBC. It should be noted, however, that these markers can be affected by inflammation, making these measures non-specific [12]. Recent interest has been focused on the sensitivity and specificity of reticulocytes in determining iron deficiency. Reticulocytes are a subpopulation of immature erythrocytes, present during the normal turnover of RBCs, and can represent the current state of erythropoiesis [5]. Since reticulocytes remain in circulation for only a few days, measures of their size and HGB concentrations are more sensitive and specific, making them better indicators of iron deficiency than other currently used assessments [5].
The most prevalent canine diets on the market are chicken based, with iron concentrations in chicken meat and by-products ranging from 3 - 90 mg/kg [13]. Vegetable and legume ingredients included in canine diets also naturally contain iron. For example, raw split peas contain 48 mg/kg of iron, while raw potatoes, sweet potatoes, and corn contain an average of 8.10 mg/kg, 6.10 mg/kg, and 5.2 mg/kg, respectively [13]. While not all sources of iron are equally available from commonly fed ingredients, these ingredients contribute to the overall iron concentration of the diet. Additionally, many diets are supplemented with iron, resulting in iron concentrations well above AAFCO minimum recommendations of 40 mg/kg on a DMB of iron for adult maintenance [14]. However, high inclusion of iron in diets can have detrimental effects on shelf life, palatability, and nutrient quality. Transition metals such as iron interact readily with oxygen and other free radicals due to their paramagnetic state, facilitating the reduction reaction/oxidation of compounds such as lipids, proteins, and sugars [15]. Lipid oxidation of food results in formation of peroxides, ketones, and aldehydes, reduced nutritional value, and changes in sensory properties of the food (e.g. odor and flavor) [16]. Furthermore, lipid oxidation of food is the main determining factor of shelf life, with oxidation occurring in raw materials as well as during processing, packaging, and storage of food [16]. Therefore, the ability to reduce supplemental iron will deliver a more stable food matrix at a lower cost to the manufacturers.
The purpose of this study was to evaluate differences in nutritional adequacy of diets with no supplemental iron, compared to those with supplemental iron (80 mg/kg, DMB) for adult dogs. Based on the information summarized, we hypothesized that diets containing either 0 mg/kg supplemental iron (total analyzed iron 128 mg/kg) or 80 mg/kg supplemental iron (total analyzed iron 178 mg/kg) would support normal hematological parameters in adult dogs.
Materials and Methods
The conditions set forth by the AAFCO [17] for proving nutritional adequacy were used as a design guideline for this study. This study was approved by the Procter & Gamble Pet Care Animal Care and Utilization Committee (AUP #012-9121).
I Selection of Study Population
Inclusion criteria required that dogs were an adult dog (≥1 year of age), in good health, and willing to consume dry food. Subjects were excluded if they showed any signs of iron deficiency anemia and/or they required any medication that may interfere with iron utilization. During the course of the study, dogs could be removed at the discretion of the attending veterinarian in consultation with the Sponsor Study Team for the following reasons: a medical condition, unrelated to dietary treatment, requiring intervention that would impact the study parameters; hematology results that, in the opinion of the veterinarian with the research team, lead to health risk for the dog; or a dog loses more than 15 % of its initial body weight as described in the AAFCO protocol for nutritional adequacy.
For the primary endpoints of HGB and packed cell volume (HCT), the criteria are defined in the AAFCO maintenance protocol. If the situation occurred that a dog had values for the primary endpoints at any of the time points that fell outside of the defined AAFCO parameters, then the following steps occurred: 1) a confirmatory blood sample was collected and sent to Colorado State University for analysis; 2) the frozen serum sample for that dog was sent immediately to Kansas State for secondary endpoint analysis; 3) the veterinarian did a physical examination; and 4) the clinical, technical, and veterinary leads, met to evaluate the data. If it was determined that indeed the animal showed clinical signs of iron deficiency anemia, then the animal would be immediately removed from the study and medical care administered. In addition, all animals on the same dietary treatment would be removed from the study, hence stopping the entire dietary treatment and ending the study.
II Study Design
This was a randomized, parallel design, 6-month study conducted at the P&G Pet Health and Nutrition Center (Lewisburg, Ohio). Dogs were provided with ad libitum water and pair housed within treatment group. Dogs had access to indoor and outdoor runs with indoor runs maintained on a 12 h light and dark cycle, in addition to natural light. Kennels were equipped with raised canvas beds, toys, and heated flooring. Outdoor runs provided enrichment with toys and play yard equipment. All dogs received 40 min of supervised group exercise and socialization, within their treatment group, in a separate fenced yard daily.
Twenty-two adult dogs, representing a mixture of breeds (small, medium, large), (3.6 ± 2 y, 16.4 ± 9.1 kg) were enrolled in the study to ensure a minimum of 8 per treatment group completing the study to meet AAFCO recommendations for feeding studies. Breed and gender of dogs were similar between the diet groups: Treatment group 1: female n = 5, male n = 6, with Bichon Frise n = 1, Brittany n = 3, Dachshund n = 2, German SH Pointer n = 1, Golden Retriever n = 2, Standard Poodle n = 1, Toy Poodle n = 1, Treatment group 2: female n = 5, male n = 6, with Bichon Frise n = 0, Brittany n = 3, Dachshund n = 1, German SH Pointer n = 2, Golden Retriever n = 2, Standard Poodle n = 2, Toy Poodle n = 1. Eligible dogs were randomly assigned to 1 of the following 2 diet groups (~11 dogs/diet group) in a randomized blocked design balanced by breed, age, and gender: Test Diet 1: Experimental Maintenance Formula with 115 mg/kg endogenous iron + 0 mg/kg supplemental iron (ferrous sulfate; total analyzed iron 128 mg/kg), Test Diet 2: Experimental Maintenance Formula with 115 mg/kg endogenous iron + 80 mg/kg supplemental iron (ferrous sulfate; total analyzed iron 178 mg/kg) (Table 1).
Table 1: Nutrient composition of test diets 1 and 2
|
Nutrient |
Test Diet 11 |
Test Diet 21 |
|
DM, g/kg |
906.1 |
913.1 |
|
Crude Protein, g/kg |
259.6 |
264.1 |
|
Crude Fat, g/kg |
166.1 |
169.8 |
|
Ash, g/kg |
67.8 |
67.9 |
|
Crude Fiber, g/kg |
23.7 |
24.9 |
|
Iron, ppm |
128 |
178 |
1Treatment Diet 1 = Experimental maintenance formula + 0 mg/kg supplemental iron; Treatment Diet 2 = Experimental maintenance formula + 80 mg/kg supplemental iron
The diets differed only in the level and/or source of iron. Veterinary personnel were blinded to the diets assigned to each dog. Diets were provided in plain brown 40-pound bags with colored labels and unique identification codes. All dogs underwent a 117-day washout period on an adult diet containing 0 mg/kg supplemental iron (test diet 1). All dogs assigned to the first treatment continued on test diet 1. The study included a 26-week feeding period in which all dogs were fed their randomly assigned study diet. All diets were identical in terms of nutrient content and made from identical ingredients, with the exception of the concentration of iron included in each diet. All diets utilized contained commercial ingredients/nutrients that are permitted by AAFCO and were considered complete and balanced. Diets were fed as the sole source of nutrition (no treats or other products were permitted) for 26 weeks. Each diet was provided twice daily in kibble form and contained in bags clearly marked with a color label and “Bill of Materials” code corresponding to the test formula included. Dogs were fed to maintain ideal body condition based on caloric intake.
III Sample Collection & Analysis
At baseline assessment (month 0), physical examination, inclusion/exclusion criteria, and randomization were conducted. Whole blood was collected using a vacutainer and jugular sampling at months 0, 2, 4 and 6. Serum samples for determination of select parameters of iron status were collected at months 0, 2, 4 and 6. Samples were analyzed at external clinical laboratories at the Department of Clinical Pathology at Colorado State University and Kansas State University’s Veterinary Diagnostic Laboratory (Table 2). For each dog, the month 2, 4, and 6 HGB and HCT values were assessed against the criteria specified by AAFCO [14] for PCV % (individual < 36, mean < 42) and HGB g/dL (individual < 12, mean < 14). Additionally, month 6 average HGB and HCT for each diet were assessed against the criteria specified by AAFCO for feeding trials.
For each dog, the percent change in body weight from baseline at months 2, 4, and 6 was calculated and assessed against the 15 % weight loss criteria specified by study protocol. Additionally, month 6 average weight loss for each diet was assessed against the 10 % weight loss criteria specified by AAFCO.
IV Statistical Analysis
Repeated measures analysis of covariance (RM ANCOVA) was used to compare the laboratory data from the two diet groups in SAS (v. 9.3, Cary, North Carolina). The RM ANCOVA model included fixed effects of diet, time, and diet x time interaction. In addition, the baseline value of the response variable was used as a covariate. The individual dog was considered a random effect. The laboratory measurements were regressed against iron intake on both an absolute scale (mg/day) and on a body weight basis (mg/kg BW0.75).
Results
I Exclusions
A 5-year-old, female Brittany, was excluded from the bioassay (RCM23147/ 11326906) due to inconsistencies in food amounts consumed, which led to an overall weight loss of greater than 15 % of total body weight. The dog had a history of inconsistent feeding behaviors, at times eating all of her food and other times leaving orts. The etiology for this behavior is not known. There was no evidence that the dog’s tendency to consume or reject test diets differed from her behavior during previous feeding experiences when fed other diets. All other dogs completed the study. This removal from the study, resulted in an n value of 10 rather than 11 for treatment 1.
II Demographic and Baseline Clinical Assessments
Breed and gender of dogs were similar between the diet groups (P >0.05). The mean age (P = 0.76), body condition score (P = 0.34), body weight (P = 0.42), and food intake (P = 0.41) values were not different between diet groups. The mean HCT (P = 0.62) and HGB (P = 0.43) measurements were similar between diet groups at baseline readings (Table 3). Aside from MCHC (P<0.05), means for other iron-related endpoints were not different between diet groups at baseline (P>0.05) (Table 3).
III Primary Clinical Assessments
Dietary treatment means and individual dog values were greater than the AAFCO specified criteria (Table 4) at all time points (Table 5). All dogs had HGB and HCT values ≥ 12 g/dL and ≥ 36% respectively, at month 0. The HCT values for 4 dogs at baseline, 5 dogs at month 2, and 1 dog at months 4 and 6 were higher than the reference range of 55%. Hemoglobin values for two dogs were above the reference range of 20 g/dL. Dietary treatment means for HCT and HGB were not different at months 2, 4, and 6 (P >0.05) (Table 5). Dietary treatment means for other iron-related endpoints were similar between groups at months 2, 4, and 6 (P >0.05) (Table 5).
Table 2: Clinical Laboratory Assessments of Blood Samples1
|
|
P&G Pet Care Analytical Laboratory |
Department of Clinical Pathology at Colorado State University |
Kansas State Vet Diagnostic Lab |
|
Primary Clinical Assessments |
|||
|
Hematology |
|
|
|
|
Complete Blood Count |
|
|
|
|
PCV (HCT) |
|
X |
|
|
HGB |
|
X |
|
|
CHr |
|
X |
|
|
MCHC |
|
X |
|
|
MCV |
|
X |
|
|
MCVr |
|
X |
|
|
RBC |
|
X |
|
|
WBC |
|
X |
|
|
Platelets |
|
X |
|
|
Reticulocytes |
|
X |
|
|
RDW |
|
X |
|
|
Iron |
|
|
X |
|
Ferritin |
|
|
X |
|
TIBC |
|
|
X |
|
Secondary Clinical Assessments |
|||
|
Differential White Blood Count |
|
|
|
|
Neutrophils |
|
X |
|
|
Lymphocytes |
|
X |
|
|
Monocytes |
|
X |
|
|
Eosinophils |
|
X |
|
|
Basophils |
|
X |
|
|
Leucocytes |
|
X |
|
|
Serum Chemistry |
|
|
|
|
A/G Ratio |
X |
|
|
|
Albumin (G/dl) |
X |
|
|
|
ALKP (U/L) |
X |
|
|
|
ALT (U/L) |
X |
|
|
|
AST (U/L) |
X |
|
|
|
B/C Ratio |
X |
|
|
|
BUN (Mg/dl) |
X |
|
|
|
Calcium (Mg/dl) |
X |
|
|
|
Chloride (Mmol/L) |
X |
|
|
|
Cholesterol (Mg/dl) |
X |
|
|
|
CK (U/L) |
X |
|
|
|
Creatinine (Mg/dl) |
X |
|
|
|
GGT (U/L) |
X |
|
|
|
Globulin (G/dl) |
X |
|
|
|
Glucose (Mg/dl) |
X |
|
|
|
LDH (U/L) |
X |
|
|
|
Magnesium (Meq/L) |
X |
|
|
|
Phosphorus (Mg/dl) |
X |
|
|
|
Potassium (Mmol/L) |
X |
|
|
|
Sodium (Mmol/L) |
X |
|
|
|
T Bili (Mg/dl) |
X |
|
|
|
T Protein (G/dL) |
X |
|
|
|
Triglycerides (Mg/dl) |
X |
|
|
|
Uric Acid (Mg/dl) |
X |
|
|
1 P&G = Procter and Gamble; PCV = Packed cell count; HCT = hematocrit; HGB = hemoglobin; CHr = reticulocyte hemoglobin content; MCHC = mean corpuscular hemoglobin concentration; MCV = mean corpuscular volume; MCVr = reticulocyte mean corpuscular volume; RBC = red blood cell; WBC = white blood cell; RDW = red cell distribution width; TIBC = total iron binding capacity; A/G = albumin/globulin; ALKP = alkaline phosphatase; ALT = alanine amino transferase; AST = aspartate transaminase; BUN = blood urea nitrogen; B/C = Bun to creatinine ratio; CK = creatine kinase; GGT = gamma-glutamyl transferase; LDH = lactate dehydrogenase; T Bili = total bilirubin; T protein = total protein
Table 3: Baseline Clinical Assessments for Complete Blood Count Iron Related Endpoints1
|
Parameter1 |
Treatment Diet 11, 2 n = 10 |
Treatment Diet 21, 2 n = 11 |
P-value |
Low Reference Value |
High Reference Value |
|
HCT |
51.8 ± 5.6 |
50.7 ± 4.2 |
0.6169 |
40 |
55 |
|
HGB |
17.8 ± 2.1 |
17.1 ± 1.4 |
0.4359 |
13 |
20 |
|
CHr |
25.8 ± 1.1 |
25.5 ± 0.8 |
0.4797 |
22.3 |
27.9 |
|
Ferritin |
236.6 ± 55.0 |
275.5 ± 127.6 |
0.3731 |
80 |
800 |
|
Iron |
225.4 ± 34.9 |
183.7 ± 60.7 |
0.0724 |
88 |
238 |
|
MCHC |
34.3 ± 0.6 |
33.8 ± 0.3 |
0.0460 |
33 |
36 |
|
MCV |
73.0 ± 3.1 |
72.7 ± 1.7 |
0.8321 |
62 |
73 |
|
MCVr |
86.4 ± 3.5 |
86.2 ± 3.5 |
0.9256 |
77.8 |
100.2 |
|
RBC |
7.1 ± 1.0 |
7.0 ± 0.6 |
0.6866 |
5.5 |
8.5 |
|
TIBC |
362.7 ± 26.4 |
342.5 ± 32.4 |
0.1353 |
246 |
450 |
|
Transferrin Saturation |
62.3 ± 9.7 |
53.0 ± 15.2 |
0.1145 |
25 |
52 |
1Treatment Diet 1 = Experimental maintenance formula + 0 mg/kg supplemental iron; Treatment Diet 2 = Experimental maintenance formula + 80 mg/kg supplemental iron; HCT = hematocrit; HGB = hemoglobin; CHr = reticulocyte hemoglobin content; MCHC = mean corpuscular hemoglobin concentration; MCV = mean corpuscular volume; MCVr = reticulocyte mean corpuscular volume; RBC = red blood cell; TIBC = total iron binding capacity;
2 Expressed as mean ± standard deviation
IV Secondary Clinical Assessments
Blood serum and differential white blood cell chemistry values at all time points were not different between diet treatments (P >0.10) and were within reference range for all parameters. Food intake (g/kg BW), body condition scores, and monthly mean stool scores were not different between diet treatments (P >0.05).

Figure 1: Hematocrit percentage in relation to primary clinical assessment time periods. Tables 3 and 5 contain standard deviations for all hematocrit measures
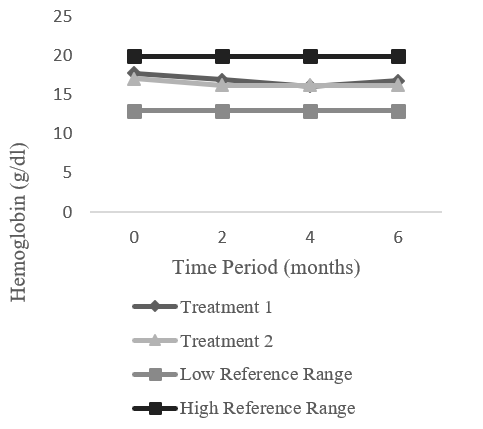
Figure 2: Hemoglobin (g/dL) in relation to primary clinical assessment time periods. Tables 3 and 5 contain standard deviations for all hemoglobin measures
Table 4: AAFCO (2018) Specified Diet Failure Criteria for Blood Cell Parameters
|
Parameter |
Individual |
Mean |
|
Packed Cell Volume (Hematocrit) (%) |
< 36 |
< 42 |
|
Hemoglobin (g/dL) |
< 12 |
< 14 |
Table 5: Primary Clinical Assessments for Complete Blood Count Iron Related Endpoints1
|
Parameter1 |
Time Period |
Treatment Diet 11, 2 n = 10 |
Treatment Diet 21, 2 n = 11 |
Diet Comparison P-value |
Low Reference Value |
High Reference Value |
|
HCT (%) |
Month 2 |
54.21 ± 1.10 |
52.19 ± 0.91 |
0.163 |
40 |
55 |
|
Month 4 |
51.23 ± 1.01 |
51.33 ± 0.77 |
0.938 |
|||
|
Month 6 |
51.19 ± 0.88 |
49.31 ± 1.06 |
0.187 |
|||
|
Overall |
52.21 ± 0.74 |
50.95 ± 0.59 |
0.203 |
|||
|
HGB (g/dL) |
Month 2 |
16.95 ± 0.34 |
16.26 ± 0.31 |
0.141 |
13 |
20 |
|
Month 4 |
16.15 ± 0.34 |
16.26 ± 0.27 |
0.811 |
|||
|
Month 6 |
16.83 ± 0.27 |
16.29 ± 0.37 |
0.262 |
|||
|
Overall |
16.64 ± 0.25 |
16.27 ± 0.24 |
0.306 |
|||
|
CHr (pg) |
Month 2 |
25.50 ± 0.15 |
25.33 ± 0.18 |
0.481 |
22.3 |
27.9 |
|
Month 4 |
25.23 ± 0.22 |
25.27 ± 0.14 |
0.866 |
|||
|
Month 6 |
25.35 ± 0.17 |
25.15 ± 0.18 |
0.426 |
|||
|
Overall |
25.36 ± 0.13 |
25.25 ± 0.13 |
0.566 |
|||
|
Ferritin (ng/mL) |
Month 2 |
286.65 ± 31.48 |
223.23 ± 19.78 |
0.096 |
80 |
800 |
|
Month 4 |
246.45 ± 24.36 |
229.68 ± 16.84 |
0.579 |
|||
|
Month 6 |
275.75 ± 30.56 |
245.14 ± 21.19 |
0.420 |
|||
|
Overall |
269.62 ± 23.69 |
232.68 ± 15.10 |
0.209 |
|||
|
Iron (ug/dL) |
Month 2 |
183.31 ± 18.01 |
210.54 ± 16.83 |
0.279 |
88 |
238 |
|
Month 4 |
212.01 ± 14.00 |
174.63 ± 14.01 |
0.079 |
|||
|
Month 6 |
208.41 ± 19.70 |
176.99 ± 15.59 |
0.228 |
|||
|
Overall |
201.24 ± 13.34 |
187.39 ± 10.79 |
0.448 |
|||
|
MCHC (g/dL) |
Month 2 |
31.23 ± 0.13 |
31.17 ± 0.19 |
0.800 |
33 |
36 |
|
Month 4 |
31.48 ± 0.15 |
31.84 ± 0.15 |
0.099 |
|||
|
Month 6 |
32.86 ± 0.15 |
33.05 ± 0.12 |
0.330 |
|||
|
Overall |
31.85 ± 0.09 |
32.02 ± 0.13 |
0.320 |
|||
|
MCV (fl) |
Month 2 |
76.06 ± 0.25 |
75.92 ± 0.26 |
0.697 |
62 |
73 |
|
Month 4 |
75.08 ± 0.33 |
75.20 ± 0.27 |
0.784 |
|||
|
Month 6 |
72.81 ± 0.27 |
72.43 ± 0.24 |
0.288 |
|||
|
Overall |
74.65 ± 0.23 |
74.51 ± 0.20 |
0.662 |
|||
|
MCVr (fl) |
Month 2 |
89.23 ± 0.64 |
87.93 ± 0.87 |
0.238 |
77.8 |
100.2 |
|
Month 4 |
86.85 ± 1.08 |
86.32 ± 0.84 |
0.696 |
|||
|
Month 6 |
83.68 ± 0.77 |
82.81 ± 0.70 |
0.401 |
|||
|
Overall |
86.59 ± 0.51 |
85.68 ± 0.59 |
0.262 |
|||
|
RBC (106/mL) |
Month 2 |
7.13 ± 0.16 |
6.89 ± 0.14 |
0.269 |
5.5 |
8.5 |
|
Month 4 |
6.80 ± 0.14 |
6.84 ± 0.11 |
0.819 |
|||
|
Month 6 |
7.03 ± 0.12 |
6.83 ± 0.16 |
0.336 |
|||
|
Overall |
6.99 ± 0.11 |
6.86 ± 0.10 |
0.398 |
|||
|
RDW (%) |
Month 2 |
12.36 ± 0.09 |
12.28 ± 0.09 |
0.523 |
12 |
15 |
|
Month 4 |
12.42 ± 0.09 |
12.31 ± 0.10 |
0.451 |
|||
|
Month 6 |
12.64 ± 0.09 |
12.59 ± 0.11 |
0.764 |
|||
|
Overall |
12.47 ± 0.07 |
12.39 ± 0.08 |
0.493 |
|||
|
TIBC (ug/dL) |
Month 2 |
339.05 ± 9.55 |
345.05 ± 9.29 |
0.664 |
246 |
450 |
|
Month 4 |
348.75 ± 10.31 |
354.86 ± 7.70 |
0.641 |
|||
|
Month 6 |
363.95 ± 10.97 |
358.05 ± 11.88 |
0.726 |
|||
|
Overall |
350.58 ± 8.61 |
352.65 ± 8.70 |
0.872 |
|||
|
Transferrin Saturation (%) |
Month 2 |
53.87 ± 5.16 |
61.93 ± 5.57 |
0.309 |
25 |
52 |
|
Month 4 |
60.84 ± 4.42 |
49.24 ± 4.54 |
0.088 |
|||
|
Month 6 |
56.81 ± 5.36 |
49.16 ± 4.52 |
0.290 |
|||
|
Overall |
57.17 ± 3.56 |
53.44 ± 3.67 |
0.497 |
1Treatment Diet 1 = Experimental maintenance formula + 0 mg/kg supplemental iron; Treatment Diet 2 = Experimental maintenance formula + 80 mg/kg supplemental iron; HCT = hematocrit; HGB = hemoglobin; CHr = reticulocyte hemoglobin content; MCHC = mean corpuscular hemoglobin concentration; MCV = mean corpuscular volume; MCVr = reticulocyte mean corpuscular volume; RBC = red blood cell; TIBC = total iron binding capacity; RDW = red cell distribution width. 2Expressed as mean ± standard deviation
Discussion
This study demonstrates that diets without supplemental iron, but exceeding the recommended minimum by AAFCO, result in no dietary iron deficiency signs in multiple breeds of adult dogs fed to weight maintenance. This conclusion is supported by the fact that HGB values for all dogs of both diet treatments at all time points were within the laboratory reference range of 13 – 20 g/dL and all values were above the AAFCO specified criteria. While there is a trend for dogs fed the un-supplemented treatment to have lower HGB at all time points compared with the baseline (Figure 1, 2), no individuals were below reference value at any time point. Had either diet been deficient in iron content, HGB concentration and RBC would decline.
Two-thirds of the body’s iron is found in circulating erythrocytes, with other minor iron stores in myoglobin, enzymes, and other proteins [8]. HGB concentration, which is the protein responsible of oxygen transport in RBCs, in combination with other hematological/biochemical indicators, is a useful means of determining the severity of anemia [9, 10]. Iron is an integral part of HGB, and HGB makes up over 95% of the protein in red cells. Thus, a gradual decline in the body’s iron content due to a loss of HGB and iron stores leads to iron deficiency anemia [10]. For the current study, any occurrence of anemia would be expected to be chronic due to prolonged theoretical inadequacy of the diet. HCT and RDW for study dogs were within laboratory reference ranges (Table 5), supporting the conclusion that no iron deficiency was present. HCT, or PCV, is the percent of volume of erythrocytes in the blood. Severity of anemia is based on hematocrit/hemoglobin levels in the blood, often through the evaluation of MCV and MCHC [18]. RDW, another measure of anemia, can be used to assess iron deficiency anemia in conjunction with MCV. When compared against different types of anemia, nutritional deficiencies (e.g., iron or folate) resulting in anemia also result in high RDW. Chronic iron deficient anemia will typically manifest as hypochromic (pale) blood and microcytic erythrocytes with high RDW [18, 19]. MHCH values for individual dogs were lower than expected, and decreased throughout the study compared to baseline values, with half the dogs from both treatment groups within the reference range and half below. An explanation for these results lies in the possibility that sample storage-related changes may have occurred since there was no relation to dietary treatment. Red cells tend to swell with storage, leading to an increase in the MCV and decrease of MCHC. This phenomenon occurs rapidly, typically within 24 hours of collection, especially if the blood samples are not kept cool until analysis [20]. Therefore, although there were values that were outside the reference range, none were considered to be clinically relevant. In the future, studies involving MCV and MCHC parameters should confirm that storage time and condition prior to analysis affect these values to support the conclusion that these results are not relevant. While clinics were provided with protocols for proper sample collection, they were not required to report their sample collection technique before analysis. Adding this step to future studies could provide support for this explanation.
Circulating iron (SI) is bound to and transported by the protein transferrin. Transferrin is measured indirectly by its TIBC. Percent or transferrin saturation is the ratio of serum iron concentrations to TIBC, with a saturation % of < 20 being indicative of iron deficiency [21]. Decreased SI and ferritin concentrations, normal or elevated TIBC, and low transferrin saturation can be associated with chronic iron deficient anemia [21]. However, these results can be confounded by other factors, such as inflammation, which may influence these values; thus, to be deemed iron deficiency anemia complete blood count must reveal microcytosis or hypochromasia [21]. While there is an assay to assess serum ferritin in dogs, there are no direct reports of its value in determining iron deficiency anemia [21]. All dogs in the present study remained healthy through the study with no signs of inflammation processes occurring. SI concentrations and ferritin values remained within laboratory reference ranges (Table 5) and suggests that sufficient body stores of iron were maintained throughout the study. Most dogs in the study had TSAT above reference ranges at all time points compared to laboratory references (Table 5) and the literature. There was no change in TSAT at month 6 compared to the baseline, and there was no evidence of a treatment specific difference. High TSAT values could point to iron overload, however, TIBC was not low as would be expected in such a case. Therefore, it is unlikely that an iron overload condition was present in the supplemental iron treatment group.
Fry and Kirk found that the magnitude of the differences between values, resulting from feeding an iron deficient diet, at day 0 and subsequent time points (up to 70 to 105 days later) was much greater for reticulocyte indices than for conventional indices [5]. As reticulocytes are in circulation only for 1-2 days, they reflect a more current condition of red blood cell production, and as such, their evaluation provides a more sensitive index of iron status. Fry and Kirk also found that when dogs were considered to have iron deficient anemia (based on study duration), TIBC and ferritin concentrations were still within laboratory reference values, whereas reticulocyte indices were below laboratory reference ranges suggesting iron deficiency anemia [5]. A study by Steinberg and Olver found that low CHr and low MCVr were associated with iron deficiency and were detectible earlier than some other hematological or biochemical indices [22]. Since these reticulocyte indices can be detected earlier than some other indices and CHr and MCVr were within laboratory reference ranges over the course of the study for all dogs, these findings also indicate that iron deficiency was not present.
In conclusion, both dietary treatments supported normal HGB and iron status in adult dogs over the course of the study. Common hematological and biochemical indices were used to assess iron status. Reticulocyte indices, which are now becoming more common practice, were also used to assess iron status and suggested normal iron status. Since no iron deficiency anemia was detected, these data support the nutritional adequacy of reduced supplemental and/or elimination of supplemental iron in diets that meet the minimum iron concentrations designed for adult dogs at maintenance.
Acknowledgements
John Burr, DVM for co-ordinating the clinical measurements. Cynthia Mayo for daily dog health care. Terri Sutton for daily animal husbandry and feeding. Joe DiGennaro for contributing to the statistical design and analyses of the study. C. G. Couto, College of Veterinary Medicine and Comprehensive Cancer Center, The Ohio State University for conversations regarding design of experiments to evaluate iron status and metabolism in the domestic dog.
Abbreviations
NRC, National research council
DMB, dry matter basis, HGB, hemoglobin
RBC, red blood cells
MCV, mean corpuscular volume
MCHC, mean corpuscular hemoglobin concentration
SI, serum iron
TIBC, total iron binding capacity
AAFCO, Association of American Feed Control Officials
HCT/PCV, packed cell volume
RDW, red cell distribution width
SH, short haired
TSAT, transferrin saturation
CHr, reticulocyte hemoglobin content
MCVr, reticulocyte mean corpuscular volume
Article Info
Article Type
Research ArticlePublication history
Received: Sun 05, May 2019Accepted: Fri 24, May 2019
Published: Fri 16, Aug 2019
Copyright
© 2023 Kathy Boebel. This is an open-access article distributed under the terms of the Creative Commons Attribution License, which permits unrestricted use, distribution, and reproduction in any medium, provided the original author and source are credited. Hosting by Science Repository.DOI: 10.31487/j.JFNM.2019.02.02
Author Info
Corresponding Author
Kathy BoebelMars Petcare, Franklin, Tennessee, USA
Figures & Tables
Table 1: Nutrient composition of test diets 1 and 2
|
Nutrient |
Test Diet 11 |
Test Diet 21 |
|
DM, g/kg |
906.1 |
913.1 |
|
Crude Protein, g/kg |
259.6 |
264.1 |
|
Crude Fat, g/kg |
166.1 |
169.8 |
|
Ash, g/kg |
67.8 |
67.9 |
|
Crude Fiber, g/kg |
23.7 |
24.9 |
|
Iron, ppm |
128 |
178 |
1Treatment Diet 1 = Experimental maintenance formula + 0 mg/kg supplemental iron; Treatment Diet 2 = Experimental maintenance formula + 80 mg/kg supplemental iron
Table 2: Clinical Laboratory Assessments of Blood Samples1
|
|
P&G Pet Care Analytical Laboratory |
Department of Clinical Pathology at Colorado State University |
Kansas State Vet Diagnostic Lab |
|
Primary Clinical Assessments |
|||
|
Hematology |
|
|
|
|
Complete Blood Count |
|
|
|
|
PCV (HCT) |
|
X |
|
|
HGB |
|
X |
|
|
CHr |
|
X |
|
|
MCHC |
|
X |
|
|
MCV |
|
X |
|
|
MCVr |
|
X |
|
|
RBC |
|
X |
|
|
WBC |
|
X |
|
|
Platelets |
|
X |
|
|
Reticulocytes |
|
X |
|
|
RDW |
|
X |
|
|
Iron |
|
|
X |
|
Ferritin |
|
|
X |
|
TIBC |
|
|
X |
|
Secondary Clinical Assessments |
|||
|
Differential White Blood Count |
|
|
|
|
Neutrophils |
|
X |
|
|
Lymphocytes |
|
X |
|
|
Monocytes |
|
X |
|
|
Eosinophils |
|
X |
|
|
Basophils |
|
X |
|
|
Leucocytes |
|
X |
|
|
Serum Chemistry |
|
|
|
|
A/G Ratio |
X |
|
|
|
Albumin (G/dl) |
X |
|
|
|
ALKP (U/L) |
X |
|
|
|
ALT (U/L) |
X |
|
|
|
AST (U/L) |
X |
|
|
|
B/C Ratio |
X |
|
|
|
BUN (Mg/dl) |
X |
|
|
|
Calcium (Mg/dl) |
X |
|
|
|
Chloride (Mmol/L) |
X |
|
|
|
Cholesterol (Mg/dl) |
X |
|
|
|
CK (U/L) |
X |
|
|
|
Creatinine (Mg/dl) |
X |
|
|
|
GGT (U/L) |
X |
|
|
|
Globulin (G/dl) |
X |
|
|
|
Glucose (Mg/dl) |
X |
|
|
|
LDH (U/L) |
X |
|
|
|
Magnesium (Meq/L) |
X |
|
|
|
Phosphorus (Mg/dl) |
X |
|
|
|
Potassium (Mmol/L) |
X |
|
|
|
Sodium (Mmol/L) |
X |
|
|
|
T Bili (Mg/dl) |
X |
|
|
|
T Protein (G/dL) |
X |
|
|
|
Triglycerides (Mg/dl) |
X |
|
|
|
Uric Acid (Mg/dl) |
X |
|
|
1 P&G = Procter and Gamble; PCV = Packed cell count; HCT = hematocrit; HGB = hemoglobin; CHr = reticulocyte hemoglobin content; MCHC = mean corpuscular hemoglobin concentration; MCV = mean corpuscular volume; MCVr = reticulocyte mean corpuscular volume; RBC = red blood cell; WBC = white blood cell; RDW = red cell distribution width; TIBC = total iron binding capacity; A/G = albumin/globulin; ALKP = alkaline phosphatase; ALT = alanine amino transferase; AST = aspartate transaminase; BUN = blood urea nitrogen; B/C = Bun to creatinine ratio; CK = creatine kinase; GGT = gamma-glutamyl transferase; LDH = lactate dehydrogenase; T Bili = total bilirubin; T protein = total protein
Table 3: Baseline Clinical Assessments for Complete Blood Count Iron Related Endpoints1
|
Parameter1 |
Treatment Diet 11, 2 n = 10 |
Treatment Diet 21, 2 n = 11 |
P-value |
Low Reference Value |
High Reference Value |
|
HCT |
51.8 ± 5.6 |
50.7 ± 4.2 |
0.6169 |
40 |
55 |
|
HGB |
17.8 ± 2.1 |
17.1 ± 1.4 |
0.4359 |
13 |
20 |
|
CHr |
25.8 ± 1.1 |
25.5 ± 0.8 |
0.4797 |
22.3 |
27.9 |
|
Ferritin |
236.6 ± 55.0 |
275.5 ± 127.6 |
0.3731 |
80 |
800 |
|
Iron |
225.4 ± 34.9 |
183.7 ± 60.7 |
0.0724 |
88 |
238 |
|
MCHC |
34.3 ± 0.6 |
33.8 ± 0.3 |
0.0460 |
33 |
36 |
|
MCV |
73.0 ± 3.1 |
72.7 ± 1.7 |
0.8321 |
62 |
73 |
|
MCVr |
86.4 ± 3.5 |
86.2 ± 3.5 |
0.9256 |
77.8 |
100.2 |
|
RBC |
7.1 ± 1.0 |
7.0 ± 0.6 |
0.6866 |
5.5 |
8.5 |
|
TIBC |
362.7 ± 26.4 |
342.5 ± 32.4 |
0.1353 |
246 |
450 |
|
Transferrin Saturation |
62.3 ± 9.7 |
53.0 ± 15.2 |
0.1145 |
25 |
52 |
1Treatment Diet 1 = Experimental maintenance formula + 0 mg/kg supplemental iron; Treatment Diet 2 = Experimental maintenance formula + 80 mg/kg supplemental iron; HCT = hematocrit; HGB = hemoglobin; CHr = reticulocyte hemoglobin content; MCHC = mean corpuscular hemoglobin concentration; MCV = mean corpuscular volume; MCVr = reticulocyte mean corpuscular volume; RBC = red blood cell; TIBC = total iron binding capacity;
2 Expressed as mean ± standard deviation
Table 4: AAFCO (2018) Specified Diet Failure Criteria for Blood Cell Parameters
|
Parameter |
Individual |
Mean |
|
Packed Cell Volume (Hematocrit) (%) |
< 36 |
< 42 |
|
Hemoglobin (g/dL) |
< 12 |
< 14 |
Table 5: Primary Clinical Assessments for Complete Blood Count Iron Related Endpoints1
|
Parameter1 |
Time Period |
Treatment Diet 11, 2 n = 10 |
Treatment Diet 21, 2 n = 11 |
Diet Comparison P-value |
Low Reference Value |
High Reference Value |
|
HCT (%) |
Month 2 |
54.21 ± 1.10 |
52.19 ± 0.91 |
0.163 |
40 |
55 |
|
Month 4 |
51.23 ± 1.01 |
51.33 ± 0.77 |
0.938 |
|||
|
Month 6 |
51.19 ± 0.88 |
49.31 ± 1.06 |
0.187 |
|||
|
Overall |
52.21 ± 0.74 |
50.95 ± 0.59 |
0.203 |
|||
|
HGB (g/dL) |
Month 2 |
16.95 ± 0.34 |
16.26 ± 0.31 |
0.141 |
13 |
20 |
|
Month 4 |
16.15 ± 0.34 |
16.26 ± 0.27 |
0.811 |
|||
|
Month 6 |
16.83 ± 0.27 |
16.29 ± 0.37 |
0.262 |
|||
|
Overall |
16.64 ± 0.25 |
16.27 ± 0.24 |
0.306 |
|||
|
CHr (pg) |
Month 2 |
25.50 ± 0.15 |
25.33 ± 0.18 |
0.481 |
22.3 |
27.9 |
|
Month 4 |
25.23 ± 0.22 |
25.27 ± 0.14 |
0.866 |
|||
|
Month 6 |
25.35 ± 0.17 |
25.15 ± 0.18 |
0.426 |
|||
|
Overall |
25.36 ± 0.13 |
25.25 ± 0.13 |
0.566 |
|||
|
Ferritin (ng/mL) |
Month 2 |
286.65 ± 31.48 |
223.23 ± 19.78 |
0.096 |
80 |
800 |
|
Month 4 |
246.45 ± 24.36 |
229.68 ± 16.84 |
0.579 |
|||
|
Month 6 |
275.75 ± 30.56 |
245.14 ± 21.19 |
0.420 |
|||
|
Overall |
269.62 ± 23.69 |
232.68 ± 15.10 |
0.209 |
|||
|
Iron (ug/dL) |
Month 2 |
183.31 ± 18.01 |
210.54 ± 16.83 |
0.279 |
88 |
238 |
|
Month 4 |
212.01 ± 14.00 |
174.63 ± 14.01 |
0.079 |
|||
|
Month 6 |
208.41 ± 19.70 |
176.99 ± 15.59 |
0.228 |
|||
|
Overall |
201.24 ± 13.34 |
187.39 ± 10.79 |
0.448 |
|||
|
MCHC (g/dL) |
Month 2 |
31.23 ± 0.13 |
31.17 ± 0.19 |
0.800 |
33 |
36 |
|
Month 4 |
31.48 ± 0.15 |
31.84 ± 0.15 |
0.099 |
|||
|
Month 6 |
32.86 ± 0.15 |
33.05 ± 0.12 |
0.330 |
|||
|
Overall |
31.85 ± 0.09 |
32.02 ± 0.13 |
0.320 |
|||
|
MCV (fl) |
Month 2 |
76.06 ± 0.25 |
75.92 ± 0.26 |
0.697 |
62 |
73 |
|
Month 4 |
75.08 ± 0.33 |
75.20 ± 0.27 |
0.784 |
|||
|
Month 6 |
72.81 ± 0.27 |
72.43 ± 0.24 |
0.288 |
|||
|
Overall |
74.65 ± 0.23 |
74.51 ± 0.20 |
0.662 |
|||
|
MCVr (fl) |
Month 2 |
89.23 ± 0.64 |
87.93 ± 0.87 |
0.238 |
77.8 |
100.2 |
|
Month 4 |
86.85 ± 1.08 |
86.32 ± 0.84 |
0.696 |
|||
|
Month 6 |
83.68 ± 0.77 |
82.81 ± 0.70 |
0.401 |
|||
|
Overall |
86.59 ± 0.51 |
85.68 ± 0.59 |
0.262 |
|||
|
RBC (106/mL) |
Month 2 |
7.13 ± 0.16 |
6.89 ± 0.14 |
0.269 |
5.5 |
8.5 |
|
Month 4 |
6.80 ± 0.14 |
6.84 ± 0.11 |
0.819 |
|||
|
Month 6 |
7.03 ± 0.12 |
6.83 ± 0.16 |
0.336 |
|||
|
Overall |
6.99 ± 0.11 |
6.86 ± 0.10 |
0.398 |
|||
|
RDW (%) |
Month 2 |
12.36 ± 0.09 |
12.28 ± 0.09 |
0.523 |
12 |
15 |
|
Month 4 |
12.42 ± 0.09 |
12.31 ± 0.10 |
0.451 |
|||
|
Month 6 |
12.64 ± 0.09 |
12.59 ± 0.11 |
0.764 |
|||
|
Overall |
12.47 ± 0.07 |
12.39 ± 0.08 |
0.493 |
|||
|
TIBC (ug/dL) |
Month 2 |
339.05 ± 9.55 |
345.05 ± 9.29 |
0.664 |
246 |
450 |
|
Month 4 |
348.75 ± 10.31 |
354.86 ± 7.70 |
0.641 |
|||
|
Month 6 |
363.95 ± 10.97 |
358.05 ± 11.88 |
0.726 |
|||
|
Overall |
350.58 ± 8.61 |
352.65 ± 8.70 |
0.872 |
|||
|
Transferrin Saturation (%) |
Month 2 |
53.87 ± 5.16 |
61.93 ± 5.57 |
0.309 |
25 |
52 |
|
Month 4 |
60.84 ± 4.42 |
49.24 ± 4.54 |
0.088 |
|||
|
Month 6 |
56.81 ± 5.36 |
49.16 ± 4.52 |
0.290 |
|||
|
Overall |
57.17 ± 3.56 |
53.44 ± 3.67 |
0.497 |
1Treatment Diet 1 = Experimental maintenance formula + 0 mg/kg supplemental iron; Treatment Diet 2 = Experimental maintenance formula + 80 mg/kg supplemental iron; HCT = hematocrit; HGB = hemoglobin; CHr = reticulocyte hemoglobin content; MCHC = mean corpuscular hemoglobin concentration; MCV = mean corpuscular volume; MCVr = reticulocyte mean corpuscular volume; RBC = red blood cell; TIBC = total iron binding capacity; RDW = red cell distribution width. 2Expressed as mean ± standard deviation
References
- Meyer H, Dammers C, Kienzle E (1985) Body composition of newborn puppies and the nutrient requirement of pregnant bitches. In Investigations on nutrient requirements in breeding bitches and suckling pups (ed. H Meyer) pp. 7-25. Advances in Animal Physiology and Animal Nutrition. Supplements to Journal of Animal Physiology and Animal Nutrition. Hamburg, Berlin: Verlag Paul Parey.
- Hill R. C, Burrows CF, Ellison GW, Bauer JE (2001) The effect of texturized vegetable protein from soy on nutrient digestibility compared to beef in cannulated dogs. J Anim Sci 79: 2162-2171. [Crossref]
- Chausow DG, Czarnecki-Maulden GL (1987) Estimation of the dietary iron requirement for the weanling puppy and kitten. J Nutr 117: 928-932. [Crossref]
- Fly AD, Czarnecki-Maulden GL (2000) Iron bioavailability from hemoglobin and hemin in chick, rat, cat, and dog: A comparative study. Nut Res 20: 237-248.
- Fry MM, Kirk CA (2006) Reticulocyte indices in a canine model of nutritional iron deficiency. Vet Clin Pathol 35: 172-181. [Crossref]
- National Research Council (2006) Nutrient Requirements of Dogs and Cats. Washington DC: The National Academies Press.
- Beard JL (2001) Iron biology in immune function, muscle metabolism and neuronal functioning. J Nutr 131: 568S-579S. [Crossref]
- McCown JL, Specht AJ (2011) Iron Homeostasis and Disorders in Dogs and Cats: A Review. J Am Anim Hosp Assoc 47: 151-160. [Crossref]
- Lalezari I, Lalezari P, Poyart C, Marden M, Kister J et al. (1990) New effectors of human hemoglobin: structure and function. Biochemistry 29: 1515-1523. [Crossref]
- Weiser G, O’Grady M (1983) Erythrocyte Volume Distribution Analysis and Hematologic Changes in Dogs with Iron Deficiency Anemia. Vet Pathol 20: 230-241. [Crossref]
- Hentze MW, Muckenthaler MU, Galy B, Camaschella C (2010) Two to tango: regulation of Mammalian iron metabolism. Cell 142: 24-38. [Crossref]
- Bainton DF, Finch CA (1964) The diagnosis of iron deficiency anemia. Am J Med 37: 62-70. [Crossref]
- USDA National Nutrient Database for Standard Reference, Release 28. Version Current: September 2015, slightly revised May 2016.
- Association of American Feed Control Officials, Inc. (AAFCO; 2018) AAFCO Dog and Cat Food Feeding Protocols. In: AAFCO Official Publication. Oxford.
- Kanner J (2010) 2-Metals and food oxidation, in: Decker, E.A. (Ed.), Oxidation in Foods and Beverages and Antioxidant Applications, Woodhead Publishing Series in Food Science, Technology and Nutrition, pp. 36-56.
- Jacobsen C (2010) Understanding and reducing oxidative flavour deterioration in foods. Oxidation in foods and beverages and antioxidant applications. Volume 1: Understanding mechanisms of oxidation and antioxidant activity, Woodhead Publishing Series in Food Science, Technology and Nutrition, pp. 122-142.
- Association of American Feed Control Officials, Inc. (AAFCO; 2012) AAFCO Dog and Cat Food Feeding Protocols. In: AAFCO Official Publication. Oxford.
- Johnson-Wimbley TD, Graham DY (2011) Diagnosis and management of iron deficiency anemia in the 21st century. Therap Adv Gastroenterol 4: 177-184. [Crossref]
- Bessman JD, Gilmer PR Jr, Gardner FH (1983) Improved classification of anemias by MCV and RDW. Am J Clin Pathol 80: 322-326. [Crossref]
- eClinPath | A Resource for Veterinary Clinical Pathology, n.d. eClinpath.
- Bohn AA (2015) Diagnosis of Disorders of Iron Metabolism in Dogs and Cats. Clin Lab Med 35: 579-590. [Crossref]
- Steinberg JD, Olver CS (2005) Hematologic and biochemical abnormalities indicating iron deficiency are associated with decreased reticulocyte hemoglobin content (CHr) and reticulocyte volume (rMCV) in dogs. Vet Clin Pathol 34: 23-27. [Crossref]