Comparison of Three Saliva Collection Methods to Assess Physiological Markers
A B S T R A C T
Background: To compare three saliva collection methods for examining salivary biomarkers in males and females at rest and exercise.
Methods: Whole saliva was collected using drool method (unstimulated, UWS), mastication (stimulated, SWS) or using cotton-buds placed around the mouth (unstimulated, Bud) from 8males and 12females. Samples were analysed for flow rate, osmolality, sodium, potassium, chloride, secretory salivary immunoglobulin A (SIgA), α-amylase activity and cortisol during both rest and exercise in a randomised crossover design.
Results: SWS and Bud methods were consistently more reliable than UWS, and Bud had the greatest reliability across all measures. Significant variations between all methods existed for total osmolality, sodium and SIgA concentrations; between UWS and SWS methods for flow rate and α-amylase activity, and between UWS and Bud methods for potassium. SWS most consistently replicated UWS patterns of analyte responses to exercise for both males and females and showed good agreement with UWS for cortisol. Both SWS and Bud data reflected the inverse α-amylase/cortisol relationship seen in UWS.
Conclusion: SWS was better able to replicate results measured from UWS, between rest and exercise and between males and females. SWS and Bud methods can be used to inform comparisons between rest and exercise and males and females.
Keywords
Electrolytes, immune, stimulated saliva, stress, unstimulated saliva
Introduction
Saliva is a rapidly developing medium in which to monitor a range of analytes for both clinical and research purposes. Blood sampling has routinely been used for these objectives, however the complex, expensive and invasive procedures involved may not always be suitable; analysis of other bodily fluids such as saliva may be a promising alternative [1]. Saliva has reduced complexity and generally requires less sample preparation for analysis than blood [2, 3]. Although saliva is a more dilute fluid than blood and the total concentrations of certain analytes are usually lower in saliva when compared with serum or plasma, other analytes are present at similar or greater concentrations. Generally, saliva analyte measurements are considered to reliably indicate their respective blood concentrations and reference tables have been constructed to this end [2, 3]. However, as mentioned, salivary analysis is an emerging area of exercise physiology and biochemistry and, although there are guidelines for some biomarkers, it is not common to use these in clinical settings [4, 5].
A number of saliva sampling protocols have been published for the collection of both unstimulated whole saliva (UWS) and stimulated whole saliva (SWS). UWS collected by the passive drool method is considered the ‘gold-standard’, as its best replicates baseline saliva production and composition from both the major and minor glands in the rested state [2, 3, 6]. In UWS the approximate percentage contributions from the different glands are 65% submandibular, 20% parotid, 5% sublingual and 10% from numerous minor glands [2]. In contrast, in stimulated saliva, greater than 50% is from the parotid gland and only 35% from the submandibular [2]. However, flow rate and therefore sample volume using the UWS method are low particularly in females due to their reduced gland size [2, 7]. Flow rate, which is also affected by dehydration, has a significant influence on salivary composition [2, 8, 9]. In comparison, SWS, collected mostly through mastication or gustatory stimulation, provides a much greater sample volume, although the stimulation dramatically alters the contributions from the different glands and thus its validity to the unstimulated state [2]. Saliva collection using the drool method is very difficult for exercising humans as flow rates can be extremely low and it can be problematic to perform the drool procedures [7]. The bud method has been used to collect unstimulated saliva when only small amounts are available (e.g. in animals) and thus holds promise for both reliable and valid saliva analysis.
There is substantial published data supporting the use of saliva as a source of biomarkers in research and diagnosis however, methodological differences between studies limit the ability for cross-comparison [2, 3, 10]. While a number of reviews have collated this information to provide overviews of sex and stress-specific salivary responses there are several inconsistencies, likely due to the effect of both flow rate and stimulation on salivary composition [2, 3, 8, 9]. Although it would be ideal to use the passive drool method in all studies and applications, this approach is not always feasible in the field and low flow rates, as well as sex-specific differences, may reduce reliability [2, 7, 11]. It is clear that an accurate comparison and statistical analysis of a wide range of analytes across the major saliva collection protocols is needed.
In a related paper we presented an in-depth analysis of unstimulated whole salivary markers of hydration, electrolyte status, immunity and stress in males and females, both at rest and during exercise, collected by the passive drool method [12]. In the current report, we combine this data with that from SWS, collected following masticatory stimulation, and saliva collected using the Bud method, during both rest and exercise in males and females. In this paper we aim to 1) provide a detailed comparison of these three modes of saliva collection and 2) make conclusions regarding the prediction and/or substitution potential of SWS and bud methods relative to UWS.
Materials and Methods
I Participants
Twenty healthy recreationally active participants (males n=8; females n=12; mean ages 27.9 ± 7.1 vs. 27.1 ± 5.2 years respectively; P=0.769) volunteered for the study. Males (1.77 ± 0.04 m; 81.1 ± 6.5 kg) were taller and heavier than females (1.66 ± 0.06 m; 62.8 ± 8.4 kg; P<0.001). All procedures had prior approval by the local institutional ethics committee. Following completion of a health screening questionnaire, written informed consent was obtained from all participants. In order to be considered for inclusion in this study participants were required to be free of injury, chronic disease and infection in the 4 weeks prior to the study.
II Preliminary Procedures
A preliminary session was used to familiarize participants to the experimental protocol as previously described [12]. In addition, upon arrival to the laboratory participants were shown the correct technique for saliva specimen collection for each of the UWS, SWS and bud collection methods. Each participant’s seat height, experimental exercise intensity and heart rate profile was recorded, and they were each provided a water bottle containing a volume of water equivalent to 7 mL·kg-1 of body mass.
III Main Trials
Participants performed either an exercising or resting protocol in a randomized cross-over design with the alternative protocol performed on their subsequent visit (3-7 days later). For the resting trial, participants sat quietly for 60 min whereas the exercising protocol involved 60 min of steady state cycling at 70% peak power achieved during an incremental test. Participants were asked to refrain from consuming caffeine and alcohol and avoid exercise in the 24-h period prior to the trial. They were also asked to replicate the same food and beverage intake prior to each trial and report to the laboratory 3 h post-prandial. Four hours prior to their arrival to the laboratory, participants were reminded to consume the 7 mL·kg-1 quantity of water provided by the researchers in the preliminary session. Upon arrival to the laboratory, a midstream urine sample was obtained for measurement of hydration status by urine specific gravity (USG) using a handheld refractometer (Sur-Ne, Atago Co Ltd, Japan).
Anthropometric measures of height (Seca portable stadiometer, Amtech, New Zealand) and weight (using digital scales; AND Weighing Hv 200-KGL, Australia) were also recorded. Saliva was collected via each of the three methods, in the order of UWS, Bud and SWS, at two times (15-30 min [T1] and 45-60 min ([T2]) during each protocol. Issues addressed by Hayes et al. surrounding study design, sample acquisition and biological variation, technical and analytical error have been well considered during the formulation of our study design, participant information sheets and in our reporting of study outcomes [4]. Both trials were conducted at the same time of day (3-6pm) to overcome any circadian influences. Heart rate was measured continuously during exercise (Polar Electro S6101, Kempele, Finland).
IV Saliva Collection Methods
i Unstimulated Whole Saliva (UWS) and Stimulated Whole Saliva (SWS)
Unstimulated whole saliva was collected as previously described [12]. For collection of SWS participants were provided sterile paraffin wax to chew (60 chews per minute, timed using a metronome). For both methods, saliva was collected into a disposable 60 mL plastic container for 2 min. If less than 1 mL was collected after this time, a further minute of collection was performed, ensuring a minimum collection volume of 1 mL.
ii Bud Method (Bud)
Participants were provided with three sterile cotton buds (‘Q-tip’) to place into their mouth between the cheek and molars (both sides) as well as under the tongue (Figure 1). After 2 min, the heads of the cotton buds were placed into a sterile container for saliva recovery by centrifugation (1500x g for 10 min). If the bud appeared dry participants were asked to repeat the procedure for a further minute. All saliva specimens were stored upright at -80°C until analysis.
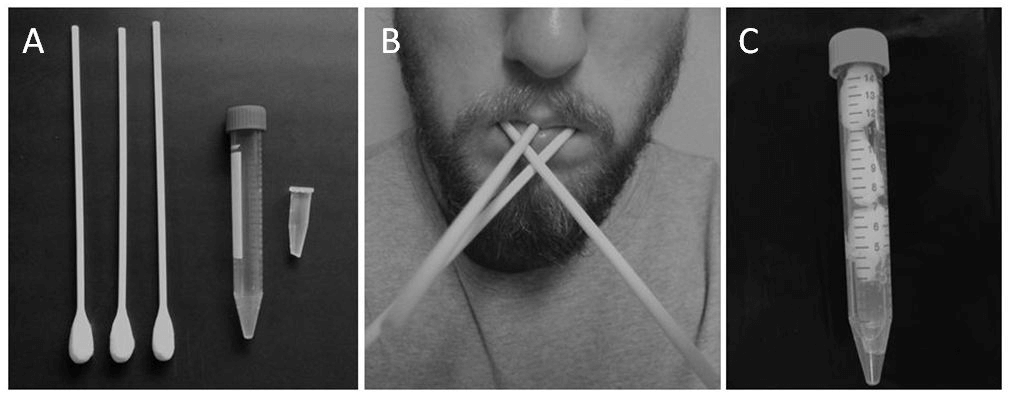
Figure 1: Equipment and procedures for Bud method. A) three cotton buds, large and small collection tubes - please note that the tip of the small tube has been cut; B) participant with cotton buds placed inside mouth - one placed inside either cheek and one under the tongue; C) the cut small tube placed inside large tube, followed by the cotton bud heads - once centrifuged the saliva sample will collect at the bottom of the large tube ready for transfer to another small tube for storage.
iii Determination of Flow Rate
Volume of saliva collected (UWS and SWS only) was determined by calculation of the difference between the weight (± 1 mg) of the saliva collection container before and after sampling, where 1 mL is equivalent to 1g. Flow rate was determined by dividing the volume of saliva collected by the time taken for the collection.
V Saliva Analysis
Saliva osmolality was measured using a freezing point depression osmometer (Osmomat 030, Gonotec, Berlin, Germany). Salivary electrolyte levels were measured using an EasyLyte analyser (Medica Corporation, Bedford, MA, USA). Salivary secretory IgA (SIgA) concentration was determined by enzyme-linked immunosorbent assay (ELISA) as described elsewhere [13]. Salivary cortisol concentration was determined by radioimmunoassay according to the manufacturer’s instructions (IBL International GMBH, Tecan, Hamburg, Germany, IBMG1206). Salivary α-amylase activity was determined using the Infinity Amylase Liquid stable reagent (Thermoscientific, Worthing, UK) according to the manufacturer’s instructions. IgA and amylase were analysed in triplicate, cortisol was analysed in duplicate (in an IANZ accredited lab), electrolytes and osmolality were singles or duplicates if they appeared out of the ordinary. Inter and intra assay CVs were less than 5% for all assays.
VI Statistical Analysis
Differences in physiological characteristics between groups were determined using paired Student’s t-tests. Student’s t-tests were also used to assess differences between trials (paired) and between saliva sampling methods (independent). Reliability between sets of scores was assessed using Pearson’s correlation (r) and intra-class correlation coefficients (ICC), with the ‘two-way random’ method selected for ICC calculation, using SPSS (version 21.0) [14]. The standard error of measurement (SEM) was also used to assess test-retest reliability (resting measures only). The most common method is SEM = SD√1-ICC [14]. Since SEM covers only 68% of the population (1 SD), to make it applicable to 95% of the population (i.e. 1.96 SD), the 95% confidence intervals (95% CI) were calculated by multiplying the SEM by two. The coefficient of variation (CV) was used to assess reliability of scores using the method of [15]. The ‘95% absolute levels of agreement’ (LOA), as proposed by Bland and Altman, was the final method of assessing repeatability and agreement [16].
To compare the measurements by taking into account heteroscedastic errors via dimensionless ratios, the ‘ratio limits of agreement’ (RLOA), using log-transformed measurements, were used as well. The results are presented as mean values ± standard deviation. Statistical significance was accepted at P<0.05. Bland-Altman analysis was also used to determine the agreement between each pair of points from either SWS or Bud data, to UWS data. For each pair of points, the UWS value was subtracted from the corresponding SWS, or Bud, value, and the mean of all differences was obtained (d ̅), as well as the standard deviation (s), standard error (SE), and LOA (±1.96s) associated with this difference.
Results
I Reliability
Resting trial data from saliva samples collected using each of the three methods at time 1 (T1) and time 2 (T2) as well as test-retest reliability indices for these measures are shown in (Table 1). Flow rate data for the Bud method was not available. Flow rate for UWS increased from T1 to T2 in females (21%; P=0.010) but remained consistent for SWS, although the (SWS) flow rates for females had a low correlation coefficient (r=0.290). All other indices of reliability were comparable between the saliva collection methods. Osmolality reliability measurements were comparable across all methods. However, females showed a lower correlation coefficient for SWS (r=0.440). For Na measurements, UWS correlation coefficients were low (r≤0.510), CV was greater than 40% and RLOA was greater than 100%. The Bud method produced moderate to high correlation coefficients for Na (r=0.580 to 0.783), CV levels of 24-25% and random errors of between 54-60%. SWS data showed high correlations (r≥0.900), CVs of 19-26% and random errors of 61-64% (according to RLOA values). All other indices of reliability for Na were comparable between the saliva collection methods.
There was a trend for an increase in K measurements over time in UWS sampling of females (9%; P=0.06; r=0.747). Correlations for K in males by UWS sampling were low (r= 0.240). Of the three methods, UWS gave the highest CV values (19-32%) and both systematic (up to 11%) and random (43-73%) error. SWS had the lowest CV values (6-8%) and random error (10-16%) with Bud CV and random error data falling between the other two methods (11-18% and 20-52% respectively). All other reliability indices for K were comparable between the methods. Cl reliability data was largely comparable across all methods.
Table 1: Levels of salivary analytes and reliability indices between measures taken at rest for UWS, SWS and Bud saliva collection methods for male and female cohorts. Flow rate data was not available for the Bud method. Saliva was collected at two intervals 30 min apart (T1 and T2). Due to the staggered nature of sampling for each method, these intervals are: UWS, 15 and 45 min; SWS, 25 and 55 min; and Bud, 20 and 50 min. A significant % difference between measures is indicated with an asterisk (**, P<0.001; *, P<0.05) and a trend for a difference with a superscript hash (#, 0.1<P>0.05). For PCC measures, a moderate strength relationship (*) is defined as a coefficient ≥0.5 and a strong relationship (**) as a coefficient ≥ 0.7. For LOA and RLOA, error is shown in brackets (+/- and x/÷, respectively).
|
|
Rest T1 |
Rest T2 |
% Difference |
Paired t-test |
r |
CV |
ICC |
SEM |
95% CI |
LOA (Mean bias ±2SD) |
RLOA (Mean bias x/÷2SD) |
|
|
Flow Rate (g·min-1) |
||||||||||||
|
UWS |
Males |
0.64 (0.47) |
0.72 (0.57) |
8.9 |
0.176 |
0.970** |
24.2 |
0.97 |
0.09 |
0.18 |
0.09 ± 0.32 |
1.09 x/÷ 1.70 |
|
Females |
0.34 (0.13) |
0.40 (0.12) |
21.3 |
0.010* |
0.860** |
17.8 |
0.88 |
0.04 |
0.09 |
0.06 ± 0.13 |
1.22 x/÷ 1.90 |
|
|
SWS |
Males |
2.83 (1.91) |
3.02 (1.77) |
6.1 |
0.313 |
0.970** |
16.4 |
0.98 |
0.26 |
0.52 |
0.18 ± 0.94 |
1.06 x/÷ 1.52 |
|
Females |
1.71 (0.48) |
1.48 (0.28) |
12.1 |
0.133 |
0.29 |
30.2 |
0.37 |
0.25 |
0.49 |
-0.23 ± 0.95 |
0.88 x/÷ 1.74 |
|
|
Osmolality (mOsmol·kg-1) |
||||||||||||
|
UWS |
Males |
65.4 (15.8) |
65.9 (18.7) |
0.3 |
0.85 |
0.926** |
11 |
0.96 |
3.38 |
6.77 |
0.50 ± 14.17 |
1.00 x/÷ 1.18 |
|
Females |
57.3 (15.1) |
56.0 (11.8) |
0.2 |
0.65 |
0.788** |
16.4 |
0.87 |
4.52 |
9.03 |
-1.25 ± 18.20 |
0.99 x/÷ 1.35 |
|
|
SWS |
Males |
96.1 (24.7) |
94.8 (24.5) |
1.9 |
0.63 |
0.954** |
8 |
0.98 |
3.68 |
7.36 |
-1.38 ± 14.96 |
0.98 x/÷ 1.18 |
|
Females |
75.8 (12.6) |
75.6 (13.8) |
0.6 |
0.97 |
0.44 |
18.5 |
0.63 |
6.79 |
13.59 |
-0.17 ± 27.37 |
0.99 x/÷ 1.45 |
|
|
Bud |
Males |
76.4 (13.7) |
75.9 (18.1) |
1.4 |
0.91 |
0.753** |
15.6 |
0.86 |
5.63 |
11.27 |
-0.50 ± 23.33 |
0.99 x/÷ 1.34 |
|
|
Females |
72.7 (20.6) |
70.7 (15.4) |
1.8 |
0.65 |
0.728** |
19.7 |
0.83 |
6.85 |
13.7 |
-2.00 ± 27.65 |
0.98 x/÷ 1.39 |
|
Na (mmol·L-1) |
||||||||||||
|
UWS |
Males |
4.53 (2.15) |
5.10 (1.85) |
28.3 |
0.451 |
0.51 |
41.3 |
0.68 |
0.98 |
1.96 |
0.56 ± 3.90 |
1.18 x/÷ 2.22 |
|
Females |
6.37 (3.15) |
5.00 (1.31) |
11 |
0.136 |
0.46 |
49.4 |
0.45 |
1.45 |
2.9 |
-1.37 ± 5.51 |
0.82 x/÷ 2.07 |
|
|
SWS |
Males |
18.6 (11.3) |
19.0 (11.7) |
0.7 |
0.85 |
0.909** |
26.2 |
0.96 |
2.32 |
4.65 |
0.35 ± 9.63 |
0.99 x/÷ 1.64 |
|
Females |
14.8 (6.12) |
13.7 (6.85) |
13.5 |
0.18 |
0.915** |
19.4 |
0.95 |
1.43 |
2.87 |
-1.14 ± 5.42 |
0.86 x/÷ 1.61 |
|
|
Bud |
Males |
13.0 (3.54) |
12.0 (2.92) |
7 |
0.37 |
0.580* |
24.1 |
0.74 |
1.47 |
2.95 |
-1.03 ± 5.90 |
0.93 x/÷ 1.60 |
|
Females |
11.0 (4.23) |
11.0 (4.22) |
0.3 |
0.98 |
0.783** |
25.3 |
0.89 |
1.33 |
2.67 |
-0.02 ± 5.45 |
1.00 x/÷ 1.54 |
|
|
K (mmol·L-1) |
||||||||||||
|
UWS |
Males |
19.7 (4.11) |
21.3 (6.15) |
10.6 |
0.528 |
0.24 |
31.9 |
0.38 |
3.22 |
6.43 |
1.54 ± 12.83 |
1.06 x/÷ 1.73 |
|
Females |
21.9 (5.99) |
19.5 (4.81) |
9.3 |
0.060# |
0.747** |
19.3 |
0.81 |
2.21 |
4.41 |
-2.41 ± 7.82 |
0.89 x/÷ 1.43 |
|
|
SWS |
Males |
21.1 (4.34) |
21.5 (5.44) |
1.1 |
0.39 |
0.992** |
6 |
0.98 |
0.64 |
1.27 |
0.41 ± 2.51 |
1.01 x/÷ 1.10 |
|
Females |
21.7 (3.71) |
21.1 (3.46) |
2.8 |
0.24 |
0.897** |
7.8 |
0.94 |
0.84 |
1.68 |
-0.60 ± 3.26 |
0.97 x/÷ 1.16 |
|
|
Bud |
Males |
19.2 (3.29) |
19.0 (4.35) |
1.8 |
0.81 |
0.865** |
11.7 |
0.92 |
1.06 |
2.11 |
-0.20 ± 4.36 |
0.98 x/÷ 1.20 |
|
Females |
18.9 (3.25) |
18.2 (5.00) |
6 |
0.49 |
0.738** |
18.4 |
0.81 |
1.68 |
3.35 |
-0.74 ± 6.70 |
0.94 x/÷ 1.52 |
|
|
Cl (mmol·L-1) |
||||||||||||
|
UWS |
Males |
32.6 (13.2) |
35.9 (20.4) |
13.8 |
0.634 |
0.47 |
53.8 |
0.62 |
8.94 |
17.88 |
3.24 ± 36.1 |
1.04 x/÷ 2.25 |
|
Females |
49.6 (27.2) |
43.1 (23.3) |
9.7 |
0.193 |
0.806** |
34.9 |
0.88 |
8.36 |
16.72 |
-6.48 ± 31.7 |
0.86 x/÷ 1.76 |
|
|
SWS |
Males |
34.3 (10.9) |
36.6 (15.7) |
3.5 |
0.36 |
0.943** |
18.5 |
0.94 |
3.27 |
6.53 |
2.25 ± 12.9 |
1.04 x/÷ 1.34 |
|
Females |
38.4 (17.0) |
35.4 (13.2) |
7.3 |
0.14 |
0.936** |
17.7 |
0.95 |
3.45 |
6.9 |
-3.03 ± 12.8 |
0.93 x/÷ 1.34 |
|
|
Bud |
Males |
32.3 (13.1) |
30.5 (18.4) |
9.5 |
0.6 |
0.883** |
29.3 |
0.92 |
4.41 |
8.81 |
-1.78 ± 18.0 |
0.90 x/÷ 1.60 |
|
|
Females |
47.3 (27.9) |
45.6 (27.5) |
5.2 |
0.47 |
0.967** |
15.3 |
0.98 |
3.48 |
6.95 |
-1.63 ± 14.0 |
0.95 x/÷ 1.44 |
|
sIgA (mg·L-1) |
||||||||||||
|
UWS |
Males |
65.7 (42.2) |
66.8 (52.0) |
3.5 |
0.895 |
0.900** |
34.9 |
0.94 |
10.86 |
21.72 |
1.12 ± 45.3 |
0.91 x/÷ 2.08 |
|
Females |
86.4 (49.0) |
60.2 (35.8) |
8.3 |
0.12 |
0.21 |
61.9 |
0.56 |
24.06 |
48.12 |
-26.2 ± 88.9 |
0.71 x/÷ 5.05 |
|
|
SWS |
Males |
29.8 (15.5) |
31.0 (23.3) |
10.3 |
0.71 |
0.960** |
31 |
0.95 |
4.46 |
8.92 |
1.27 ± 18.5 |
0.89 x/÷ 1.96 |
|
Females |
28.3 (17.5) |
22.8 (8.8) |
14.9 |
0.24 |
0.709** |
50.4 |
0.71 |
6.59 |
13.18 |
-5.49 ± 25.2 |
0.85 x/÷ 2.06 |
|
|
Bud |
Males |
34.6 (18.7) |
36.1 (23.5) |
1 |
0.79 |
0.772** |
42.3 |
0.87 |
7.08 |
14.16 |
1.45 ± 29.3 |
1.01 x/÷ 2.15 |
|
Females |
31.2 (28.7) |
29.0 (13.5) |
15.5 |
0.76 |
0.745** |
68.7 |
0.75 |
9.93 |
19.86 |
-2.21 ± 40.5 |
1.17 x/÷ 2.95 |
|
|
α-amylase activity (U·mL-1) |
||||||||||||
|
UWS |
Males |
34.6 (20.4) |
38.2 (22.1) |
12.3 |
0.050* |
0.983** |
11.7 |
0.98 |
26.75 |
53.51 |
36.4 ± 83.2 |
1.11 x/÷ 1.25 |
|
Females |
25.7 (23.5) |
29.5 (24.9) |
22.4 |
0.030* |
0.983** |
15.6 |
0.99 |
26.71 |
53.43 |
35.8 ± 83.8 |
1.18 x/÷ 1.46 |
|
|
SWS |
Males |
49.9 (18.3) |
48.7 (18.3) |
2.8 |
0.76 |
0.821** |
22.2 |
0.91 |
51.75 |
103.49 |
-12.4 ± 214.4 |
0.97 x/÷ 1.48 |
|
Females |
37.4 (20.5) |
39.3 (22.0) |
4.6 |
0.24 |
0.971** |
13.2 |
0.98 |
25.99 |
51.99 |
18.9 ± 96.0 |
1.05 x/÷ 1.35 |
|
|
Bud |
Males |
38.2 (15.9) |
40.7 (17.9) |
4.6 |
0.54 |
0.798** |
27.6 |
0.89 |
52.55 |
52.55 |
24.8 ± 213.1 |
1.05 x/÷ 1.82 |
|
Females |
32.6 (25.3) |
28.5 (23.3) |
7.4 |
0.15 |
0.931** |
28.3 |
0.96 |
45.12 |
90.24 |
-39.5 ± 67.4 |
0.92 x/÷ 1.96 |
|
|
Cortisol (nmol·L-1) |
||||||||||||
|
UWS |
Males |
4.21 (0.73) |
4.02 (0.48) |
3.7 |
0.21 |
0.893** |
8.9 |
0.89 |
0.19 |
0.39 |
-0.20 ± 0.72 |
0.96 x/÷ 1.18 |
|
Females |
5.95 (2.26) |
5.26 (2.16) |
11.4 |
0.003* |
0.960** |
11.3 |
0.96 |
0.45 |
0.9 |
-0.68 ± 1.24 |
0.88 x/÷ 1.20 |
|
|
SWS |
Males |
5.27 (2.87) |
5.43 (4.19) |
4.1 |
0.76 |
0.991** |
26.1 |
0.97 |
0.66 |
1.32 |
0.16 ± 2.74 |
0.96 x/÷ 1.40 |
|
Females |
6.33 (2.40) |
5.16 (1.73) |
20.2 |
0.030* |
0.749** |
27.7 |
0.77 |
0.93 |
1.85 |
-1.17 ± 3.12 |
0.79 x/÷ 1.85 |
|
|
Bud |
Males |
5.21 (2.69) |
4.80 (1.63) |
4.3 |
0.35 |
0.974** |
23.4 |
0.93 |
0.58 |
1.17 |
-0.41 ± 2.29 |
0.96 x/÷ 1.33 |
|
|
Females |
4.80 (2.18) |
4.47 (1.76) |
4.2 |
0.18 |
0.955** |
15.5 |
0.96 |
0.38 |
0.76 |
-0.33 ± 1.41 |
0.96 x/÷ 1.39 |
PCC: Pearson’s Correlation Coefficient; CV: coefficient of variation; ICC: Intra-class Correlation Coefficient; SEM: Standard Error of the Mean; 95% CI: 95% Confidence Interval; LOA: Limits of Agreement; RLOA: Ratio Limits of Agreement.
Table 2: Agreement and association between the SWS or Bud method compared to the UWS passive drool method for flow rate (g·min-1), osmolality (mOsmol·kg-1), Na (mmol·L-1), K (mmol·L-1), Cl (mmol·L-1), sIgA (mg·L-1), α-amylase activity (U∙mL-1) and cortisol (nmol·L-1). Total participant data was used for analysis. Absolute Bland-Altman data shows the mean difference (d) of either SWS or Bud data from UWS data when pairs of points are compared, as well as the standard error (SE), 1.96 standard deviations (1.96∙s) and 95% limits of agreement (LOA) associated with this difference. Ratio limits of agreement (RLOA) were determined using natural log-transformed data. The correlation coefficient (r) and P-value for the association between SWS or Bud and UWS is shown alongside each set of Bland-Altman values.
|
Bland-Altman Analysis |
|
Linear Regression |
||||||||||||
|
|
|
Absolute LOA |
|
Ratio LOA |
|
|
|
|||||||
|
d (SE) |
1.96∙s |
LOA (95%) |
|
d (SE) |
Mean bias (1+ d) |
1.96∙s (antilog) |
LOA (95%) |
|
r |
P |
||||
|
|
|
lower |
upper |
|
lower |
upper |
|
|||||||
|
Flow Rate (g∙min-1) |
|
|
||||||||||||
|
SWS |
1.6 (0.2) |
2 |
-0.4 |
3.6 |
|
1.5 (0.07) |
2.5 |
2.5 |
0.6 |
2.4 |
|
0.791 |
0.001* |
|
|
Osmolality(mOsmol∙kg-1) |
|
|
||||||||||||
|
SWS |
20.6 (2.3) |
40.2 |
-19.5 |
60.7 |
|
0.3 (0.03) |
1.3 |
1.6 |
-0.2 |
0.8 |
|
0.482 |
0.031* |
|
|
Bud |
17.6 (2.0) |
33.7 |
-16.0 |
51.3 |
|
0.24 (0.02) |
1.2 |
1.5 |
-0.2 |
0.7 |
|
0.688 |
<0.001** |
|
|
Na(mmol∙L-1) |
|
|
||||||||||||
|
SWS |
10.1 (1.1) |
17.8 |
-7.6 |
27.9 |
|
1.0 (0.07) |
2.0 |
3.3 |
-0.2 |
2.2 |
|
0.094 |
0.694 |
|
|
Bud |
7.8 (0.6) |
10.2 |
-2.3 |
17.9 |
|
0.9 (0.02) |
1.9 |
2.9 |
-0.2 |
2.0 |
|
0.115 |
0.631 |
|
|
K (mmol∙L-1) |
|
|
||||||||||||
|
SWS |
0.8 (0.4) |
6.7 |
-5.8 |
7.4 |
|
0.1 (0.02) |
1.1 |
1.3 |
-0.2 |
0.3 |
|
0.777 |
<0.001** |
|
|
Bud |
-1.3 (0.5) |
8.2 |
-9.6 |
6.9 |
|
-0.1 (0.02) |
0.9 |
1.5 |
-0.4 |
0.3 |
|
0.672 |
0.001* |
|
|
Cl (mmol∙L-1) |
|
|
||||||||||||
|
SWS |
-3.5 (1.7) |
29.2 |
-32.7 |
25.8 |
|
-0.03 (0.04) |
1.0 |
2.0 |
-0.7 |
0.7 |
|
0.684 |
<0.001** |
|
|
Bud |
-0.7 (2.0) |
32.7 |
-33.4 |
31.9 |
|
-0.04 (0.05) |
1.0 |
2.1 |
-0.8 |
0.7 |
|
0.719 |
<0.001** |
|
|
sIgA (mg∙L-1) |
|
|
||||||||||||
|
SWS |
-48.2 (7.1) |
117.4 |
-165.7 |
69.3 |
|
-0.9 (0.08) |
0.1 |
3.6 |
-2.2 |
0.4 |
|
0.469 |
0.037* |
|
|
Bud |
-39.5 (7.0) |
116.6 |
-156.1 |
77.0 |
|
-0.7 (0.08) |
0.3 |
3.9 |
-2.1 |
0.7 |
|
0.435 |
0.055# |
|
|
α-amylase activity (U∙mL-1) |
|
|
||||||||||||
|
SWS |
10.3 (1.1) |
19.4 |
-9.1 |
29.7 |
|
0.3 (0.04) |
1.3 |
1.9 |
-0.3 |
1.0 |
|
0.908 |
<0.001** |
|
|
Bud |
1.7 (1.4) |
25.7 |
-24.0 |
27.4 |
|
0.05 (0.05) |
1.1 |
2.3 |
-0.8 |
0.9 |
|
0.851 |
<0.001** |
|
|
Cortisol (nmol∙L-1) |
|
|
||||||||||||
|
SWS |
0.1 (0.1) |
2.2 |
-2.0 |
2.2 |
|
0.01 (0.02) |
1.0 |
1.4 |
-0.3 |
0.4 |
|
0.868 |
<0.001** |
|
|
|
Bud |
-0.3 (0.2) |
2.7 |
-3.1 |
2.5 |
|
-0.1 (0.05) |
0.9 |
2.1 |
-0.9 |
0.6 |
|
0.395 |
0.085# |
However, males produced a low correlation coefficient for UWS (r=0.470) and CV values were high (35-54%). Furthermore, both systematic (up to 14%) and random (67-125%) errors were high for the UWS collection method. SWS and Bud collection methods gave comparable data across all reliability indices for Cl and had lower CV (up to 19% and 29%, respectively), systematic error (3-5%) and random error (34-36% and 44-60%) values than the UWS collection method.
Reliability data for SIgA measurements varied across all collection methods. All methods gave high values for CV (31-69%) and high random error (from 96% to over 200%). However, both systematic (up to 20%) and random (up to 405%) error was highest for UWS. Alpha-amylase activity in UWS increased significantly between resting time points for both males (12%; P=0.05) and females (22%; P=0.03) whereas there was no increase for SWS or Bud. All reliability indices were comparable across saliva collection methods, except for high levels of systematic error for UWS (11-18%) and random error for Bud (82-97%).
There were significant decreases in cortisol concentrations between time points in females in both UWS (11%; P=0.003) and SWS (20%; P=0.03). Bud measurements were consistent between time points. All other reliability indices were comparable between the methods, although for SWS both systematic (up to 21%) and random errors (up to 85%) were high.
II Agreement Between Methods
Salivary analyte results for all three methods are presented in (Table 1) and (Figure 2); only notable comparisons will be mentioned here. SWS flow rate was higher than UWS for both males and females during rest and exercise (P>0.05; Figure 2A). There was a decrease in SWS flow rate in the exercise trial compared to rest for females (P=0.01) but not for males (P=0.528). Males had higher SWS flow rates than females at both rest (P=0.022) and during exercise (P=0.019).
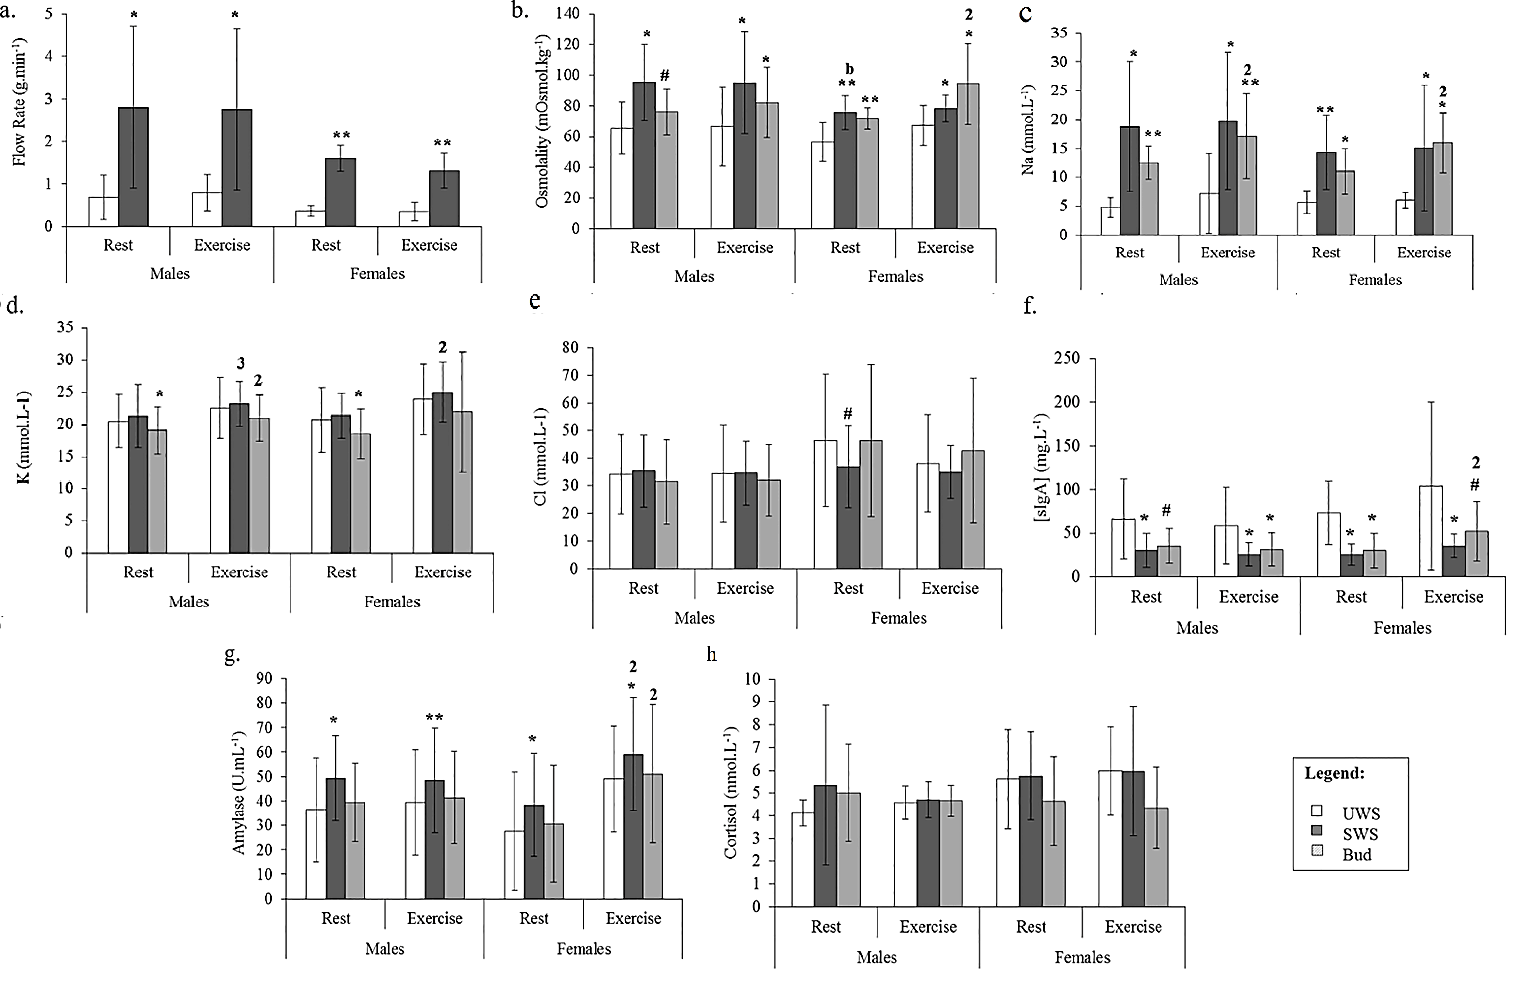
Figure 2: Comparison between the means of each method for A) flow rate (g·min-1); B) osmolality (mOsmol·kg-1); C) Na (mmol·L-1); D) K (mmol·L-1); E) Cl (mmol·L-1); F) sIgA (mg·L-1); G) α-amylase activity (U∙mL-1); and H) cortisol (nmol·L-1), for males and females during both rest and exercise. A significant difference between SWS/Bud and UWS is indicated with an asterisk (**, P<0.001; *, P<0.05) and a trend for this difference with a superscript hash (#, 0.1
0.05). For comparisons between rest and exercise within a method, significance is shown on the latter variable by number (1, P<0.001; 2, P<0.05; 3, 0.1
0.05). For comparisons between males and females within a method, significance is shown on the latter variable by letter (a, P<0.001; b, P<0.05).
The SWS and Bud collection methods consistently produced higher osmolality measurements than UWS (P<0.05), although the Bud method only showed a trend for this increase in males at rest (P=0.057; Figure 2B). There were no differences in osmolality measures between rest and exercise for SWS (P>0.05). In contrast, saliva collected using the Bud method showed higher osmolality during exercise compared to rest for females (P=0.025), but not males (P=0.275). For SWS, osmolality was higher in males than females at rest (P=0.025), with no sex differences during exercise (P=0.110). There were no sex differences osmolality for saliva collected using the Bud method (P>0.05).
Both SWS and Bud methods led to consistently elevated Na levels compared to UWS, in males and females during both rest and exercise (P<0.05; Figure 2C). There were no differences in Na levels between rest and exercise, during exercise or between males and females for the SWS method. Bud saliva showed significantly higher levels of Na during exercise compared to rest for both males (P=0.046) and females (P=0.027), but there were no differences between males and females.
Overall, levels of K (Figure 2D) and Cl (Figure 2E) were comparable across the methods, although the Bud method produced lower K concentrations for both males (P=0.025) and females (P=0.027) at rest only, with no differences observed during exercise, or between SWS and UWS at any stage (P>0.05). Levels of K in SWS were elevated at rest compared to exercise for females (P=0.004) and there was a trend for this increase in males (P=0.072). K was elevated in exercise compared to rest for males (P=0.012), but not in females (P=0.234).
The only difference in Cl measures between the methods was shown as a trend for lower levels at rest in females in SWS compared to UWS (P=0.051). Levels of Cl were consistent between rest and exercise and males and females for SWS as were Bud saliva Cl levels. Compared to UWS, SIgA concentrations from both SWS and Bud saliva collection methods were lower. This effect was observed during both rest and exercise and for males and females for SWS (P<0.05), as well as for the Bud method for all comparisons except during rest in males, and during exercise in females (0.05>P<0.10; Figure 2F). The only change observed within method was in SIgA measures in females using the Bud method, with higher levels during exercise compared to rest (P=0.033).
While there was no difference between α-amylase activity levels sampled with the UWS and Bud methods, SWS produced higher α-amylase activity readings than UWS in all comparisons (P<0.05; Figure 2G). Furthermore, an increase in α-amylase activity was observed for females during exercise compared to rest for both SWS and Bud (P<0.05; Figure 2G) but α-amylase activity levels in males were unchanged (P>0.05). There were no differences in α-amylase activity between males and females within the methods.
Cortisol measurements were comparable across all methods, for rest and exercise, for both males and females (P>0.05; Figure 2H). Similarly, there were no differences within the SWS or Bud methods for any comparison (P>0.05). Bland-Altman analysis and correlation by linear regression was used to compare mean differences in analyte values between the SWS and Bud methods and the UWS drool method (Table 2). The measured saliva flow rate of the SWS method had a positive bias of 1.6 g·min-1 compared to UWS, with an agreement range of ±2.0 g·min-1. Both systematic and random variation between methods was high (RLOA 2.5×/÷2.5). However, there was a strong and significant correlation between SWS and UWS flow rate data (r=0.791; P=0.001). SWS (d ̅=20.6±2.3 mOsmol·kg-1; LOA ±40.2; RLOA 1.3×/÷1.6), and Bud (d ̅=17.6±2.0 mOsmol·kg-1; LOA ±33.7; RLOA 1.2×/÷1.5) methods both showed a significant positive bias in the osmolality data compared to UWS, with wide ranges of agreement and moderate to high levels of systematic and random variation. SWS data was moderately correlated with UWS (r=0.482; P=0.031), while the relationship between Bud and UWS data was also significant (r=0.688; P<0.001).
There was a large significant positive bias for Na with high associated error for both SWS (d ̅=10.1±1.1 mmol·L-1; LOA ±17.8; RLOA 2.0×/÷3.3) and Bud (d ̅=7.8±0.6 mmol·L-1; LOA ±10.2; RLOA 1.9×/÷2.9) methods. Furthermore, there were no correlations with UWS for Na (SWS, r=0.094, P=0.694; Bud, r=0.115, P=0.631). SWS (d ̅=0.8±0.4 mmol·L-1; LOA ±6.7) and Bud (d ̅=-1.3±0.5 mmol·L-1; LOA ±8.2) methods gave similar but opposite biases compared to the gold standard UWS drool method for K, with moderate levels of systematic and random error only (SWS, RLOA 1.1×/÷1.3; Bud, RLOA 0.9×/÷1.5). Both SWS and Bud K data was strongly correlated with UWS data (SWS, r=0.777, P<0.001; Bud, r=0.672, P=0.001). Both methods gave a negative bias for Cl data when compared to UWS (SWS/Bud, d ̅=-3.5±1.7/-0.7±2.0 mmol·L-1; LOA ±29.2/32.7). While RLOA calculations produced an absence of systematic bias, random variation was high at 100 and 110% for SWS and Bud, respectively. However, significant correlations with UWS data for Cl (SWS, r=0.684, P<0.001; Bud, r=0.719, P<0.001) were determined.
Difference analysis for SIgA data between SWS or Bud and UWS methods of saliva collection highlighted a large negative bias, wide agreement limits and substantial associated error for both SWS (d ̅=48.2±7.1 mg·L-1; LOA ±117.4; RLOA 0.1×/÷3.6) and Bud (d ̅=39.5±7.0 mg·L-1; LOA ±116.6; RLOA 0.3×/÷3.9). The relationship between SWS and UWS data for SIgA was significant but moderate (r=0.469; P=0.037), while Bud and UWS showed a correlation that neared significance (r=0.435; P=0.055). In contrast, α-amylase activity data was strongly correlated for both SWS (r=0.908; P<0.001) and Bud (r=0.851; P<0.001) with UWS.
Similarly, α-amylase activity measures had better agreement by Bland-Altman analysis although limits were still wide. The SWS method gave an average positive bias of 10.3±1.1 U·mL-1 with an agreement range of ±19.4; there was some agreement between Bud and UWS for α-amylase activity (d ̅=1.7±1.4 U·mL-1) but the limits for this agreement remained wide (-24.0 to 27.4). In addition, while systematic bias was moderate, random variation was high (SWS, RLOA 1.3×/÷1.9; Bud, RLOA 1.1×/÷2.3). Cortisol data provided by both the SWS (d ̅=0.1±0.1 nmol. L-1; LOA ±2.2) and Bud (d ̅=-0.3±0.2 nmol·L-1; LOA ±2.7) methods showed good agreement with UWS. However, error associated with this agreement was markedly reduced for SWS data compared to Bud (SWS, RLOA 1.0×/÷1.4; Bud, RLOA 0.9×/÷2.1). The correlation between UWS and SWS data was strong (r=0.868; P<0.001) compared to a weak association between UWS and Bud for cortisol (r=0.395; P=0.085).
Discussion
The primary outcome of this research is an in-depth comparison of analyte results generated from saliva collected using the stimulated (SWS) and Bud methods with the passive drool protocol for the collection of unstimulated whole saliva (UWS). Overall, our results show significant variation between the methods, both between the sexes and during rest and exercise, which highlights the need for consistency in methodology when comparing different studies. While Bud and SWS data showed greater reliability than UWS, neither dataset gave total agreement to that of UWS across the range of parameters measured; thus, Bud and SWS may be used to inform some analyte measures when UWS samples are unavailable.
Stimulated saliva flow rates were higher than UWS in both males and females, and reliability of analyte measures was also notably greater in SWS than UWS. The low saliva flow rates for UWS may help to explain the poorer reliability we observed compared to both alternative saliva collection methods used here. However, since the percentage contributions from the different glands are altered in stimulated saliva, the analyte composition of SWS may be altered when compared to UWS. We were unable to collect accurate flow rate data for the Bud method, due to the possibility of cotton bud saturation within the sampling time and thus cannot comment on the expected impact of flow rate on Bud saliva results [17]. However, Bud data also showed greater test-retest reliability than UWS data and for some analytes was superior to that from SWS.
Bud saliva showed an increase in Na from rest to exercise in both males and females, compared to no changes in Na at any stage for both UWS and SWS. The male-specific increase in K levels from rest to exercise using the Bud method is in contrast to the corresponding female-dominated increase in UWS and SWS. A decrease in SWS Cl levels was observed compared to UWS despite significantly higher flow rates in the former, and there was no correlation between flow rate and Cl for SWS (r=-0.085; P=0.722). This is in contrast to a report which showed that in females (at rest) Cl levels increase steadily with stimulated saliva flow rate [18]. Specific analysis of data from females at rest in this study showed no correlation between saliva flow rate and Cl levels (r=0.211; P=0.373). Thaysen et al. also proposed positive and negative nonlinear relationships between flow rate and Na and K, respectively; our results showed no such patterns (data not shown), suggesting that further studies are needed to determine the exact interaction between salivary flow rate and electrolyte levels [18].
SWS showed lower levels of SIgA than UWS, with a mean bias of about -75%. Stimulated saliva has been shown to contain decreased levels of SIgA compared to its unstimulated counterpart in both clinical and exercise research and to have an inverse correlation with flow rate in unstimulated saliva likely due to the dilution of protein [19-21].
There was a significant increase in α-amylase activity in SWS compared to UWS, which is expected given the increased contribution of the parotid glands, the site of α-amylase production, to stimulated saliva [22]. Although α-amylase activity levels and changes due to exercise and gender between Bud and UWS were similar, Bud saliva showed negative bias for cortisol measures compared to UWS. Furthermore, there was only a weak correlation between Bud and UWS for cortisol levels, despite there being no difference between UWS and Bud cortisol levels for rest vs. exercise and male vs. female data. The Bud saliva collection method showed the greatest reliability of the three methods for cortisol measures.
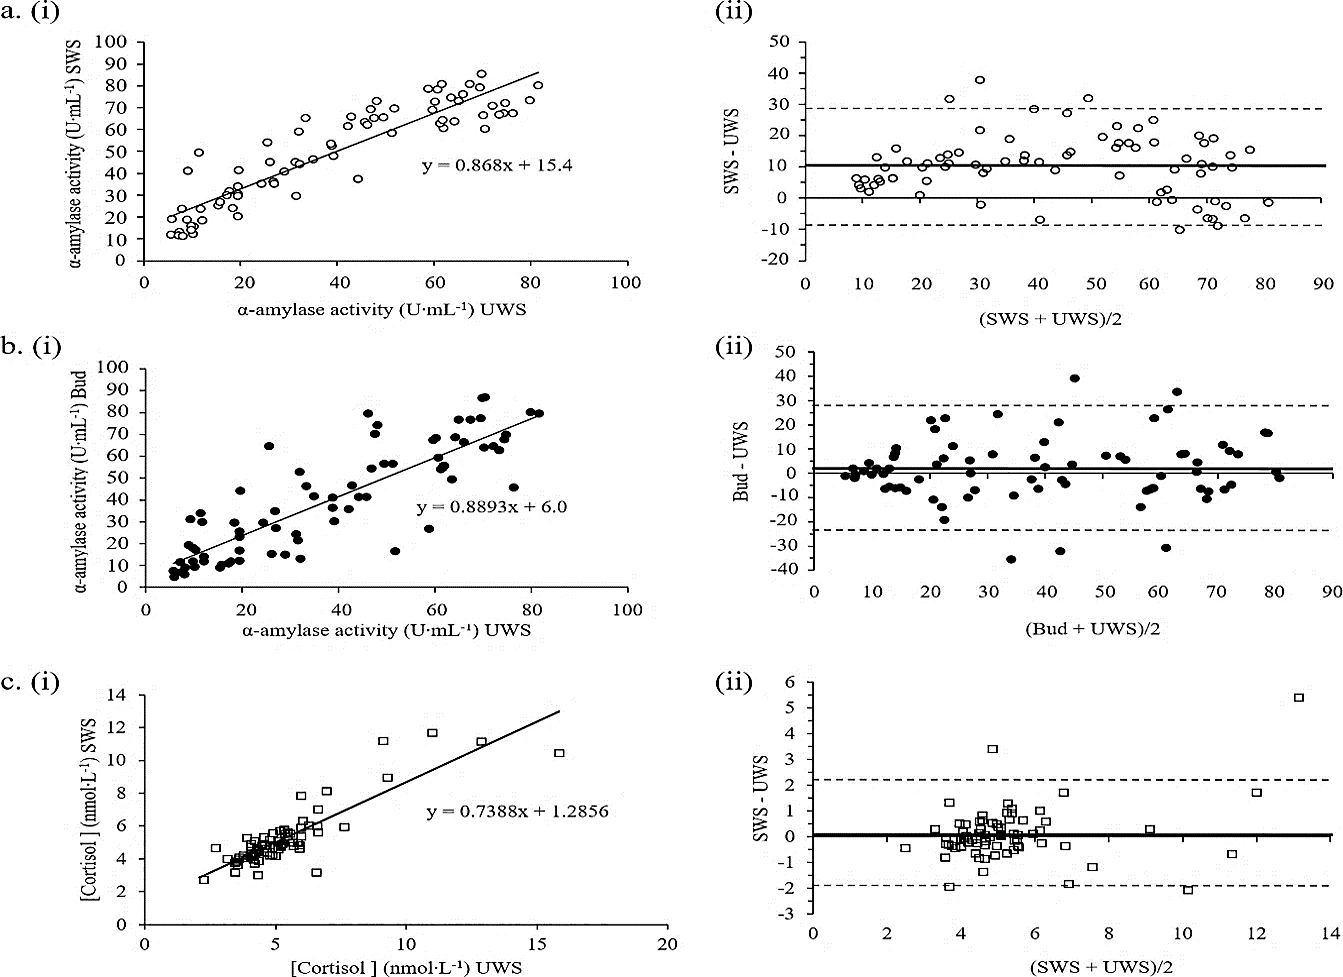
Figure 3: Association and agreement between A) SWS and UWS for α-amylase activity (r=0.908); B) Bud and UWS for α-amylase activity (r=0.851); and C) SWS and UWS for cortisol levels (r=0.868). The linear relationship and its equation for each pair is shown in i), with the associated Bland-Altman absolute difference plots alongside ii) Bland-Altman plots show the mean difference (d ̅) as a thick solid black line and the corresponding positive and negative limits of agreement as hashed lines. Values for each parameter are above or below each line.
Previous research has shown using cotton-based devices for saliva collection can affect the results of both cortisol and SIgA measurement in saliva, although results are equivocal [3, 23-25]. One study showed a significant decrease in both SIgA and cortisol in saliva collected using a Salivette compared to passive drool while another showed that SIgA was affected, but cortisol was not [24, 25]. Previous research has shown that Salivette cortisol was better able to predict both total and calculated free serum cortisol than passive drool [23]. Thus, the level of adsorption of specific analytes onto the cotton buds used in the Bud method requires determination. A comparison of cortisol UWS, SWS and Bud saliva with corresponding serum levels is necessary to fully compare each of these methods to published responses.
We aimed to determine the ability of either SWS or Bud to accurately correlate with analyte values present in UWS and therefore their potential to replace UWS as a saliva sampling method for use is specific applications. Three strong and highly significant linear correlations emerged from our analysis (r>0.8; P<0.001); both SWS and Bud with UWS for α-amylase activity (Figure 3A & 3B, respectively) and SWS with UWS for cortisol (Figure 3C). However, in order to fully determine method replacement ability, linear correlations were plotted (Figure 3i) and compared to their associated Bland-Altman difference plots (Figure 3ii) [26]. Although α-amylase activity measures showed good correlation for both SWS and Bud with UWS collection methods, neither method can be used to predict the results obtained from UWS due to inconsistencies in the mean differences that occur throughout the concentration range. The Bland-Altman plots show that SWS over- and under-estimates UWS data at low and high α-amylase concentrations, respectively. In contrast, Bud saliva α-amylase activity measures show a better association at both low and high concentrations than medium concentrations.
The only analyte exhibiting both strong correlation and corresponding agreement was cortisol. Limits of agreement for SWS vs. UWS cortisol were ±2.2 units either side; this translates to around ±33% suggesting that SWS may be able to replace UWS for the measurement of cortisol in males and females during both rest and exercise when cortisol levels are below 8 nmol·L-1 (the level below which the majority of the data falls). Although SWS data did not show a statistical trend for higher cortisol levels in females compared to males shown in UWS (Figure 2H) there was a measured increase in females using SWS. These results are consistent with the cortisol vs. α-amylase activity results for SWS and Bud compared to UWS. Hence, SWS showed agreement with UWS for the stress markers cortisol and α-amylase.
Overall, our results show that neither SWS nor Bud can fully replace UWS for the analysis of salivary markers of hydration, electrolyte (Na, K and Cl) status, sIgA or the α-amylase/cortisol stress response to exercise in males or females. However, both SWS and Bud methods are more reliable than UWS. We found that SWS is a superior method than Bud for measurement of the stress response and we suggest that this is most likely due to the adsorption of cortisol on the cotton of the buds; however, further research is needed to confirm this hypothesis [24, 25].
Our dataset is limited to 20 participants assessed in the laboratory and therefore cannot inform about results that may be obtained in the field or clinical setting. Also, the lack of flow rate data for the Bud method limits the conclusions that can be drawn regarding the possible effects of flow rate on hydration and electrolyte levels. As mentioned previously, it should be noted that saliva concentrations of some analytes might also not reflect serum or plasma concentrations.
Conclusion
Our findings highlight the necessity for methodological consistency in saliva collection methods in research and diagnosis. In addition, they provide a starting point for the use of stimulated whole saliva in measurement of the stress response, an attractive outcome given the necessity of this response in both disease and exercise applications, where low flow rates associated with UWS may hinder reliability. Future research should focus on adding to this dataset, with the measurement of adsorption of specific analytes on cotton buds and the collection of flow rate data for the Bud method and the associated serum analyte levels. An evaluation of these different saliva collection methods in the field or clinical setting is also warranted, as these environments are likely to contribute different sources of error and/or complexities that have not been addressed here.
Author Contributions
AA, KRM and DD conceived the study design. KRM and AA received the funding. AA applied for ethical approval. AA supervised the data collection. KRM undertook all saliva analyses. AA and CS conducted the statistical analysis. AA and CS drafted the manuscript. AA, KRM, DD and CS all edited and approved the submission.
Acknowledgements
The authors would like to thank Olivier Morin and John Taulu for help with data collection, Simon Bennett for technical support and the participants for providing their time and effort to complete this research.
Funding
The study was supported by a grant from Massey University.
Conflicts of Interest
None.
Research Involving Human Participants and/or Animals
This research was approved by Massey University Human Ethics Committee (Southern A). All human participants provided consent to publish this research.
Consent
All participants provided written informed consent prior to participation in the study.
Abbreviations
Cl: Chloride
CV: Coefficient of Variation
ELISA: Enzyme-Linked Immunosorbent Assay
ICC: Intraclass Correlation Coefficient
K: Potassium
LOA: Limits of Agreement
Na: Sodium
RLOA: Ratio Limits of Agreement
SEM: Standard Error of Measurement
SIgA: Salivary Secretory Immunoglobulin A
SWS: Stimulated Whole Saliva
USG: Urine Specific Gravity
UWS: Unstimulated Whole Saliva
Article Info
Article Type
Research ArticlePublication history
Received: Mon 04, May 2020Accepted: Mon 18, May 2020
Published: Tue 26, May 2020
Copyright
© 2023 Ajmol Ali. This is an open-access article distributed under the terms of the Creative Commons Attribution License, which permits unrestricted use, distribution, and reproduction in any medium, provided the original author and source are credited. Hosting by Science Repository.DOI: 10.31487/j.JFNM.2020.01.05
Figures & Tables
Table 1: Levels of salivary analytes and reliability indices between measures taken at rest for UWS, SWS and Bud saliva collection methods for male and female cohorts. Flow rate data was not available for the Bud method. Saliva was collected at two intervals 30 min apart (T1 and T2). Due to the staggered nature of sampling for each method, these intervals are: UWS, 15 and 45 min; SWS, 25 and 55 min; and Bud, 20 and 50 min. A significant % difference between measures is indicated with an asterisk (**, P<0.001; *, P<0.05) and a trend for a difference with a superscript hash (#, 0.1<P>0.05). For PCC measures, a moderate strength relationship (*) is defined as a coefficient ≥0.5 and a strong relationship (**) as a coefficient ≥ 0.7. For LOA and RLOA, error is shown in brackets (+/- and x/÷, respectively).
|
|
Rest T1 |
Rest T2 |
% Difference |
Paired t-test |
r |
CV |
ICC |
SEM |
95% CI |
LOA (Mean bias ±2SD) |
RLOA (Mean bias x/÷2SD) |
|
|
Flow Rate (g·min-1) |
||||||||||||
|
UWS |
Males |
0.64 (0.47) |
0.72 (0.57) |
8.9 |
0.176 |
0.970** |
24.2 |
0.97 |
0.09 |
0.18 |
0.09 ± 0.32 |
1.09 x/÷ 1.70 |
|
Females |
0.34 (0.13) |
0.40 (0.12) |
21.3 |
0.010* |
0.860** |
17.8 |
0.88 |
0.04 |
0.09 |
0.06 ± 0.13 |
1.22 x/÷ 1.90 |
|
|
SWS |
Males |
2.83 (1.91) |
3.02 (1.77) |
6.1 |
0.313 |
0.970** |
16.4 |
0.98 |
0.26 |
0.52 |
0.18 ± 0.94 |
1.06 x/÷ 1.52 |
|
Females |
1.71 (0.48) |
1.48 (0.28) |
12.1 |
0.133 |
0.29 |
30.2 |
0.37 |
0.25 |
0.49 |
-0.23 ± 0.95 |
0.88 x/÷ 1.74 |
|
|
Osmolality (mOsmol·kg-1) |
||||||||||||
|
UWS |
Males |
65.4 (15.8) |
65.9 (18.7) |
0.3 |
0.85 |
0.926** |
11 |
0.96 |
3.38 |
6.77 |
0.50 ± 14.17 |
1.00 x/÷ 1.18 |
|
Females |
57.3 (15.1) |
56.0 (11.8) |
0.2 |
0.65 |
0.788** |
16.4 |
0.87 |
4.52 |
9.03 |
-1.25 ± 18.20 |
0.99 x/÷ 1.35 |
|
|
SWS |
Males |
96.1 (24.7) |
94.8 (24.5) |
1.9 |
0.63 |
0.954** |
8 |
0.98 |
3.68 |
7.36 |
-1.38 ± 14.96 |
0.98 x/÷ 1.18 |
|
Females |
75.8 (12.6) |
75.6 (13.8) |
0.6 |
0.97 |
0.44 |
18.5 |
0.63 |
6.79 |
13.59 |
-0.17 ± 27.37 |
0.99 x/÷ 1.45 |
|
|
Bud |
Males |
76.4 (13.7) |
75.9 (18.1) |
1.4 |
0.91 |
0.753** |
15.6 |
0.86 |
5.63 |
11.27 |
-0.50 ± 23.33 |
0.99 x/÷ 1.34 |
|
|
Females |
72.7 (20.6) |
70.7 (15.4) |
1.8 |
0.65 |
0.728** |
19.7 |
0.83 |
6.85 |
13.7 |
-2.00 ± 27.65 |
0.98 x/÷ 1.39 |
|
Na (mmol·L-1) |
||||||||||||
|
UWS |
Males |
4.53 (2.15) |
5.10 (1.85) |
28.3 |
0.451 |
0.51 |
41.3 |
0.68 |
0.98 |
1.96 |
0.56 ± 3.90 |
1.18 x/÷ 2.22 |
|
Females |
6.37 (3.15) |
5.00 (1.31) |
11 |
0.136 |
0.46 |
49.4 |
0.45 |
1.45 |
2.9 |
-1.37 ± 5.51 |
0.82 x/÷ 2.07 |
|
|
SWS |
Males |
18.6 (11.3) |
19.0 (11.7) |
0.7 |
0.85 |
0.909** |
26.2 |
0.96 |
2.32 |
4.65 |
0.35 ± 9.63 |
0.99 x/÷ 1.64 |
|
Females |
14.8 (6.12) |
13.7 (6.85) |
13.5 |
0.18 |
0.915** |
19.4 |
0.95 |
1.43 |
2.87 |
-1.14 ± 5.42 |
0.86 x/÷ 1.61 |
|
|
Bud |
Males |
13.0 (3.54) |
12.0 (2.92) |
7 |
0.37 |
0.580* |
24.1 |
0.74 |
1.47 |
2.95 |
-1.03 ± 5.90 |
0.93 x/÷ 1.60 |
|
Females |
11.0 (4.23) |
11.0 (4.22) |
0.3 |
0.98 |
0.783** |
25.3 |
0.89 |
1.33 |
2.67 |
-0.02 ± 5.45 |
1.00 x/÷ 1.54 |
|
|
K (mmol·L-1) |
||||||||||||
|
UWS |
Males |
19.7 (4.11) |
21.3 (6.15) |
10.6 |
0.528 |
0.24 |
31.9 |
0.38 |
3.22 |
6.43 |
1.54 ± 12.83 |
1.06 x/÷ 1.73 |
|
Females |
21.9 (5.99) |
19.5 (4.81) |
9.3 |
0.060# |
0.747** |
19.3 |
0.81 |
2.21 |
4.41 |
-2.41 ± 7.82 |
0.89 x/÷ 1.43 |
|
|
SWS |
Males |
21.1 (4.34) |
21.5 (5.44) |
1.1 |
0.39 |
0.992** |
6 |
0.98 |
0.64 |
1.27 |
0.41 ± 2.51 |
1.01 x/÷ 1.10 |
|
Females |
21.7 (3.71) |
21.1 (3.46) |
2.8 |
0.24 |
0.897** |
7.8 |
0.94 |
0.84 |
1.68 |
-0.60 ± 3.26 |
0.97 x/÷ 1.16 |
|
|
Bud |
Males |
19.2 (3.29) |
19.0 (4.35) |
1.8 |
0.81 |
0.865** |
11.7 |
0.92 |
1.06 |
2.11 |
-0.20 ± 4.36 |
0.98 x/÷ 1.20 |
|
Females |
18.9 (3.25) |
18.2 (5.00) |
6 |
0.49 |
0.738** |
18.4 |
0.81 |
1.68 |
3.35 |
-0.74 ± 6.70 |
0.94 x/÷ 1.52 |
|
|
Cl (mmol·L-1) |
||||||||||||
|
UWS |
Males |
32.6 (13.2) |
35.9 (20.4) |
13.8 |
0.634 |
0.47 |
53.8 |
0.62 |
8.94 |
17.88 |
3.24 ± 36.1 |
1.04 x/÷ 2.25 |
|
Females |
49.6 (27.2) |
43.1 (23.3) |
9.7 |
0.193 |
0.806** |
34.9 |
0.88 |
8.36 |
16.72 |
-6.48 ± 31.7 |
0.86 x/÷ 1.76 |
|
|
SWS |
Males |
34.3 (10.9) |
36.6 (15.7) |
3.5 |
0.36 |
0.943** |
18.5 |
0.94 |
3.27 |
6.53 |
2.25 ± 12.9 |
1.04 x/÷ 1.34 |
|
Females |
38.4 (17.0) |
35.4 (13.2) |
7.3 |
0.14 |
0.936** |
17.7 |
0.95 |
3.45 |
6.9 |
-3.03 ± 12.8 |
0.93 x/÷ 1.34 |
|
|
Bud |
Males |
32.3 (13.1) |
30.5 (18.4) |
9.5 |
0.6 |
0.883** |
29.3 |
0.92 |
4.41 |
8.81 |
-1.78 ± 18.0 |
0.90 x/÷ 1.60 |
|
|
Females |
47.3 (27.9) |
45.6 (27.5) |
5.2 |
0.47 |
0.967** |
15.3 |
0.98 |
3.48 |
6.95 |
-1.63 ± 14.0 |
0.95 x/÷ 1.44 |
|
sIgA (mg·L-1) |
||||||||||||
|
UWS |
Males |
65.7 (42.2) |
66.8 (52.0) |
3.5 |
0.895 |
0.900** |
34.9 |
0.94 |
10.86 |
21.72 |
1.12 ± 45.3 |
0.91 x/÷ 2.08 |
|
Females |
86.4 (49.0) |
60.2 (35.8) |
8.3 |
0.12 |
0.21 |
61.9 |
0.56 |
24.06 |
48.12 |
-26.2 ± 88.9 |
0.71 x/÷ 5.05 |
|
|
SWS |
Males |
29.8 (15.5) |
31.0 (23.3) |
10.3 |
0.71 |
0.960** |
31 |
0.95 |
4.46 |
8.92 |
1.27 ± 18.5 |
0.89 x/÷ 1.96 |
|
Females |
28.3 (17.5) |
22.8 (8.8) |
14.9 |
0.24 |
0.709** |
50.4 |
0.71 |
6.59 |
13.18 |
-5.49 ± 25.2 |
0.85 x/÷ 2.06 |
|
|
Bud |
Males |
34.6 (18.7) |
36.1 (23.5) |
1 |
0.79 |
0.772** |
42.3 |
0.87 |
7.08 |
14.16 |
1.45 ± 29.3 |
1.01 x/÷ 2.15 |
|
Females |
31.2 (28.7) |
29.0 (13.5) |
15.5 |
0.76 |
0.745** |
68.7 |
0.75 |
9.93 |
19.86 |
-2.21 ± 40.5 |
1.17 x/÷ 2.95 |
|
|
α-amylase activity (U·mL-1) |
||||||||||||
|
UWS |
Males |
34.6 (20.4) |
38.2 (22.1) |
12.3 |
0.050* |
0.983** |
11.7 |
0.98 |
26.75 |
53.51 |
36.4 ± 83.2 |
1.11 x/÷ 1.25 |
|
Females |
25.7 (23.5) |
29.5 (24.9) |
22.4 |
0.030* |
0.983** |
15.6 |
0.99 |
26.71 |
53.43 |
35.8 ± 83.8 |
1.18 x/÷ 1.46 |
|
|
SWS |
Males |
49.9 (18.3) |
48.7 (18.3) |
2.8 |
0.76 |
0.821** |
22.2 |
0.91 |
51.75 |
103.49 |
-12.4 ± 214.4 |
0.97 x/÷ 1.48 |
|
Females |
37.4 (20.5) |
39.3 (22.0) |
4.6 |
0.24 |
0.971** |
13.2 |
0.98 |
25.99 |
51.99 |
18.9 ± 96.0 |
1.05 x/÷ 1.35 |
|
|
Bud |
Males |
38.2 (15.9) |
40.7 (17.9) |
4.6 |
0.54 |
0.798** |
27.6 |
0.89 |
52.55 |
52.55 |
24.8 ± 213.1 |
1.05 x/÷ 1.82 |
|
Females |
32.6 (25.3) |
28.5 (23.3) |
7.4 |
0.15 |
0.931** |
28.3 |
0.96 |
45.12 |
90.24 |
-39.5 ± 67.4 |
0.92 x/÷ 1.96 |
|
|
Cortisol (nmol·L-1) |
||||||||||||
|
UWS |
Males |
4.21 (0.73) |
4.02 (0.48) |
3.7 |
0.21 |
0.893** |
8.9 |
0.89 |
0.19 |
0.39 |
-0.20 ± 0.72 |
0.96 x/÷ 1.18 |
|
Females |
5.95 (2.26) |
5.26 (2.16) |
11.4 |
0.003* |
0.960** |
11.3 |
0.96 |
0.45 |
0.9 |
-0.68 ± 1.24 |
0.88 x/÷ 1.20 |
|
|
SWS |
Males |
5.27 (2.87) |
5.43 (4.19) |
4.1 |
0.76 |
0.991** |
26.1 |
0.97 |
0.66 |
1.32 |
0.16 ± 2.74 |
0.96 x/÷ 1.40 |
|
Females |
6.33 (2.40) |
5.16 (1.73) |
20.2 |
0.030* |
0.749** |
27.7 |
0.77 |
0.93 |
1.85 |
-1.17 ± 3.12 |
0.79 x/÷ 1.85 |
|
|
Bud |
Males |
5.21 (2.69) |
4.80 (1.63) |
4.3 |
0.35 |
0.974** |
23.4 |
0.93 |
0.58 |
1.17 |
-0.41 ± 2.29 |
0.96 x/÷ 1.33 |
|
|
Females |
4.80 (2.18) |
4.47 (1.76) |
4.2 |
0.18 |
0.955** |
15.5 |
0.96 |
0.38 |
0.76 |
-0.33 ± 1.41 |
0.96 x/÷ 1.39 |
PCC: Pearson’s Correlation Coefficient; CV: coefficient of variation; ICC: Intra-class Correlation Coefficient; SEM: Standard Error of the Mean; 95% CI: 95% Confidence Interval; LOA: Limits of Agreement; RLOA: Ratio Limits of Agreement.
Table 2: Agreement and association between the SWS or Bud method compared to the UWS passive drool method for flow rate (g·min-1), osmolality (mOsmol·kg-1), Na (mmol·L-1), K (mmol·L-1), Cl (mmol·L-1), sIgA (mg·L-1), α-amylase activity (U∙mL-1) and cortisol (nmol·L-1). Total participant data was used for analysis. Absolute Bland-Altman data shows the mean difference (d) of either SWS or Bud data from UWS data when pairs of points are compared, as well as the standard error (SE), 1.96 standard deviations (1.96∙s) and 95% limits of agreement (LOA) associated with this difference. Ratio limits of agreement (RLOA) were determined using natural log-transformed data. The correlation coefficient (r) and P-value for the association between SWS or Bud and UWS is shown alongside each set of Bland-Altman values.
|
Bland-Altman Analysis |
|
Linear Regression |
||||||||||||
|
|
|
Absolute LOA |
|
Ratio LOA |
|
|
|
|||||||
|
d (SE) |
1.96∙s |
LOA (95%) |
|
d (SE) |
Mean bias (1+ d) |
1.96∙s (antilog) |
LOA (95%) |
|
r |
P |
||||
|
|
|
lower |
upper |
|
lower |
upper |
|
|||||||
|
Flow Rate (g∙min-1) |
|
|
||||||||||||
|
SWS |
1.6 (0.2) |
2 |
-0.4 |
3.6 |
|
1.5 (0.07) |
2.5 |
2.5 |
0.6 |
2.4 |
|
0.791 |
0.001* |
|
|
Osmolality(mOsmol∙kg-1) |
|
|
||||||||||||
|
SWS |
20.6 (2.3) |
40.2 |
-19.5 |
60.7 |
|
0.3 (0.03) |
1.3 |
1.6 |
-0.2 |
0.8 |
|
0.482 |
0.031* |
|
|
Bud |
17.6 (2.0) |
33.7 |
-16.0 |
51.3 |
|
0.24 (0.02) |
1.2 |
1.5 |
-0.2 |
0.7 |
|
0.688 |
<0.001** |
|
|
Na(mmol∙L-1) |
|
|
||||||||||||
|
SWS |
10.1 (1.1) |
17.8 |
-7.6 |
27.9 |
|
1.0 (0.07) |
2.0 |
3.3 |
-0.2 |
2.2 |
|
0.094 |
0.694 |
|
|
Bud |
7.8 (0.6) |
10.2 |
-2.3 |
17.9 |
|
0.9 (0.02) |
1.9 |
2.9 |
-0.2 |
2.0 |
|
0.115 |
0.631 |
|
|
K (mmol∙L-1) |
|
|
||||||||||||
|
SWS |
0.8 (0.4) |
6.7 |
-5.8 |
7.4 |
|
0.1 (0.02) |
1.1 |
1.3 |
-0.2 |
0.3 |
|
0.777 |
<0.001** |
|
|
Bud |
-1.3 (0.5) |
8.2 |
-9.6 |
6.9 |
|
-0.1 (0.02) |
0.9 |
1.5 |
-0.4 |
0.3 |
|
0.672 |
0.001* |
|
|
Cl (mmol∙L-1) |
|
|
||||||||||||
|
SWS |
-3.5 (1.7) |
29.2 |
-32.7 |
25.8 |
|
-0.03 (0.04) |
1.0 |
2.0 |
-0.7 |
0.7 |
|
0.684 |
<0.001** |
|
|
Bud |
-0.7 (2.0) |
32.7 |
-33.4 |
31.9 |
|
-0.04 (0.05) |
1.0 |
2.1 |
-0.8 |
0.7 |
|
0.719 |
<0.001** |
|
|
sIgA (mg∙L-1) |
|
|
||||||||||||
|
SWS |
-48.2 (7.1) |
117.4 |
-165.7 |
69.3 |
|
-0.9 (0.08) |
0.1 |
3.6 |
-2.2 |
0.4 |
|
0.469 |
0.037* |
|
|
Bud |
-39.5 (7.0) |
116.6 |
-156.1 |
77.0 |
|
-0.7 (0.08) |
0.3 |
3.9 |
-2.1 |
0.7 |
|
0.435 |
0.055# |
|
|
α-amylase activity (U∙mL-1) |
|
|
||||||||||||
|
SWS |
10.3 (1.1) |
19.4 |
-9.1 |
29.7 |
|
0.3 (0.04) |
1.3 |
1.9 |
-0.3 |
1.0 |
|
0.908 |
<0.001** |
|
|
Bud |
1.7 (1.4) |
25.7 |
-24.0 |
27.4 |
|
0.05 (0.05) |
1.1 |
2.3 |
-0.8 |
0.9 |
|
0.851 |
<0.001** |
|
|
Cortisol (nmol∙L-1) |
|
|
||||||||||||
|
SWS |
0.1 (0.1) |
2.2 |
-2.0 |
2.2 |
|
0.01 (0.02) |
1.0 |
1.4 |
-0.3 |
0.4 |
|
0.868 |
<0.001** |
|
|
|
Bud |
-0.3 (0.2) |
2.7 |
-3.1 |
2.5 |
|
-0.1 (0.05) |
0.9 |
2.1 |
-0.9 |
0.6 |
|
0.395 |
0.085# |
0.05). For comparisons between rest and exercise within a method, significance is shown on the latter variable by number (1, P<0.001; 2, P<0.05; 3, 0.1
0.05). For comparisons between males and females within a method, significance is shown on the latter variable by letter (a, P<0.001; b, P<0.05).
References
- Lindsay A, Costello JT (2017) Realising the Potential of Urine and Saliva as Diagnostic Tools in Sport and Exercise Medicine. Sports Med 47: 11-31. [Crossref]
- Nunes LAS, Mussavira S, Bindhu OS (2015) Clinical and diagnostic utility of saliva as a non-invasive diagnostic fluid:a systematic review. Biochem Med (Zagreb) 25: 177-192. [Crossref]
- Papacosta E, Nassis GP (2011) Saliva as a tool for monitoring steroid, peptide and immune markers in sport and exercise science. J Sci Med Sport 14: 424-434. [Crossref]
- Hayes LD, Sculthorpe N, Cunniffe B, Grace F (2016) Salivary Testosterone and Cortisol Measurement in Sports Medicine: a Narrative Review and User’s Guide for Researchers and Practitioners. Int J Sports Med 37: 1007-1018. [Crossref]
- Hayes LD, Sculthorpe N, Herbert P, Baker JS, Hullin DA et al. (2015) Salivary testosterone measurement does not identify biochemical hypogonadism in aging men: a ROC analysis. Endocrine 50: 256-259. [Crossref]
- Williamson S, Munro C, Pickler R, Grap MJ, Elswick RK Jr (2012) comparison of biomarkers in blood and saliva in healthy adults. Nurs Res Pract 2012: 246178. [Crossref]
- Inoue H, Ono K, Masuda W, Morimoto Y, Tanaka T et al. (2006) Gender difference in unstimulated whole saliva flow rate and salivary gland sizes. Arch Oral Biol 51: 1055-1060. [Crossref]
- Chicharro J, Lucía A, Pérez M, Vaquero A, Ureña R (1998) Saliva composition and exercise. Sports Med 26: 17-27. [Crossref]
- Kaufman E, Lamster IB (2002) The diagnostic applications of saliva-- a review. Crit Rev Oral Biol Med 13: 197-212. [Crossref]
- Yoshizawa JM, Schafer CA, Schafer JJ, Farrell JJ, Paster BJ et al. (2013) Salivary biomarkers: toward future clinical and diagnostic utilities. Clin Microbiol Rev 26: 781-791. [Crossref]
- Rohleder N, Nater UM (2009) Determinants of salivary α-amylase in humans and methodological considerations. Psychoneuroendocrinology 34: 469-485. [Crossref]
- Rutherfurd Markwick K, Starck C, Dulson DK, Ali A (2017) Salivary diagnostic markers in males and females during rest and exercise. J Int Soc Sports Nutr 14: 27. [Crossref]
- Crooks CV, Wall CR, Cross ML, Rutherfurd Markwick KJ (2006) The effect of bovine colostrum supplementation on salivary iga in distance runners. Int J Sport Nutr Exerc Metab 16: 47-64. [Crossref]
- Atkinson G, Nevill AM (1998) Statistical methods for assessing measurement error (reliability) in variables relevant to sports medicine. Sports Med 26: 217-238. [Crossref]
- Atkinson G (1995) A comparison of statistical methods for assessing measurement repeatability in ergonomics research. Sport Leisure and Ergonomics (Reilly T and Atkinson G eds.) 218-222.
- Bland MJ, Altman D (1986) Statistical methods for assessing agreement between two methods of clinical measurement. Lancet 1: 307-310. [Crossref]
- Beltzer EK, Fortunato CK, Guaderrama MM, Peckins MK, Garramone BM et al. (2010) Salivary flow and alpha-amylase: collection technique, duration, and oral fluid type. Physiol Behav 101: 289-296. [Crossref]
- Thaysen J, Thorn, N, Schwartz IL (1954) Excretion of sodium, potassium, chloride and carbon dioxide in human parotid saliva. Am J Physiol 178: 155-159. [Crossref]
- Allgrove JE, Oliveira M, Gleeson M (2014) Stimulating whole saliva affects the response of antimicrobial proteins to exercise. Scand J Med Sci Sports 24: 649-655. [Crossref]
- Vučićević Boras V, Topić B, Zadro R, Stavljenić Rukavina A (2001) Quantity of Salivary Immunoglobulin A, Lysozyme and Magnesium in Patients with Burning Mouth Syndrome and Xerostomia. Acta Stomatologica Croatica 35: 211-214.
- Kugler J, Hess M, Haake D (1992) Secretion of salivary immunoglobulin a in relation to age, saliva flow, mood states, secretion of albumin, cortisol, and catecholamines in saliva. J Clin Immunol 12: 45-49. [Crossref]
- Arhakis A, Karagiannis V, Kalfas S (2013) Salivary alpha-amylase activity and salivary flow rate in young adults. Open Dent J 7: 7-15. [Crossref]
- Poll EM, Kreitschmann Andermahr I, Langejuergen Y, Stanzel S, Gilsbach JM et al. (2007) Saliva collection method affects predictability of serum cortisol. Clin Chim Acta 382: 15-19. [Crossref]
- Shirtcliff EA, Granger DA, Schwartz E, Curran MJ (2001) Use of salivary biomarkers in biobehavioral research: cotton-based sample collection methods can interfere with salivary immunoassay results. Psychoneuroendocrinology 26: 165-173. [Crossref]
- Strazdins L, Meyerkort S, Brent V, D'Souza RM, Broom DH et al. (2005) Impact of saliva collection methods on sIgA and cortisol assays and acceptability to participants. J Immunol Methods 307: 167-171. [Crossref]
- Giavarina D (2015) Understanding Bland Altman analysis. Biochem Med (Zagreb) 25: 141-151. [Crossref]