Comparison Between CT Volumetric Measurement and RECIST 1.1 Criteria to Assess the Tumoral Response in Advanced Renal Cell Carcinoma Treated by Immunotherapy
A B S T R A C T
Objective: Assessment of a volumetric method versus gold standard unidimensional measurement based on RECIST 1.1 in advanced renal clear cell carcinoma (RCC) treated by immunotherapy.
Materials and Methods: We retrospectively recorded the CT data of 14 adult patients treated with immunotherapy for metastatic RCC from February 2016 to January 2018. Follow-up CT scanners were independently reviewed by two radiologists. Unidimensional RECIST 1.1 and volumetric measurements were compared at each time point, with a total of 810 measurements performed for statistical analysis. The main criterion was the inter-observer agreement for each method. The secondary criterion was the tumoral response assessment based on three different items: RECIST 1.1, spherical volumetric method, ellipsoidal volumetric method.
Results: Intraclass coefficient correlation in volumetric method (0.986 [95% CI: 0.980, 0.990]) was higher than in RECIST (0.903 [95% CI: 0.861, 0.928]). Relative measurement differences with Bland and Altman plot were lower in the volumetric method with shorter limits of agreement (0.8%; upper LOA95%: 36.5; lower LOA95%: −35), versus those in RECIST (-5.1 % (upper LOA95%: 46; lower LOA95%: −57). The volumetric method (especially the ellipsoidal one) assesses the progression disease earlier than RECIST for 57% of patients, but there is no formal difference for partial response assessment.
Conclusion: Volumetric assessment for tumoral response in metastatic RCC compared to unidimensional measurements had a higher inter-observer agreement and might predict disease progression earlier.
Keywords
Volumetry, RECIST, CT, metastatic renal clear cell carcinoma, immunotherapy
Introduction
Kidney cancers occur most frequently in men than in women, representing up to 5% of all adult malignancies and being the 7th most common cancer in men. Renal cell carcinoma (RCC) is the most common renal malignancy in this group, accounting for 80% of all kidney cancers. RCC incidence is nowadays plateauing at a high level with multiple incidental diagnosis of less advanced tumor due to the widespread use of non-invasive imaging techniques such as ultrasonography and computed tomography. Consequently, kidney cancer mortality rates have levelled [1, 2]. Approximately 33% of patients with RCC will develop metachronous metastasis [2]. Historically, RCC is known as being the most resistant solid tumors to the classic cytotoxic agents in oncology, explaining that other classes of anticancer agents such as antiangiogenic, mTOR inhibitors and since 2015, immune checkpoint inhibitors have been developed [3, 4].
Computed tomography (CT) is essential to appreciate the tumor burden changes indicating the response to treatment. In 2000, the Response Evaluation Criteria in Solid Tumor (RECIST) was created, then revised and upgraded in 2009 (RECIST 1.1), and is currently considered as the gold standard criteria for tumoral response assessment [5, 6].While RECIST 1.1 is a common language to evaluate the response to tumor burden, some limitations and pitfalls are present [7]. RECIST is a one-dimensional measurement of a three-dimensional lesion (namely tumor volume) and theoretically doesn’t represent as well the total tumor burden as the volumetric measurement. Besides, the inter-observer variability has been demonstrated to be high [8].
The aim of our study was, therefore, to assess the efficiency of the volumetric method versus the usual unidimensional measures (RECIST 1.1) in advanced RCC treated by immunotherapy in terms of a/ the inter-observer agreement for each method and b/ the tumoral response assessment.
Materials and Methods
I Population
This is a retrospective study of patients followed from February 2016 to January 2018 who presented an intermediate to poor prognostic advanced renal cell carcinoma, receiving immunotherapy as the first line of treatment. This cohort was an arm of a multicentric trial studying the interest of immunotherapy versus Sunitinib in advanced renal cancer. Patients received Nivolumab plus Ipilimumab followed by Nivolumab monotherapy; both drugs were administered intravenously according to the protocol of this trial.
II CT Acquisition
The imaging survey included a first baseline standard contrast-enhanced chest-abdomen-and-pelvis CT scan followed by several follow up CT scan examinations (every 6 weeks the first 13 months, and then every 12 weeks). All examinations were performed on the same CT unit (Discovery CT 750 HD 64, GE Healthcare, Milwaukee, USA) with a tri-phasic acquisition: non-enhanced phase, arterial phase (35 seconds after administration of iodinated contrast agent) and portal phase (70 seconds after administration of iodinated contrast material). We used the same contrast agent (iomeprol 350, Iomeron, Bracco Imaging) at the dose of 1,5ml/kg and the injection rate of 3ml/s with an automatic power injector.
III Target Lesion Measurements
All measurements of each target lesion were performed on the portal phase, independently by two readers (XX, with 10 years of experience in CT and XX, with 6 years) on a dedicated workstation. Determination of the target lesions (one to five per patient) was done prior to the measurements by a senior radiologist (XX, 25 years of experience in CT).
All CT data were archived in our PACS (Centricity Picture archiving) with an 3D imaging software analysis included (AW server, GE). Volumetric measurements were extracted via a manual 3D contour segmentation tool named “quick painting” and volumes were calculated automatically by the software (by summing the voxels within the 3D contour, giving a resulting volume).
At each examination, readers recorded for each target lesion a unidimensional measurement (the longest diameter, mm) and a volumetric measurement (cm3) and then calculated the sum of the diameters (SOD) and sum of the volumes (SOV) according to the number of target lesions. At each time point, changes in the SOD and SOV were calculated in terms of percent change. In the present study, only target lesions were evaluated for tumor assessment in order to facilitate the comparison of the results of the two observers. We did not take into account any new lesions or non-target lesions.
IV Response Assessment
The treatment response on the targets defined was assessed on follow-up CT scans. As there is no consensus available concerning a volumetric criterion for tumoral response assessment, we have used two different methods of 3D volumetric response assessment. For the first “volumetric spherical” method, we used volumetric response cut-offs based on simple mathematical extrapolation of RECIST to spherical volumes, as initially described by Therasse et al. in the 2000 RECIST guidelines with different thresholds for tumor response assessment (Table 1) [5].
For the second “volumetric ellipsoid” method, we used an alternative criteria proposed by Levine et al. in 2011 and then utilized by Schiavon et al. in 2012, who found that extrapolating RECIST to an ellipsoid rather than a spherical volume was better correlated with survival and is a reasonable model system for tumors [8, 9]. The ellipsoid volumetric criteria, when calculated, had the same criteria as RECIST cut-off (Table 1).
Table 1: Methods of tumor measurement
and cut-off for the assessment of tumor response.
|
Criteria |
Partial
Response (PR) |
Progressive
Disease (PD) |
Stable
Disease (SD) |
|
RECIST
(2D) |
Decrease by 30% |
Increase by 20% |
Neither PR nor PD criteria met |
|
Volumetric
spherical (3D) |
Decrease by 65% |
Increase by 73% |
Neither PR nor PD criteria met |
|
Volumetric
ellipsoid (3D) |
Decrease by 30% |
Increase by 20% |
Neither PR nor PD criteria met |
V Statistical Analysis
First, interobserver agreement was calculated for each method by using the intraclass correlation coefficient (ICC). Bootstrapping methods were used to obtain 95% confidence intervals (CIs). Data were integrated into a correlation graphic. Then, we used the method published by Bland and Altman to assess the agreement between the two methods [10]. Therefore, we assessed intra-observer reproducibility for all patients by calculating the relative measurement of differences (RMD) corresponding to the variability of the RECIST-sum between the 2 readers, and the mean diameter as follows: RMD = (SOD2-SOD1) where SOD1 corresponds to the sum of the longest diameter measured by the first reader and SOD2 corresponds to the sum of the longest diameter measured by the second reader; and mean diameter corresponds to (SOD2+SOD1)/2. Then we repeated the analysis for the volumetric method (SOV instead of SOD). The 95% limits of agreement (LOA95%) were calculated, accounting for the distribution of tumor measurements. Data were integrated into a Bland and Altman plot. Statistical analyses were performed with the software R (version 3.6.1).
Results
I Population
14 patients were included in the study. Patients’ characteristics are summarized in (Table 2). Each patient had multiple CT examinations (3-16 examinations; mean 9 examinations) over the course of their treatment. A total of 45 target lesions were defined, leading to a total of 810 measurements performed per reader (405 unidimensional and volumetric measurements, respectively).
Table 2: Demographic and clinical
characteristics of the 14 Patients.
|
Median age - year |
64 (41-81) |
|
Male |
10 |
|
Female |
4 |
|
Number of target lesion per patient |
|
|
1 |
2 (2) |
|
2 |
8 (16) |
|
3 |
5 (15) |
|
4 |
3 (12) |
|
5 |
0 |
|
Sites
of metastasis |
|
|
lung |
11 |
|
pancreas |
10 |
|
Renal or adrenal |
7 |
|
Lymph node |
12 |
|
liver |
5 |
II Target Lesion Measurements
In volumetric method, the interobserver variability rate (using ICC) was 0.986 (95% CI: 0.980, 0.990). In RECIST method, interobserver variability rate (using ICC) was 0.903 (95% CI: 0.861, 0.928). Graphic correlations of these data are shown in (Figure 1). The interobserver agreement of RECIST 1.1 and volume measurement was also determined using the Bland and Altman method. Mean RMD of volume measurements was 0.8 % (upper LOA95%: 36.5; lower LOA95%: −35). The mean RMD of RECIST measurements was -5.1 % (upper LOA95%: 46; lower LOA95%: −57). Data are shown in (Figure 2).
III Response Assessment
The number of patients in each response category was calculated for each method (RECIST, volumetric ellipsoid and volumetric spherical) at every time point (Figure 3). Otherwise, we correlated each volumetric method with the gold standard RECIST 1.1 evaluation.
For the correlation between RECIST 1.1 versus spherical volumetric method: The progressive Disease (PD) was obtained earlier with the spherical volumetric method in 5 patients (36%) for both observers. In two patients (14%), one reader assessed PD earlier than RECIST 1.1. There was no difference in response assessment for 36% patients (n = 5) for both readers. The results were discordant for two patients (14%) because one reader assessed PD with RECIST 1.1 earlier and the other observer assessed PD earlier in the volumetric measurement.
For the partial response and the complete response (PR and CR), the results were similar for both readers with the two methods in 10 patients (71%). For two patients, results were discordant between the two observers because one assessed PR earlier in volumetric method, and the other one assessed PR earlier with RECIST 1.1. The two last patients were no responders.
For the correlation between RECIST 1.1 versus ellipsoidal volumetric method: The progressive disease (PD) was assessed earlier by both readers with volumetric method in 8 patients (57%). 4 patients were still in response at their end-point examination CT scanner. For the partial response and the complete response (PR and CR), both readers assessed PR earlier with the volumetric method in two patients (14%) For two patients (14%), one investigator assessed PR earlier too but it was not confirmed by the second observer. No difference was found for the 10 other patients. The mean time to progression has been calculated as an indicator of the intermediate endpoint. The mean time before progression was shorter with the volumetric method with 17 and 18 months for volumetric ellipsoid and spherical, respectively, against 22 months for RECIST 1.1 (Figure 4).

Figure 1: Inter-observer variability: scatter plot of SLV (a) and SLD (b) of first observer versus second observer in the entire cohort: a) ICC of volumetric method: 0.986 (95% CI: 0.980, 0.990); b) ICC of RECIST method: 0.903 (95% CI: 0.861, 0.928).

Figure 2: Bland and Altman plot of a) volumetric method and RECIST method b) demonstrating the overall inter-observer variability. Dash center lines represents the means of RMD ((a) bias = 0.805, (b) bias =-5.2)) between the two readers. Continuous lines indicate the 95% limit of agreement (upper and lower respectively) of relative measurement difference (RMD): With the probability of 95%, differences in normalized scores of future examinations will be between upper and lower limits of agreement (mean ± variability estimate = 1.96 SD).
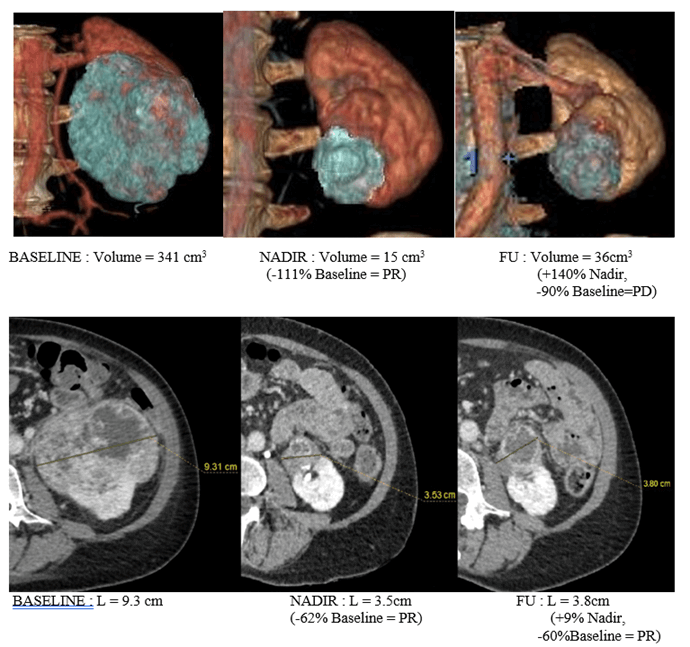
Figure 3: Comparison of unidimensional and volumetric measurement at three time-points. This figure shows a case where 3D measurement detects a progression disease whereas axial measurement does not. Images are shown in the coronal plane in Volume Rendering, and in the axial plane. This case illustrates the main interest of volumetry: assessment of progression disease before unidimensional RECIST 1.1. This lesion is classified as PR at the last time-point (FU) according to RECIST, and as PD according to both volumetric methods (ellipsoidal and spherical).
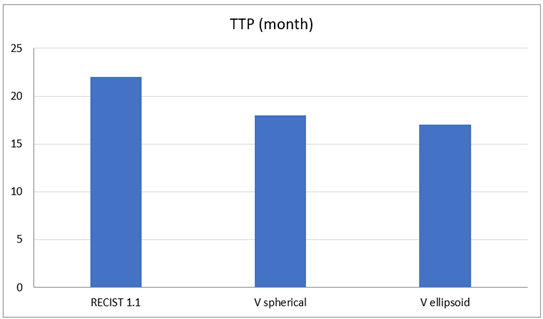
Figure 4: Comparison of the Time to Progression (TTP) according to the three methods: RECIST 1.1, Volume Spherical (Vspherical) and Volume Ellipsoid (Vellipsoid).
Discussion
To our knowledge, this work is the first study in RCC treated by immunotherapy to evaluate the inter-observer correlation between two measurements methods (RECIST 1.1 and volumetric) to appreciate the tumor burden. In this retrospective work, we found that the volumetric assessment is highly reproducible with a low bias inter-observer (mean RMD) of 0.8% (upper LOA95%: 36.5; lower LOA95%: −35), and an excellent degree of agreement (ICC 0.986).
Our results are consistent with previous reports evaluating the reproducibility of the volumetry to perform the follow up of pulmonary nodules, lymph nodes, hepatic lesions, and pancreatic cyst [11-15]. These results suggest a higher reliability than that of the conventional unidimensional RECIST 1.1 method with a mean RMD of -5.1% and wider LOA95%.(upper LOA95%: 46; lower LOA95%: −57), and an lower ICC of 0.903. Nevertheless in our cohort of patients, RECIST 1.1 inter-observer agreement was acceptable and even better than other reports in which the inter-observer agreement in the sum of longest diameter (RECIST) reached 24% and 20%, revealing the potential risk of misclassification of the overall tumoral response according to the RECIST 1.1 guidelines [16, 17].
The relatively good agreement in unidimensional measures assessment between our observers could be explained by an identical approach and training for this purpose in the same onco-imaging center and by the fact that targets were determined prior to the study. The second main result of our study is that the volumetric method seems to predict earlier the progression of the disease than the RECIST 1.1 evaluation (36% patients with spherical volumetric method, and 57% patients with ellipsoidal volumetric method). It seems to be an important clinical outcome because it suggests that patients may be treated with potentially suboptimal therapy for a longer duration if RECIST 1.1 is used for the assessment of the tumor burden. This is concordant with the study of Force et al., who identified progressive disease more often and earlier in the volumetric method than RECIST 1.1 in advanced thymic cancers in 37% patients [18]. Our results confirm the strength of the volumetric criteria, especially ellipsoidal volumetric method. Indeed, using extrapolated volumetric cut-off criteria based on a hypothesized ellipsoid shape is more logical and more representative as tumors are commonly not perfectly spherical in shape and an irregular volume such as an ellipsoid is likely to be closer to the true shape of the lesion. Hayes et al., in lung cancer, and Schiavon et al., in metastatic GIST, demonstrated that ellipsoidal volumetric criteria is a better prognostic indicator of overall survival than the criteria based on a spherical volume [9, 19].
Other studies also suggested that 3D measurement seems to be more accurate and more sensitive to changes in tumor burden. Zhao et al., in lung cancer, demonstrated that changes in tumor volume can be assessed as early as 3 weeks after initiation of treatment, whereas a lower magnitude of changes in unidimensional (and bidimensional measurements) was seen during the same time period. Schwartz et al., in a study of patients with metastatic gastric cancer, also noticed that volumetric change in tumor size appears to predict a clinical response earlier than RECIST 1.1 criteria in the majority of cases [20, 21].
In our study, there was no significant difference in partial response criteria between the three methods. One explanation could be that responders to immunotherapy had a major decrease in tumor burden on the first and second follow up after initiating treatment. Most of the radiological workstations used semi-automatic volumetric software. In our experience this type of software is not able to delimitate the precisely and accurately the lesions. The manual segmentation is finally more efficient, even if it is slightly more time-consuming than an automatic process. However even if unidimensional measurement is still the easiest and shortest way to estimate tumor burden, volumetric measures are becoming feasible in clinical routine practice with recent advanced 3D visualization platforms [22, 23].
This work has some limitations: First, we are aware of the small size of our cohort of patients; however, we have performed a large number of measurements. Second, although we showed that the inter-observer reliability in the volumetric method is better than RECIST, we didn’t correlate those data to the overall survival (OS) or progression-free survival (PFS), which are best-existing end-points. Although it seems that volumetric measures would predict earlier PD in patients, we are unable to answer the question of whether earlier detection of the progressive disease affects the overall survival of these patients.
Conclusion
In advanced renal cancer, the inter-observer reproducibility of the volumetric method is higher than with RECIST measurements. This volumetric assessment seems to predict earlier a progression of the disease than RECIST, especially with ellipsoidal volumetric criteria.
Abbreviation
RCC: Renal Cell Carcinoma
CT: Computed Tomography
MDCT: Multidetector Computed Tomography
Article Info
Article Type
Research ArticlePublication history
Received: Sat 09, Jul 2022Accepted: Mon 25, Jul 2022
Published: Fri 05, Aug 2022
Copyright
© 2023 Catherine Roy. This is an open-access article distributed under the terms of the Creative Commons Attribution License, which permits unrestricted use, distribution, and reproduction in any medium, provided the original author and source are credited. Hosting by Science Repository.DOI: 10.31487/j.COR.2022.03.03
Figures & Tables
Table 1: Methods of tumor measurement
and cut-off for the assessment of tumor response.
|
Criteria |
Partial
Response (PR) |
Progressive
Disease (PD) |
Stable
Disease (SD) |
|
RECIST
(2D) |
Decrease by 30% |
Increase by 20% |
Neither PR nor PD criteria met |
|
Volumetric
spherical (3D) |
Decrease by 65% |
Increase by 73% |
Neither PR nor PD criteria met |
|
Volumetric
ellipsoid (3D) |
Decrease by 30% |
Increase by 20% |
Neither PR nor PD criteria met |
Table 2: Demographic and clinical
characteristics of the 14 Patients.
|
Median age - year |
64 (41-81) |
|
Male |
10 |
|
Female |
4 |
|
Number of target lesion per patient |
|
|
1 |
2 (2) |
|
2 |
8 (16) |
|
3 |
5 (15) |
|
4 |
3 (12) |
|
5 |
0 |
|
Sites
of metastasis |
|
|
lung |
11 |
|
pancreas |
10 |
|
Renal or adrenal |
7 |
|
Lymph node |
12 |
|
liver |
5 |
References
1.
Escudier B, Porta C,
Schmidinger M, Rioux-Leclercq N, Bex A et al. (2019) Renal Cell Carcinoma: ESMO
Clinical Practice Guidelines for diagnosis, treatment and follow-up. Ann
Oncol 30: 706-720. [Crossref]
2.
Siegel RL, Miller KD,
Jemal A (2016) Cancer statistics, 2016. CA Cancer J Clin 66: 7-30. [Crossref]
3.
Motzer RJ, Michaelson
MD, Redman BG, Hudes GR, Wilding G et al. (2006) Activity of SU11248, a
multitargeted inhibitor of vascular endothelial growth factor receptor and
platelet-derived growth factor receptor, in patients with metastatic renal cell
carcinoma. J Clin Oncol 24: 16‑24. [Crossref]
4.
Motzer RJ, Escudier B,
McDermott DF, George S, Hammers HJ et al. (2015) Nivolumab versus Everolimus in
Advanced Renal-Cell Carcinoma. N Engl J Med 373: 1803‑1813. [Crossref]
5.
Therasse P, Arbuck SG,
Eisenhauer EA, Wanders J, Kaplan RS et al. (2000) New guidelines to evaluate
the response to treatment in solid tumors. European Organization for Research
and Treatment of Cancer, National Cancer Institute of the United States,
National Cancer Institute of Canada. J Natl Cancer Inst 92: 205‑216. [Crossref]
6.
Eisenhauer EA,
Therasse P, Bogaerts J, Schwartz LH, Sargent D et al. (2009) New response
evaluation criteria in solid tumours: revised RECIST guideline (version 1.1). Eur
J Cancer 45: 228‑247. [Crossref]
7.
Liu Y, Litière S, de
Vries EG, Sargent D, Shankar L et al. (2014) The role of response evaluation
criteria in solid tumour in anticancer treatment evaluation: results of a
survey in the oncology community. Eur J Cancer 50: 260‑266. [Crossref]
8.
Levine ZH, Galloway
BR, Peskin AP, Heussel CP, Chen JJ (2011) Tumor volume measurement errors of
RECIST studied with ellipsoids. Med Phys 38: 2552‑2557. [Crossref]
9.
Schiavon G, Ruggiero
A, Schöffski P, van der Holt B, Bekers DJ et al. (2012) Tumor volume as an
alternative response measurement for imatinib treated GIST patients. PloS
One 7: e48372. [Crossref]
10. Bland JM, Altman DG (1986) Statistical methods for assessing agreement
between two methods of clinical measurement. Lancet 1: 307‑310. [Crossref]
11. Wormanns D, Kohl G, Klotz E, Marheine A, Beyer F et al. (2004) Volumetric
measurements of pulmonary nodules at multi-row detector CT: in vivo
reproducibility. Eur Radiol 14: 86‑92. [Crossref].
12. Guo X, Wang Y, Li D, Zhang C, Cao Y et al. (2014) [The intra-observer
variability of volumetric measurement of pulmonary nodules: comparison of
two-dimensional and three-dimensional method]. Zhongguo Fei Ai Za Zhi
17: 336‑341. [Crossref]
13. Chalian H, Seyal AR, Rezai P, Töre HG, Miller FH et al. (2014) Pancreatic
mucinous cystic neoplasm size using CT volumetry, spherical and ellipsoid
formulas: validation study. JOP 15: 25‑32. [Crossref]
14. Buerke B, Puesken M, Müter S, Weckesser M, Gerss J et al. (2010)
Measurement accuracy and reproducibility of semiautomated metric and volumetric
lymph node analysis in MDCT. AJR Am J Roentgenol 195: 979‑985. [Crossref]
15. Keil S, Plumhans C, Behrendt FF, Stanzel S, Suehling M et al. (2009)
Semi-automated quantification of hepatic lesions in a phantom. Invest Radiol
44: 82‑88. [Crossref]
16. Yoon SH, Kim KW, Goo JM, Kim D-W, Hahn S (2016) Observer variability in
RECIST-based tumour burden measurements: a meta-analysis. Eur J Cancer 53:
5‑15. [Crossref]
17. Muenzel D, Engels H-P, Bruegel M, Kehl V, Rummeny EJ et al. (2012) Intra-
and inter-observer variability in measurement of target lesions: implication on
response evaluation according to RECIST 1.1. Radiol Oncol 46: 8‑18. [Crossref]
18. Force J, Rajan A, Dombi E, Steinberg SM, Giaccone G (2011) Assessment of
objective responses using volumetric evaluation in advanced thymic malignancies
and metastatic non-small cell lung cancer. J Thorac Oncol 6: 1267‑1273. [Crossref]
19. Hayes SA, Pietanza MC, O’Driscoll D, Zheng J, Moskowitz CS et al. (2016)
Comparison of CT volumetric measurement with RECIST response in patients with
lung cancer. Eur J Radiol 85: 524‑533. [Crossref]
20. Zhao B, Schwartz LH, Moskowitz CS, Ginsberg MS, Rizvi NA et al. (2006) Lung
cancer: computerized quantification of tumor response--initial results. Radiology
241: 892‑898. [Crossref]
21. Schwartz LH, Curran S, Trocola R, Randazzo J, Ilson D et al. (2007)
Volumetric 3D CT analysis - an early predictor of response to therapy. J
Clin Oncol 25: 4576‑4576.
22. Prasad SR, Jhaveri KS, Saini S, Hahn PF, Halpern EF et al. (2002) CT tumor measurement for therapeutic response assessment: comparison of unidimensional, bidimensional, and volumetric techniques initial observations. Radiology 225: 416‑419. [Crossref]
23. Tran LN, Brown MS, Goldin JG, Yan X, Pais RC et al. (2004) Comparison of treatment response classifications between unidimensional, bidimensional, and volumetric measurements of metastatic lung lesions on chest computed tomography. Acad Radiol 11: 1355‑1360. [Crossref]