Association of Health-Related Quality of Life with Breast Cancer Survival among Hispanic Population Using 10 Years of MEPS National Sample Cohort Data
A B S T R A C T
Background: Breast cancer is the most commonly diagnosed cancer among women in the United States and it is the leading cause of death among the Hispanic population. Little evidence exists the association of health-related quality of life (HRQoL) by the presence of breast cancer survival among the Latina population. This study was to look at the association of the presence of breast cancer survival on HRQoL measure in the US Hispanic population.
Methods: This was a cross-sectional study analyzing data from the 2006-2015 Medical Expenditure Panel Survey (MEPS). The target population was comprised of Hispanic community-dwelling residents with breast cancer in the US. Two multivariate regression models were used to predict HRQoL measure by the presence of breast cancer survival among the Hispanic population.
Results: A total 207 breast cancer survivors met the study inclusion criteria, and the estimated population size was 1.200,337 breast cancer survivors. In the multiple regression analysis on the SF-12 PCS scores, age, census region, poverty level, perceived health status, BMI, and employment were associated with SF-12 PCS scores. The multiple regression analysis on the SF-12 MCS scores presented that age, census region, insurance type, perceived mental health status, and CCI were associated with SF-12 MCS scores.
Conclusion: This study presents data on the HRQoL of Hispanic breast cancer survivors in the U.S. It builds on previous research that examines the HRQoL as expressed through the SF-12 PCS and SF-12 MCS surveys, rather than other types of measurement. This study may also be used as a guide in the implementation of clinical interventions and plans for survivorship care in improving the HRQoL of Hispanic breast cancer survivors.
Keywords
Breast cancer survivors, HRQoL, Hispanic population
Introduction
Breast cancer is the most commonly diagnosed cancer among women in the United States and it is the leading cause of death among the Hispanic population. The incidence of breast cancer in the U.S. is amongst the highest in the world. It is predicted that there will be about 268,600 new breast cancer cases and that the disease will cause about 41,760 deaths in women in the U.S. in 2019 [1-3]. In the U.S., it is reported that about 1 in 8 will develop breast cancer during their lifetime [1].These statistical facts show similar trends in the Hispanic/Latino population, a group which is considered to be one of the fastest growing minorities as well as the largest and youngest minority group in the U.S [4]. It is estimated that about 1 in 10 Hispanic women living in the U.S. will develop breast cancer in their lifetime [4, 5]. In the diagnosis, treatment, screening and recurrence of breast cancer, different factors such as anxiety and other comorbidities, are observed to play a significant effect on the patient’s health outcomes, either causing a delay in or disregard of preventative measures [6]. The various other factors, to a certain degree, can dramatically interfere with the health-related quality of life (HRQoL) in breast cancer survivors.
Today, even as improvements in early detection and treatment of breast cancer have now resulted in a greater number of women being diagnosed earlier and are living longer after diagnosis [7]. Breast cancer survivors were still reported to have a decreased physical, mental, emotional and social functioning as compared to the general population without cancer. An assessment of patients’ quality of life has been shown to contribute to their improved treatment and could further be used to predict the chance of recovery or relapse from the disease [7, 8]. In past research on cancer, HRQoL has been considered to be an important end-point [9]. The HRQoL assessment generally takes into account levels of physical, mental, social, and role functioning, including abilities, relationships, perceptions, life satisfaction, and well-being [10]. In the case of Hispanic women with breast cancer, we take into account the following to be predictors of HRQoL: predisposing factors such as gender, race, ethnicity, and age; enabling factors such as marital status, education, employment, poverty status, insurance coverage, and usual source of care; health care maintenance needs on perceived physical and mental health status, BMI, and other chronic conditions; personal health practices such as smoking status; and external environment or geographical location.
A review of the literature on cancer survivorship suggests the need to investigate the long-term outcomes related to the physical, mental and social aspects associated with HRQoL in breast cancer survivors [11-14]. There is also a need to look into the disparities in access to screening, diagnosis, care and treatment that the Hispanic/Latino population continues to experience that seems to result in lower HRQoL in breast cancer survivors in this group [5, 15-17]. In addition, certain lifestyle factors, such as weight management, obesity and an unhealthy lifestyle, income, sociodemographic factors, comorbidities, age at first birth, number of children, and length of breastfeeding, and a person’s cultural or ethnic background or region, was significantly related to lower HRQoL in this population [18, 19]. Other studies further elucidate the greater degree of unmet supportive care needs in this population compared to non-Hispanic/Latino white women and how this affects both satisfaction with cancer care as well as health-related quality of life in this group [5, 16, 17, 20, 21]. This further supports the fact that more quantitative research is needed for a better understanding of the topic [14, 22, 23]. Over the past ten years, a lot of advances and clinical trials has been directed to the treatment of breast cancer in order to improve survival [7]. However, it is important to note that assessment of factors related to HRQoL will contribute to the improved outcomes in breast cancer care, both during treatment, remission, and survival. As the expected number of breast cancer incidences and survivors from this population continues to rise, a closer investigation into the factors that affect their health-related quality of life is becoming more important. The primary objective of this study was to investigate which factors have a significant effect on the health-related quality of life among breast cancer survivors in the US Hispanic population. It also aimed to further identify which of these factors had the greatest impact on the health-related quality of life among breast cancer survivors from this population.
Methods
I Data Source
As a retrospective data study, data from the 2006-2015 Medical Expenditure Panel Survey (MEPS) were used for these analyses. MEPS is a set of large-scale surveys of families and individuals, their medical providers, including doctors, hospitals, and pharmacies, and employers across the United States [24]. MEPS is a complete source of data on the cost and use of health care and health insurance coverage [24]. The analytic focus of MEPS has been directed to the topics of health care access, coverage, cost, self-or caregiver-reported information [25]. Also, MEPS provides continuous and current estimates of healthcare utilization and expenditure at both the individual and household level for two panels for each calendar year [26, 27]. Institutional Review Board (IRB) approval was waived since MEPS data is publicly available de-identified data.
II Patient Selection and Outcomes Measures
Patients with a diagnosis of breast cancer (International Classification of Diseases, ninth Revision, Clinical Modification [ICD-9-CM] code: 174; or Clinical Classification Code [CCC]: 024) were identified. Only Hispanic patients, including Puerto Rican, Cuban/Cuban American, Dominican, Mexican/Mexican American, Central or South American, and other Latin American were selected using Hispanic ethnicity variables (HISPANX). Patients should have at least one SF-12 PCS or MCS scores and aged more than 18 years were included in the analyses.
The 12-Item Short-Form Health Survey (SF-12) is weighted and summed to provide easily interpretable scales for physical and mental health. The SF-12 questions are as follows [28]:
i. General health today
ii. During a typical day, limitations in moderate activities
iii. During a typical day, limitations in climbing several flights of stairs
iv. During the past 4 weeks, as result of physical health, accomplished less than would like
v. During the past 4 weeks, as result of physical health, limited in kind of work or other activities
vi. During the past 4 weeks, as result of mental problems, accomplished less than you would like
vii. During the past 4 weeks, as result of mental problems, did work or other activities less carefully than usual
viii. During the past 4 weeks, pain interfered with normal work outside the home and housework
ix. During the past 4 weeks, felt calm and peaceful
x. During the past 4 weeks, had a lot of energy
xi. During the past 4 weeks, felt downhearted and depressed
xii. During the past 4 weeks, physical health or emotional problems interfered with social activities
The PCS and MCS are computed using the scores of twelve questions, which have three or five-level Likert scale, where a lower score indicates the lowest level of health measured by the scales and a high score indicates the highest level of health [28]. The scoring algorithms for both the PCS and MCS incorporate information from all questions. The PCS weights more heavily were addressed for the following questions: 1, 2, 3, 4, 5, and 8, while the MCS weights more heavily responded to the following questions: 6, 7, 9, 11, and 12 [24]. Andersen's behavioural model was used to assess factors associated with QOL in breast cancer survivors [29]. Independent variables were derived from the conceptual framework, using five predictors: 1) predisposing—race, Hispanic ethnicity, and age; 2) enabling—marital status, education, employment, poverty status, insurance coverage, and usual source of care; 3) need—perceived physical and mental health status, body mass index (BMI), Charlson Comorbidity Index (CCI), other chronic conditions; 4) personal health practices—smoking status; and 5) external environment—geographical region.
Factors variables were created for each mutually exclusive demographic category: age in years (<18, 18-44, 56-64); race (Hispanic-White, other/multiple races); educational status (no degree or less than high school, high school, some college); region (Northeast, Midwest, South, West); marital status (married, unmarried (widowed, divorced/separated, never married)); smoking (yes, no); health insurance status (public, private, uninsured); poverty level (poor/low income (less than 200%), middle income (200% to less than 400%), high income (greater than or equal to 400%)); perceived health status (fair/poor, good, excellent/very good); perceived mental Health Status (fair/poor, good, excellent/very good); BMI (underweight/normal less than 24.9, overweight 25.0-29.9, obese more than 30.0); employment (yes, no); CCI (0, 1-2, more than 3).
III Statistical Analyses
Because MEPS employed complex, multistage sampling design, to represent the overall population, responses of the surveyed individuals need to be weighted by the proportion of the population they represent. The person weights provided in the MEPS were used to derive national estimates of demographics and socioeconomics covariates. The number of respondents with breast cancer and the weighted sample size were presented. The SF-12 scores were weighted using special weight variables, which were designed to be used with the self-administration questionnaire (SAQ) for persons who aged 18 and older at the interview date. This weight adjusts for SAQ non-respondents and weights to the U.S. civilian noninstitutionalized population [24]. The multivariate regression models were performed to predict MCS and PCS scores among the Hispanic population controlling for covariates. An accurate point estimates and its standard errors for the nationally representative population incorporating the MEPS survey weights were calculated using the ‘proc survey’ procedure of SAS and the ‘svy’ procedure of Stata [30]. All analyses were conducted using SAS version 9.4 (SAS Institute Inc., Cary, NC) and Stata version 12 (Stata Corp. LP, College Station, TX). All statistical analyses were 2-tailed, and the significance level was set a priori at P < 0.05.
Results
In total, 332,284 (weighted sample size: 3,100,387,956) respondents with positive individual weight were identified from 2006 to 2015. A total of 207 (weighted sample size: 1,200,337) patients were included in the analysis after applying inclusion criteria.
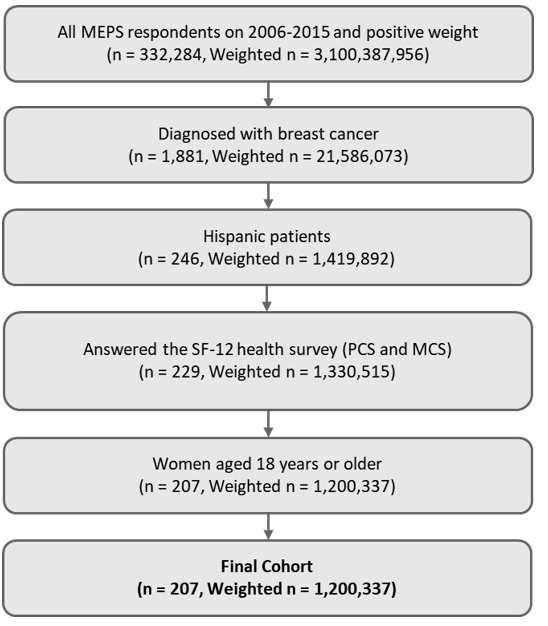
Figure 1: Patient Attrition.
28 SF-12: 12-Item Short Form Health Survey; MCS: Mental Component Summary; PCS: Physical Component Summary.
The majority of patients’ Hispanic ethnicity was Mexican or Mexican American (46.3%), following Cuban or Dominican (23.4%). The mean age (standard deviation [SD]) for study patients was 56.76 (1.52) years. Most patients were Hispanic-white (92.3%) and educated higher than college (41.2%). More than 54% of patients married 93% of patients and do not smoke currently in years of interest. Among insurance types, 49.7% of patients had private insurance and 46.8% had public insurance such as Medicare or Medicaid. 44.9% of patients were poor or low income and 57.4% of patients were not employed. Majority of patients perceived their overall health status as fair or poor state (43.2%), while 46.0% of patients answered their mental health status was ‘excellent or very good’. For continuous CCI and BMI, patients had, on average, 2.08 (SE 0.14) and 29.52 (SE 0.7).
Table 1: Demographics and Clinics Characteristics of Breast Cancer population.
|
Category |
N |
Weighted N |
Weighted Percent (%) |
|
|
Overall |
207 |
1,200,337 |
100.0 |
|
|
Hispanic ethnicity |
Mexican/Mexican American/Chicano |
91 |
556,156 |
46.3 |
|
Puerto Rican |
34 |
183,031 |
15.2 |
|
|
Cuban/Dominican/Central or South America |
51 |
281,388 |
23.4 |
|
|
Other Latin America/Latino/Spanish |
31 |
179,762 |
15.0 |
|
|
Age |
Mean (SE)1 |
56.76 (1.52) |
||
|
18-44 |
39 |
259,675 |
21.6 |
|
|
45-64 |
103 |
575,369 |
47.9 |
|
|
>65 |
65 |
365,293 |
30.4 |
|
|
Race |
Hispanic-White |
193 |
1,107,396 |
92.3 |
|
Other/Multiple |
14 |
92,942 |
7.7 |
|
|
Education |
No degree or Less than high school |
73 |
363,076 |
30.2 |
|
High school |
58 |
342,177 |
28.5 |
|
|
Some college |
76 |
495,084 |
41.2 |
|
|
Region |
Northeast |
58 |
333,336 |
27.8 |
|
Midwest |
16 |
71,742 |
6.0 |
|
|
South |
64 |
346,472 |
28.9 |
|
|
West |
69 |
448,787 |
37.4 |
|
|
Marital status |
Married |
107 |
657,637 |
54.8 |
|
Unmarried |
100 |
542,701 |
45.2 |
|
|
Smoking |
Yes |
18 |
74,982 |
6.2 |
|
No |
189 |
1,125,355 |
93.8 |
|
|
Insurance |
Any private |
81 |
596,715 |
49.7 |
|
Public only |
116 |
561,154 |
46.8 |
|
|
Uninsured |
10 |
42,468 |
3.5 |
|
|
Poverty level |
Poor/Low income |
112 |
538,380 |
44.9 |
|
Middle income |
55 |
340,112 |
28.3 |
|
|
High income |
40 |
321,845 |
26.8 |
|
|
Perceived Health Status |
Fair / Poor |
97 |
518,368 |
43.2 |
|
Good |
68 |
387,866 |
32.3 |
|
|
Excellent / Very Good |
42 |
294,103 |
24.5 |
|
|
Mental Health Status |
Fair / Poor |
50 |
241,462 |
20.1 |
|
Good |
73 |
406,421 |
33.9 |
|
|
Excellent / Very Good |
84 |
552,454 |
46.0 |
|
|
BMI |
Mean (SE)1 |
29.52 (0.7) |
||
|
Underweight/Normal <=24.9 |
54 |
333,335 |
27.8 |
|
|
Overweight 25.0-29.9 |
66 |
363,759 |
30.3 |
|
|
Obese ≥30.0 |
87 |
503,243 |
41.9 |
|
|
Employment |
Employed |
70 |
510,795 |
42.6 |
|
Not employed |
137 |
689,542 |
57.4 |
|
|
Having USC |
Yes |
194 |
1,084,207 |
90.3 |
|
No |
13 |
116,130 |
9.7 |
|
|
CCI |
Mean (SE)1 |
2.08 (0.14) |
||
|
0 |
39 |
210,763 |
17.6 |
|
|
1-2 |
102 |
608,893 |
50.7 |
|
|
>=3 |
66 |
380,681 |
31.7 |
|
1 For continuous variables, mean and SE was calculated based on the weighted sample.
BMI: body Mass Index; CCI: Charlson Comorbidity Index; SE: Standard error.
Table 2 showed the unadjusted SF-12 scores PCS and MCS among Hispanic patients with breast cancer. Overall, an average of SF-12 PCS was 41.52 (95% CI: 39.07-43.98). Patients aged 18-44 had higher score than more than 65 years old patients (47.76 (95% CI: 43.69-51.84) vs. 36.92 (95% CI: 32.13-41.72)). Patients with high income had 47.54 (95% CI: 43.10-51.98), while low income group had 38.88 (95% CI: 35.44-42.31). Patients who perceived excellent or very good health status had higher PCS compared to those with fair or poor health status (49.46 (95% CI: 46.27-52.65) vs. 36.66 (95% CI: 32.85-40.48)). The PCS scores were 36.78 (95% CI: 33.66-39.91) for unemployed patients and 47.99 (95% CI: 44.94-51.04) for employed patients.
The result of SF-12 MCS showed that, in total, Hispanic patients with breast cancer was 47.30 (95% CI: 45.38-49.22). Regarding census region, patients who reside in the West region had the highest PCS scores (50.06 (95% CI: 47.08-53.04)). Patients who have no insurance answered lower MCS scores than private or public insurance (43.51 (95% CI: 40.73-46.29) vs. 52.81 (95% CI: 46.51-59.12) and 50.61 (95% CI: 48.55-52.67), respectively). Patients who perceived that mental health status is fair or poor had lower MCS scores compared to excellent or very good mental health status (38.23 (95% CI: 33.49-42.97) vs. 52.58 (95% CI: 50.90-54.25)). Patients having less comorbidities (lower CCI) responded lower MCS scores than more comorbidities (50.94 (95% CI: 47.54-54.35) vs. 42.49 (95% CI: 39.23-45.75)).
Table 2: Unadjusted SF-12 Physical and Mental Health Component Summary.
|
Category |
Physical Component Summary (PCS) |
Mental Component Summary (MCS) |
|||||
|
Mean |
Lower 95% CI |
Upper 95% CI |
Mean |
Lower 95% CI |
Upper 95% CI |
||
|
Overall |
41.52 |
39.07 |
43.98 |
47.30 |
45.38 |
49.22 |
|
|
Hispanic ethnicity |
Mexican/Mexican American/Chicano |
40.99 |
36.45 |
45.52 |
48.70 |
46.22 |
51.18 |
|
Puerto Rican |
42.78 |
38.53 |
47.03 |
46.32 |
39.95 |
52.70 |
|
|
Cuban/Dominican/Central or South America |
43.33 |
39.39 |
47.28 |
46.40 |
42.42 |
50.38 |
|
|
Other Latin America/Latino/Spanish |
38.88 |
33.26 |
44.50 |
45.41 |
41.99 |
48.83 |
|
|
Age |
18-44 |
47.76 |
43.69 |
51.84 |
49.19 |
45.37 |
53.00 |
|
45-64 |
41.72 |
38.75 |
44.69 |
45.07 |
42.47 |
47.66 |
|
|
>65 |
36.92 |
32.13 |
41.72 |
49.51 |
45.96 |
53.06 |
|
|
Race |
Hispanic-White |
41.65 |
39.13 |
44.17 |
47.13 |
45.13 |
49.13 |
|
Other/Multiple |
40.00 |
31.35 |
48.66 |
49.29 |
43.26 |
55.33 |
|
|
Education |
No degree or Less than high school |
40.76 |
35.82 |
45.69 |
45.64 |
41.99 |
49.29 |
|
High school |
42.34 |
38.89 |
45.79 |
46.89 |
43.80 |
49.98 |
|
|
Some college |
41.54 |
37.50 |
45.58 |
48.84 |
45.95 |
51.74 |
|
|
Region |
Northeast |
41.19 |
37.50 |
44.88 |
44.39 |
40.18 |
48.60 |
|
Midwest |
38.41 |
32.01 |
44.81 |
44.66 |
39.40 |
49.91 |
|
|
South |
42.92 |
39.08 |
46.76 |
47.08 |
44.59 |
49.57 |
|
|
West |
41.22 |
36.21 |
46.23 |
50.06 |
47.08 |
53.04 |
|
|
Marital status |
Married |
42.84 |
39.92 |
45.76 |
47.88 |
45.32 |
50.45 |
|
Unmarried |
39.94 |
36.15 |
43.74 |
46.59 |
43.81 |
49.38 |
|
|
Smoking |
Yes |
36.11 |
30.72 |
41.50 |
36.10 |
32.05 |
40.15 |
|
No |
41.87 |
39.34 |
44.40 |
48.01 |
46.03 |
50.00 |
|
|
Insurance |
Any private |
44.94 |
41.58 |
48.31 |
52.81 |
46.51 |
59.12 |
|
Public only |
43.48 |
35.43 |
51.53 |
50.61 |
48.55 |
52.67 |
|
|
Uninsured |
37.88 |
34.08 |
41.69 |
43.51 |
40.73 |
46.29 |
|
|
Poverty level |
Poor/Low income |
38.88 |
35.44 |
42.31 |
43.74 |
40.82 |
46.67 |
|
Middle income |
39.90 |
36.65 |
43.15 |
47.93 |
45.03 |
50.83 |
|
|
High income |
47.54 |
43.10 |
51.98 |
52.50 |
49.73 |
55.27 |
|
|
Perceived Health Status |
Fair / Poor |
36.66 |
32.85 |
40.48 |
43.83 |
40.77 |
46.90 |
|
Good |
42.09 |
39.09 |
45.08 |
48.38 |
45.95 |
50.80 |
|
|
Excellent / Very Good |
49.46 |
46.27 |
52.65 |
52.00 |
48.85 |
55.16 |
|
|
Perceived Mental Health Status |
Fair / Poor |
33.97 |
29.20 |
38.75 |
38.23 |
33.49 |
42.97 |
|
Good |
45.82 |
42.82 |
48.81 |
45.74 |
43.43 |
48.05 |
|
|
Excellent / Very Good |
40.36 |
37.14 |
43.57 |
52.58 |
50.90 |
54.25 |
|
|
BMI |
Underweight/Normal <=24.9 |
42.26 |
36.55 |
47.98 |
48.46 |
44.95 |
51.97 |
|
Overweight 25.0-29.9 |
43.69 |
40.99 |
46.39 |
49.05 |
45.76 |
52.34 |
|
|
Obese ≥30.0 |
39.49 |
36.09 |
42.89 |
45.27 |
42.40 |
48.14 |
|
|
Employment |
Employed |
47.99 |
44.94 |
51.04 |
50.29 |
48.23 |
52.35 |
|
Not employed |
36.78 |
33.66 |
39.91 |
45.11 |
42.50 |
47.71 |
|
|
Having USC |
Yes |
41.07 |
38.57 |
43.58 |
46.98 |
44.93 |
49.02 |
|
No |
45.81 |
38.84 |
52.78 |
50.37 |
45.92 |
54.81 |
|
|
CCI |
0 |
43.77 |
37.73 |
49.81 |
50.94 |
47.54 |
54.35 |
|
1-2 |
42.38 |
39.36 |
45.40 |
48.97 |
46.58 |
51.36 |
|
|
>=3 |
38.84 |
35.02 |
42.66 |
42.49 |
39.23 |
45.75 |
|
BMI: body Mass Index; CI: Confidence Interval; CCI: Charlson Comorbidity Index; SE: Standard error; SF-12: 12-Item Short Form Health Survey; USC: Usual Source of Care.
Table 3 summarized the findings pertaining to the factors associated with HRQoL in the Hispanic population with breast cancer using the multiple regression analysis. In the multiple regression analysis on the SF-12 PCS scores, age, census region, poverty level, perceived health status, BMI, and employment were associated with SF-12 PCS scores. The PCS scores in patients aged 18-44 were significantly higher by 6.76 compared to elderly group, controlling for covariates (β=6.76, SE=2.70, p=0.013). The poverty level had an impact on the PCS: patients with poor or low income reported significantly lower scores than those with high income (β=-4.81, SE=2.41, p=0.047). The level of perceived health status was positively associated with PSC scores. Patients perceiving fair or poor health status showed 7.6 lower scores compared to excellent or very good health status (β=-7.59, SE=2.67, p=0.005). Obesity patients also had lower scores than overweighed patients (β=-5.00, SE=1.77, p=0.005). The PCS scores for employed patients were higher than those of non-employed patients (β=6.51, SE=2.16, p=0.003). The multiple regression analysis on the SF-12 MCS scores presented that age, census region, insurance type, perceived mental health status, and CCI were associated with SF-12 MCS scores. Patients aged 18-44 had lower MCS scores than more than 65 aged patients (β=-5.98, SE=2.00, p=0.003). In addition, 45-64 aged patients had 7 lower scores than elderly (β=-7.10, SE=1.63, p<0.001). Compared to patients who reside in West areas, Midwest or South area had significantly lower scores (p<0.05). Insurance type was a significant factor for SF-12 MCS scores. Private or public insurance was associated with higher MCS scores (β=11.38, SE=3.60, p=0.002; β=5.00, SE=2.24, p=0.026, respectively). Patients with worse perceived mental health status showed lower scores (β=-10.80, SE=2.88, p<0.001). Less comorbidities were associated with higher MCS scores (β=4.11, SE=1.85, p=0.027).
Table 3: Multivariate Regression of Physical Component Summary and Mental Component Summary on Hispanic Patients with Breast Cancer.
|
Category |
Physical Component Summary (PCS) |
Mental Component Summary (MCS) |
|||||||
|
Coefficient |
SE |
t |
p-value |
Coefficient |
SE |
t |
p-value |
||
|
Hispanic ethnicity |
Mexican/Mexican American/Chicano |
-0.511 |
2.711 |
-0.190 |
0.851 |
1.858 |
1.517 |
1.230 |
0.221 |
|
Puerto Rican |
2.174 |
3.121 |
0.700 |
0.487 |
2.130 |
2.267 |
0.940 |
0.348 |
|
|
Cuban/Dominican/Central or South America |
0.547 |
2.771 |
0.200 |
0.844 |
1.212 |
1.719 |
0.710 |
0.481 |
|
|
Other Latin America/Latino/Spanish |
Ref. |
Ref. |
|||||||
|
Age |
18-44 |
6.759 |
2.695 |
2.510 |
0.013 |
-5.981 |
1.999 |
-2.990 |
0.003 |
|
45-64 |
1.891 |
2.171 |
0.870 |
0.384 |
-7.099 |
1.632 |
-4.350 |
<.0001 |
|
|
>65 |
Ref. |
Ref. |
|||||||
|
Race |
Hispanic-White |
-1.948 |
4.260 |
-0.460 |
0.648 |
-3.427 |
2.427 |
-1.410 |
0.159 |
|
Other/Multiple |
Ref. |
Ref. |
|||||||
|
Education |
No degree or Less than high school |
4.015 |
2.583 |
1.550 |
0.121 |
0.901 |
1.933 |
0.470 |
0.641 |
|
High school |
-0.420 |
1.958 |
-0.210 |
0.830 |
-1.442 |
1.262 |
-1.140 |
0.254 |
|
|
Some college |
Ref. |
Ref. |
|||||||
|
Region |
Northeast |
-1.015 |
2.326 |
-0.440 |
0.663 |
-3.695 |
1.888 |
-1.960 |
0.051 |
|
Midwest |
-7.451 |
2.800 |
-2.660 |
0.008 |
-7.498 |
3.779 |
-1.980 |
0.048 |
|
|
South |
-0.866 |
2.010 |
-0.430 |
0.667 |
-4.296 |
1.420 |
-3.030 |
0.003 |
|
|
West |
Ref. |
Ref. |
|||||||
|
Marital status |
Married |
0.868 |
1.668 |
0.520 |
0.603 |
-1.696 |
1.581 |
-1.070 |
0.284 |
|
Unmarried |
Ref. |
Ref. |
|||||||
|
Smoking |
Yes |
-0.393 |
1.967 |
-0.200 |
0.842 |
-4.068 |
3.623 |
-1.120 |
0.262 |
|
No |
Ref. |
Ref. |
|||||||
|
Insurance |
Any private |
1.455 |
4.069 |
0.360 |
0.721 |
11.376 |
3.596 |
3.160 |
0.002 |
|
Public only |
0.166 |
3.297 |
0.050 |
0.960 |
4.991 |
2.235 |
2.230 |
0.026 |
|
|
Uninsured |
Ref. |
Ref. |
|||||||
|
Poverty level |
Poor/Low income |
-4.808 |
2.411 |
-1.990 |
0.047 |
-2.591 |
1.485 |
-1.740 |
0.082 |
|
Middle income |
-3.067 |
2.349 |
-1.310 |
0.192 |
-2.491 |
1.829 |
-1.360 |
0.174 |
|
|
High income |
Ref. |
Ref. |
|||||||
|
Perceived Health Status |
Fair / Poor |
-7.593 |
2.672 |
-2.840 |
0.005 |
-2.357 |
1.809 |
-1.300 |
0.193 |
|
Good |
-4.546 |
2.232 |
-2.040 |
0.042 |
-0.122 |
1.803 |
-0.070 |
0.946 |
|
|
Excellent / Very Good |
Ref. |
Ref. |
|||||||
|
Mental Health Status |
Fair / Poor |
-1.933 |
3.141 |
-0.620 |
0.539 |
-10.804 |
2.879 |
-3.750 |
0.000 |
|
Good |
1.052 |
2.140 |
0.490 |
0.623 |
-5.159 |
1.449 |
-3.560 |
0.000 |
|
|
Excellent / Very Good |
Ref. |
Ref. |
|||||||
|
BMI |
Underweight/Normal <=24.9 |
1.715 |
2.217 |
0.770 |
0.440 |
-1.037 |
1.888 |
-0.550 |
0.583 |
|
Overweight 25.0-29.9 |
4.978 |
1.774 |
2.810 |
0.005 |
-0.673 |
1.474 |
-0.460 |
0.648 |
|
|
Obese ≥30.0 |
Ref. |
Ref. |
|||||||
|
Employment |
Employed |
6.514 |
2.158 |
3.020 |
0.003 |
-1.185 |
1.512 |
-0.780 |
0.434 |
|
Not employed |
Ref. |
Ref. |
|||||||
|
Having USC |
Yes |
-3.840 |
2.601 |
-1.480 |
0.140 |
-3.765 |
2.711 |
-1.390 |
0.166 |
|
No |
Ref. |
Ref. |
|||||||
|
CCI |
0 |
-1.779 |
2.147 |
-0.830 |
0.408 |
4.113 |
1.851 |
2.220 |
0.027 |
|
1-2 |
-1.021 |
1.497 |
-0.680 |
0.496 |
4.580 |
1.747 |
2.620 |
0.009 |
|
|
>=3 |
Ref. |
Ref. |
|||||||
|
Constant |
48.553 |
8.890 |
5.460 |
<.0001 |
74.399 |
6.704 |
11.100 |
<.0001 |
|
1 GLM with gamma distribution and a log-link function was used.
2 Significant at P < 0.05 (in bold).
BMI: body Mass Index; CI: Confidence Interval; CCI: Charlson Comorbidity Index; SE: Standard error; USC: Usual Source of Care.
Discussion
Health-Related Quality of Life (HRQoL) is an extensive measurement of an individual’s subjective evaluation of his or her physical, emotional, and social well-being over time. In this study, it was utilized to measure how breast cancer has affected Hispanic women who survived the disease. The primary objective of the study was to determine the relationship between a breast cancer survivors’ HRQoL with five significant factors: 1) predisposing factors (gender, age, race, and ethnicity), 2) enabling factors (marital status, education, employment, economic status, insurance coverage and usual source of care), 3) need, 4) personal health practices, and 5) external environment. The secondary objective was to determine which of the given factors has the greatest impact on the health-related quality of life among breast cancer survivors from the US Hispanic Population. The results of the study showed that there is a correlation between the HRQoL of Hispanic women who are breast cancer survivors and the five significant factors.
In this study, differences in the association of the five significant factors on HRQoL across demographic and clinical subgroups of breast cancer survivors, including Hispanic ethnicity, age, race, education, region, marital status, smoking, insurance, poverty level, perceived health and mental status, BMI, employment, having Usual Source of Care (USC) and CCI, were identified. Despite the fact that the previous research has used different forms of questionnaires and scales, rather than the SF-12 MCS and SF-12 PCS, to measure HRQoL in cancer survivors, the findings were very similar to our finding that showed that the effect of age, census region, insurance type, perceived mental health status and CCI were associated with SF-12 MCS scores in breast cancer survivors [11-14]. Our study found that fair or poor perceived health or mental status were reported by 46.8% and 24.1% of survivors. These results correspond to a previous study that examined the effect of cancer on HRQoL which concluded that poor physical and mental HRQoL were reported by 24.5% and 10.1% of survivors, compared with 10.2% and 5.9% of adults without cancer. Even though this was a generalized study on all types of cancer, the adjusted mean mental and physical HRQoL scores were similar for breast cancer [11].
While we have identified various factors that negatively impact HRQoL, some factors that have a positive impact on HRQoL among breast cancer survivors include having psychosocial support [31]. It has been found that psychosocial support has had significant impact on the quality of life among cancer patients. For example, a previous study reported the importance of social integration by stating that, on average, socially isolated women were adversely affected by breast cancer. Socially isolated women presented with a lower role function, vitality, and physical function compared to more socially integrated women [31]. In the case of our breast cancer survivors in the Hispanic population, it was found in another research that, participating in community-based breast cancer awareness programs that are led by Hispanic/Latina women who were breast cancer survivors themselves has helped to significantly improve their survival and HRQoL [32]. This shows that cultural background, ethnicity, language and disease state played a role in positively impacting the HRQOL in this population.
In this study and any similar studies, the choice of outcome measure may have important effects on the results. HRQoL instruments are used based on the assumption that they are valid, reliable, and sensitive [33]. The SF-12 has been proven to be valid, reproducible and, useful in measuring the relationship between physical and mental health functioning and the social determinants of health [34]. While there are numerous strengths and limitations to this study, the form of measurement is very reliable.
Several limitations exist in this study. First, as this study is a cross-sectional study design, it is unable to explain causation. Thus, the interpretation of the result is limited to the association between the given significant factors and HRQoL. Second, there is a possibility of a recall bias since medical conditions in MEPS are self- or proxy- reported and not verified by chart review. Third, the study used a generic HRQoL instrument. Even though generic measures cover a broad range of HRQoL dimensions in a single instrument, they are less responsive than specific tools that focus on a particular disease. Lastly, there is a possibility that the CCI could not detect more common comorbidities that might influence the results of this study. Despite having these limitations, this study is among the first to investigate on the HRQoL of Hispanic breast cancer survivors in the U.S.
In conclusion, this study presents data on the HRQoL of Hispanic breast cancer survivors in the U.S. It builds on previous research that examines the HRQoL as expressed through the SF-12 PCS and SF-12 MCS surveys, rather than other types of measurement. Overall, lower HRQoL were observed in those of ages >65, from the Midwest region, unmarried, smoking, uninsured, poor or low income, fair or poor perceived health and mental status, obese, unemployed, having USC, and a CCI score index of > 3. Interestingly, among the factors that most negatively impacted HRQoL among breast cancer survivors were smoking and perceived mental health status which are under personal health practices.
This research can lead to a better understanding of the factors that have been presented and that its findings used in contributing towards improving the quality of life in breast cancer patients in this population. In addition, it may be used as a guide in the implementation of clinical interventions and plans for survivorship care in improving the HRQoL of Hispanic breast cancer survivors.
Conflicts of Interest
None.
Article Info
Article Type
Research ArticlePublication history
Received: Sat 11, Jul 2020Accepted: Mon 27, Jul 2020
Published: Thu 20, Aug 2020
Copyright
© 2023 Jongwha Chang. This is an open-access article distributed under the terms of the Creative Commons Attribution License, which permits unrestricted use, distribution, and reproduction in any medium, provided the original author and source are credited. Hosting by Science Repository.DOI: 10.31487/j.COR.2020.08.08
Figures & Tables
Table 1: Demographics and Clinics Characteristics of Breast Cancer population.
|
Category |
N |
Weighted N |
Weighted Percent (%) |
|
|
Overall |
207 |
1,200,337 |
100.0 |
|
|
Hispanic ethnicity |
Mexican/Mexican American/Chicano |
91 |
556,156 |
46.3 |
|
Puerto Rican |
34 |
183,031 |
15.2 |
|
|
Cuban/Dominican/Central or South America |
51 |
281,388 |
23.4 |
|
|
Other Latin America/Latino/Spanish |
31 |
179,762 |
15.0 |
|
|
Age |
Mean (SE)1 |
56.76 (1.52) |
||
|
18-44 |
39 |
259,675 |
21.6 |
|
|
45-64 |
103 |
575,369 |
47.9 |
|
|
>65 |
65 |
365,293 |
30.4 |
|
|
Race |
Hispanic-White |
193 |
1,107,396 |
92.3 |
|
Other/Multiple |
14 |
92,942 |
7.7 |
|
|
Education |
No degree or Less than high school |
73 |
363,076 |
30.2 |
|
High school |
58 |
342,177 |
28.5 |
|
|
Some college |
76 |
495,084 |
41.2 |
|
|
Region |
Northeast |
58 |
333,336 |
27.8 |
|
Midwest |
16 |
71,742 |
6.0 |
|
|
South |
64 |
346,472 |
28.9 |
|
|
West |
69 |
448,787 |
37.4 |
|
|
Marital status |
Married |
107 |
657,637 |
54.8 |
|
Unmarried |
100 |
542,701 |
45.2 |
|
|
Smoking |
Yes |
18 |
74,982 |
6.2 |
|
No |
189 |
1,125,355 |
93.8 |
|
|
Insurance |
Any private |
81 |
596,715 |
49.7 |
|
Public only |
116 |
561,154 |
46.8 |
|
|
Uninsured |
10 |
42,468 |
3.5 |
|
|
Poverty level |
Poor/Low income |
112 |
538,380 |
44.9 |
|
Middle income |
55 |
340,112 |
28.3 |
|
|
High income |
40 |
321,845 |
26.8 |
|
|
Perceived Health Status |
Fair / Poor |
97 |
518,368 |
43.2 |
|
Good |
68 |
387,866 |
32.3 |
|
|
Excellent / Very Good |
42 |
294,103 |
24.5 |
|
|
Mental Health Status |
Fair / Poor |
50 |
241,462 |
20.1 |
|
Good |
73 |
406,421 |
33.9 |
|
|
Excellent / Very Good |
84 |
552,454 |
46.0 |
|
|
BMI |
Mean (SE)1 |
29.52 (0.7) |
||
|
Underweight/Normal <=24.9 |
54 |
333,335 |
27.8 |
|
|
Overweight 25.0-29.9 |
66 |
363,759 |
30.3 |
|
|
Obese ≥30.0 |
87 |
503,243 |
41.9 |
|
|
Employment |
Employed |
70 |
510,795 |
42.6 |
|
Not employed |
137 |
689,542 |
57.4 |
|
|
Having USC |
Yes |
194 |
1,084,207 |
90.3 |
|
No |
13 |
116,130 |
9.7 |
|
|
CCI |
Mean (SE)1 |
2.08 (0.14) |
||
|
0 |
39 |
210,763 |
17.6 |
|
|
1-2 |
102 |
608,893 |
50.7 |
|
|
>=3 |
66 |
380,681 |
31.7 |
|
1 For continuous variables, mean and SE was calculated based on the weighted sample.
BMI: body Mass Index; CCI: Charlson Comorbidity Index; SE: Standard error.
Table 2: Unadjusted SF-12 Physical and Mental Health Component Summary.
|
Category |
Physical Component Summary (PCS) |
Mental Component Summary (MCS) |
|||||
|
Mean |
Lower 95% CI |
Upper 95% CI |
Mean |
Lower 95% CI |
Upper 95% CI |
||
|
Overall |
41.52 |
39.07 |
43.98 |
47.30 |
45.38 |
49.22 |
|
|
Hispanic ethnicity |
Mexican/Mexican American/Chicano |
40.99 |
36.45 |
45.52 |
48.70 |
46.22 |
51.18 |
|
Puerto Rican |
42.78 |
38.53 |
47.03 |
46.32 |
39.95 |
52.70 |
|
|
Cuban/Dominican/Central or South America |
43.33 |
39.39 |
47.28 |
46.40 |
42.42 |
50.38 |
|
|
Other Latin America/Latino/Spanish |
38.88 |
33.26 |
44.50 |
45.41 |
41.99 |
48.83 |
|
|
Age |
18-44 |
47.76 |
43.69 |
51.84 |
49.19 |
45.37 |
53.00 |
|
45-64 |
41.72 |
38.75 |
44.69 |
45.07 |
42.47 |
47.66 |
|
|
>65 |
36.92 |
32.13 |
41.72 |
49.51 |
45.96 |
53.06 |
|
|
Race |
Hispanic-White |
41.65 |
39.13 |
44.17 |
47.13 |
45.13 |
49.13 |
|
Other/Multiple |
40.00 |
31.35 |
48.66 |
49.29 |
43.26 |
55.33 |
|
|
Education |
No degree or Less than high school |
40.76 |
35.82 |
45.69 |
45.64 |
41.99 |
49.29 |
|
High school |
42.34 |
38.89 |
45.79 |
46.89 |
43.80 |
49.98 |
|
|
Some college |
41.54 |
37.50 |
45.58 |
48.84 |
45.95 |
51.74 |
|
|
Region |
Northeast |
41.19 |
37.50 |
44.88 |
44.39 |
40.18 |
48.60 |
|
Midwest |
38.41 |
32.01 |
44.81 |
44.66 |
39.40 |
49.91 |
|
|
South |
42.92 |
39.08 |
46.76 |
47.08 |
44.59 |
49.57 |
|
|
West |
41.22 |
36.21 |
46.23 |
50.06 |
47.08 |
53.04 |
|
|
Marital status |
Married |
42.84 |
39.92 |
45.76 |
47.88 |
45.32 |
50.45 |
|
Unmarried |
39.94 |
36.15 |
43.74 |
46.59 |
43.81 |
49.38 |
|
|
Smoking |
Yes |
36.11 |
30.72 |
41.50 |
36.10 |
32.05 |
40.15 |
|
No |
41.87 |
39.34 |
44.40 |
48.01 |
46.03 |
50.00 |
|
|
Insurance |
Any private |
44.94 |
41.58 |
48.31 |
52.81 |
46.51 |
59.12 |
|
Public only |
43.48 |
35.43 |
51.53 |
50.61 |
48.55 |
52.67 |
|
|
Uninsured |
37.88 |
34.08 |
41.69 |
43.51 |
40.73 |
46.29 |
|
|
Poverty level |
Poor/Low income |
38.88 |
35.44 |
42.31 |
43.74 |
40.82 |
46.67 |
|
Middle income |
39.90 |
36.65 |
43.15 |
47.93 |
45.03 |
50.83 |
|
|
High income |
47.54 |
43.10 |
51.98 |
52.50 |
49.73 |
55.27 |
|
|
Perceived Health Status |
Fair / Poor |
36.66 |
32.85 |
40.48 |
43.83 |
40.77 |
46.90 |
|
Good |
42.09 |
39.09 |
45.08 |
48.38 |
45.95 |
50.80 |
|
|
Excellent / Very Good |
49.46 |
46.27 |
52.65 |
52.00 |
48.85 |
55.16 |
|
|
Perceived Mental Health Status |
Fair / Poor |
33.97 |
29.20 |
38.75 |
38.23 |
33.49 |
42.97 |
|
Good |
45.82 |
42.82 |
48.81 |
45.74 |
43.43 |
48.05 |
|
|
Excellent / Very Good |
40.36 |
37.14 |
43.57 |
52.58 |
50.90 |
54.25 |
|
|
BMI |
Underweight/Normal <=24.9 |
42.26 |
36.55 |
47.98 |
48.46 |
44.95 |
51.97 |
|
Overweight 25.0-29.9 |
43.69 |
40.99 |
46.39 |
49.05 |
45.76 |
52.34 |
|
|
Obese ≥30.0 |
39.49 |
36.09 |
42.89 |
45.27 |
42.40 |
48.14 |
|
|
Employment |
Employed |
47.99 |
44.94 |
51.04 |
50.29 |
48.23 |
52.35 |
|
Not employed |
36.78 |
33.66 |
39.91 |
45.11 |
42.50 |
47.71 |
|
|
Having USC |
Yes |
41.07 |
38.57 |
43.58 |
46.98 |
44.93 |
49.02 |
|
No |
45.81 |
38.84 |
52.78 |
50.37 |
45.92 |
54.81 |
|
|
CCI |
0 |
43.77 |
37.73 |
49.81 |
50.94 |
47.54 |
54.35 |
|
1-2 |
42.38 |
39.36 |
45.40 |
48.97 |
46.58 |
51.36 |
|
|
>=3 |
38.84 |
35.02 |
42.66 |
42.49 |
39.23 |
45.75 |
|
BMI: body Mass Index; CI: Confidence Interval; CCI: Charlson Comorbidity Index; SE: Standard error; SF-12: 12-Item Short Form Health Survey; USC: Usual Source of Care.
Table 3: Multivariate Regression of Physical Component Summary and Mental Component Summary on Hispanic Patients with Breast Cancer.
|
Category |
Physical Component Summary (PCS) |
Mental Component Summary (MCS) |
|||||||
|
Coefficient |
SE |
t |
p-value |
Coefficient |
SE |
t |
p-value |
||
|
Hispanic ethnicity |
Mexican/Mexican American/Chicano |
-0.511 |
2.711 |
-0.190 |
0.851 |
1.858 |
1.517 |
1.230 |
0.221 |
|
Puerto Rican |
2.174 |
3.121 |
0.700 |
0.487 |
2.130 |
2.267 |
0.940 |
0.348 |
|
|
Cuban/Dominican/Central or South America |
0.547 |
2.771 |
0.200 |
0.844 |
1.212 |
1.719 |
0.710 |
0.481 |
|
|
Other Latin America/Latino/Spanish |
Ref. |
Ref. |
|||||||
|
Age |
18-44 |
6.759 |
2.695 |
2.510 |
0.013 |
-5.981 |
1.999 |
-2.990 |
0.003 |
|
45-64 |
1.891 |
2.171 |
0.870 |
0.384 |
-7.099 |
1.632 |
-4.350 |
<.0001 |
|
|
>65 |
Ref. |
Ref. |
|||||||
|
Race |
Hispanic-White |
-1.948 |
4.260 |
-0.460 |
0.648 |
-3.427 |
2.427 |
-1.410 |
0.159 |
|
Other/Multiple |
Ref. |
Ref. |
|||||||
|
Education |
No degree or Less than high school |
4.015 |
2.583 |
1.550 |
0.121 |
0.901 |
1.933 |
0.470 |
0.641 |
|
High school |
-0.420 |
1.958 |
-0.210 |
0.830 |
-1.442 |
1.262 |
-1.140 |
0.254 |
|
|
Some college |
Ref. |
Ref. |
|||||||
|
Region |
Northeast |
-1.015 |
2.326 |
-0.440 |
0.663 |
-3.695 |
1.888 |
-1.960 |
0.051 |
|
Midwest |
-7.451 |
2.800 |
-2.660 |
0.008 |
-7.498 |
3.779 |
-1.980 |
0.048 |
|
|
South |
-0.866 |
2.010 |
-0.430 |
0.667 |
-4.296 |
1.420 |
-3.030 |
0.003 |
|
|
West |
Ref. |
Ref. |
|||||||
|
Marital status |
Married |
0.868 |
1.668 |
0.520 |
0.603 |
-1.696 |
1.581 |
-1.070 |
0.284 |
|
Unmarried |
Ref. |
Ref. |
|||||||
|
Smoking |
Yes |
-0.393 |
1.967 |
-0.200 |
0.842 |
-4.068 |
3.623 |
-1.120 |
0.262 |
|
No |
Ref. |
Ref. |
|||||||
|
Insurance |
Any private |
1.455 |
4.069 |
0.360 |
0.721 |
11.376 |
3.596 |
3.160 |
0.002 |
|
Public only |
0.166 |
3.297 |
0.050 |
0.960 |
4.991 |
2.235 |
2.230 |
0.026 |
|
|
Uninsured |
Ref. |
Ref. |
|||||||
|
Poverty level |
Poor/Low income |
-4.808 |
2.411 |
-1.990 |
0.047 |
-2.591 |
1.485 |
-1.740 |
0.082 |
|
Middle income |
-3.067 |
2.349 |
-1.310 |
0.192 |
-2.491 |
1.829 |
-1.360 |
0.174 |
|
|
High income |
Ref. |
Ref. |
|||||||
|
Perceived Health Status |
Fair / Poor |
-7.593 |
2.672 |
-2.840 |
0.005 |
-2.357 |
1.809 |
-1.300 |
0.193 |
|
Good |
-4.546 |
2.232 |
-2.040 |
0.042 |
-0.122 |
1.803 |
-0.070 |
0.946 |
|
|
Excellent / Very Good |
Ref. |
Ref. |
|||||||
|
Mental Health Status |
Fair / Poor |
-1.933 |
3.141 |
-0.620 |
0.539 |
-10.804 |
2.879 |
-3.750 |
0.000 |
|
Good |
1.052 |
2.140 |
0.490 |
0.623 |
-5.159 |
1.449 |
-3.560 |
0.000 |
|
|
Excellent / Very Good |
Ref. |
Ref. |
|||||||
|
BMI |
Underweight/Normal <=24.9 |
1.715 |
2.217 |
0.770 |
0.440 |
-1.037 |
1.888 |
-0.550 |
0.583 |
|
Overweight 25.0-29.9 |
4.978 |
1.774 |
2.810 |
0.005 |
-0.673 |
1.474 |
-0.460 |
0.648 |
|
|
Obese ≥30.0 |
Ref. |
Ref. |
|||||||
|
Employment |
Employed |
6.514 |
2.158 |
3.020 |
0.003 |
-1.185 |
1.512 |
-0.780 |
0.434 |
|
Not employed |
Ref. |
Ref. |
|||||||
|
Having USC |
Yes |
-3.840 |
2.601 |
-1.480 |
0.140 |
-3.765 |
2.711 |
-1.390 |
0.166 |
|
No |
Ref. |
Ref. |
|||||||
|
CCI |
0 |
-1.779 |
2.147 |
-0.830 |
0.408 |
4.113 |
1.851 |
2.220 |
0.027 |
|
1-2 |
-1.021 |
1.497 |
-0.680 |
0.496 |
4.580 |
1.747 |
2.620 |
0.009 |
|
|
>=3 |
Ref. |
Ref. |
|||||||
|
Constant |
48.553 |
8.890 |
5.460 |
<.0001 |
74.399 |
6.704 |
11.100 |
<.0001 |
|
1 GLM with gamma distribution and a log-link function was used.
2 Significant at P < 0.05 (in bold).
BMI: body Mass Index; CI: Confidence Interval; CCI: Charlson Comorbidity Index; SE: Standard error; USC: Usual Source of Care.
28 SF-12: 12-Item Short Form Health Survey; MCS: Mental Component Summary; PCS: Physical Component Summary.
References
- American Cancer Society. How Common is Breast Cancer? Cancer.org.
- National Breast Cancer Foundation, Inc. Facts about Breast Cancer in the United States.
- Yan Li, Erin Carlson, Denise A Hernández, Brandle Green, Tania Calle et al. (2019) Patient Perception and Cost-Effectiveness of a Patient Navigation Program to Improve Breast Cancer Screening for Hispanic Women. Health Equity 3: 280-286. [Crossref]
- American Cancer Society. Cancer Facts and Figures for Hispanics/Latinos 2018-2020. Cancer.org.
- Betina R Yanez, Diana Buitrago, Joanna Buscemi, Francisco Iacobelli, Rachel F Adler et al. (2018) Study design and protocol for My Guide: An e-health intervention to improve patient-centered outcomes among Hispanic breast cancer survivors. Contemp Clin Trials 65: 61-68. [Crossref]
- I T Gram, S E Slenker (1992) Cancer anxiety and attitudes toward mammography among screening attenders, nonattenders, and women never invited. Am J Public Health 82: 249-251. [Crossref]
- Theofilou Paraskevi (2012) Quality of life outcomes in patients with breast cancer. Oncol Rev 6: e2. [Crossref]
- Velda J Gonzalez, Susan McMillan, Elsa Pedro, Maribel Tirado-Gomez, Leorey N Saligan (2018) The Health related Quality of Life of Puerto Ricans during Cancer Treatments; A Pilot Study. P R Health Sci J 37: 46-51. [Crossref]
- Ali Montazeri (2009) Quality of life data as prognostic indicators of survival in cancer patients: an overview of the literature from 1982 to 2008. Health Qual Life Outcomes 7: 102. [Crossref]
- S Wood-Dauphinee (1999) Assessing quality of life in clinical research: from where have we come and where are we going? J Clin Epidemiol 52: 355-363. [Crossref]
- Kathryn E Weaver, Laura P Forsythe, Bryce B Reeve, Catherine M Alfano, Juan L Rodriguez et al. (2012) Mental and physical health-related quality of life among US cancer survivors: population estimates from the 2010 national health interview survey. Cancer Epidemiol Biomarkers Prev 21: 2108-2117. [Crossref]
- J E Bower, P A Ganz, K A Desmond, J H Rowland, B E Meyerowitz et al. (2000) Fatigue in breast cancer survivors: occurrence, correlates, and impact on quality of life. J Clin Oncol 18: 743-753. [Crossref]
- Gary T Deimling, Karen F Bowman, Samantha Sterns, Louis J Wagner, Boza Kahana (2006) Cancer-related health worries and psychological distress among older adult, long-term cancer survivors. Psychooncology 15: 306-320. [Crossref]
- Anja Mehnert, Uwe Koch (2008) Psychological comorbidity and health-related quality of life and its association with awareness, utilization, and need for psychosocial support in a cancer register-based sample of long-term breast cancer survivors. J Psychosom Res 64: 383-391. [Crossref]
- Karen Meneses, Silvia Gisiger-Camata, Rachel Benz, Raju Dheeraj, Jennifer R Bail et al. (2018) Telehealth intervention for Latina breast cancer survivors: A pilot. Womens Health (Lond) 14: 1745506518778721. [Crossref]
- Devon K Check, Neetu Chawla, Marilyn L Kwan, Laura Pinheiro, Janise M Roh et al. (2018) Understanding racial/ethnic differences in breast cancer-related physical well-being: the role of patient-provider interactions. Breast Cancer Res Treat 170: 593-603. [Crossref]
- Ana C Sanchez-Birkhead, Sara Carbajal-Salisbury, Jorge A Larreta, Leslie Lovlien, Hilary Hendricks et al. (2017) A Community-Based Approach to Assessing the Physical, Emotional, and Health Status of Hispanic Breast Cancer Survivors. Hisp Health Care Int 15: 166-172. [Crossref]
- Elisa V Bandera, Gertraud Maskarinec, Isabelle Romieu, Esther M Hohn (2015) Racial and ethnic disparities in the impact of obesity on breast cancer risk and survival: a global perspective. Adv Nutr 6: 803-819. [Crossref]
- Alix G Sleight, Kathleen Doyle Lyons, Cheryl Vigen, Heather Macdonald, Florence Clark (2019) The association of health-related quality of life with unmet supportive care needs and sociodemographic factors in low-income Latina breast cancer survivors: a single-centre pilot study. Disabil Rehabil 41: 3151-3156. [Crossref]
- Patricia I Moreno, Amelie G Ramirez, Sandra L San Miguel-Majors, Leopoldo Castillo, Rina S Fox et al. (2019) Unmet supportive care needs in Hispanic/Latino cancer survivors: prevalence and associations with patient-provider communication, satisfaction with cancer care, and symptom burden. Support Care Cancer 27: 1383-1394. [Crossref]
- Patricia I Moreno, Amelie G Ramirez, Sandra L San Miguel-Majors, Rina S Fox, Leopoldo Castillo et al. (2018) Satisfaction with cancer care, self-efficacy, and health-related quality of life in Latino cancer survivors. Cancer 124: 1770-1779. [Crossref]
- Fu-Ling Zhou, Wang-Gang Zhang, Yong-Chang Wei, Kang-Ling Xu, Ling-Yun Hui et al. (2005) Impact of comorbid anxiety and depression on quality of life and cellular immunity changes in patients with digestive tract cancers. World J Gastroenterol 11: 2313-2318. [Crossref]
- Cielito C Reyes-Gibby, Karen O Anderson, Phuong Kanh Morrow, Sanjay Shete, Sohela Hassan (2010) Depressive symptoms and health-related quality of life in breast cancer survivors. J Womens Health (Larchmt) 21: 311-318. [Crossref]
- MEPS HC-192 2016 Full Year Consolidated Data File. Agency for Healthcare Research and Quality (AHRQ), August 2018.
- Alexander H Fischer, Daniel B Shin, David J Margolis, Junko Takeshita (2017) Racial and ethnic differences in health care utilization for childhood eczema: An analysis of the 2001-2013 Medical Expenditure Panel Surveys. J Am Acad Dermatol 77: 1060-1067. [Crossref]
- Jonathan D Campbell, Vahram Ghushchyan, R Brett McQueen, Sharon Cahoon-Metzger, Terrie Livingston et al. (2014) Burden of multiple sclerosis on direct, indirect costs and quality of life: National US estimates. Mult Scler Relat Disord 3: 227-236. [Crossref]
- Elaheh Shirneshan, Jim Bailey, George Relyea, Brandi E Franklin, David K Solomon et al. (2013) Incremental direct medical expenditures associated with anxiety disorders for the U.S. adult population: evidence from the Medical Expenditure Panel Survey. J Anxiety Disord 27: 720-727. [Crossref]
- J Ware Jr, M Kosinsk, S D Keller (1996) A 12-Item Short-Form Health Survey: construction of scales and preliminary tests of reliability and validity. Med Care 34: 220-233. [Crossref]
- Marianne Baernholdt, Ivora Hinton, Guofen Yan, Karen Rose, Meghan Mattos (2012) Factors associated with quality of life in older adults in the United States. Qual Life Res 21: 527-534. [Crossref]
- Using Statistical Software Packages to Produce Estimates from MEPS Data File. Agency for Healthcare Research and Quality (AHRQ), 2018.
- Yvonne L Michael, Lisa F Berkman, Graham A Colditz, Michelle D Holmes, Ichiro Kawachi (2002) Social networks and health-related quality of life in breast cancer survivors: a prospective study. J Psychosom Res 52: 285-293. [Crossref]
- Jean Campbell, MS. Breast Cancer in Hispanic/Latina Women.
- C Bouchet, F Guillemin, A Paul-Dauphin, S Briançon (2000) Selection of quality of life measures for a prevention trial: a psychometric analysis. Control Clin Trials 21: 30-43. [Crossref]
- J N Burdine, M R Felix, A L Abel, C J Wiltraut, Y J Musselman (2000) The SF-12 as a population health measure: an exploratory examination of potential for application. Health Serv Res 35: 885-904. [Crossref]