Journals
Zinc Chloride Treatment in ATDC5 cells Induces Chondrocyte Maturation
A B S T R A C T
Objectives: Chondrogenesis is an integral part of endochondral ossification during bone healing. Insulin and insulin mimetic compounds like ZnCl2 have been shown to improve bone healing in both normal and diabetic bone healing models. Although the effects of ZnCl2 in processes like osteoblast proliferation and osteoclastogenesis have been evaluated, its role in chondrogenesis is unclear [1-4]. In this study, we determine if ZnCl2 treatment can induce chondrogenic differentiation in the murine chondrogenic ATDC5 cell line in the absence of insulin.
Methods: ATDC5 cells were treated with 10ug/ml insulin (IDM), 0µM, 100µM, or 1000µM of ZnCl2 every other day and harvested at the following time points 2hrs, 4hrs, 1d, 2d, 4d, 7d, 10d, 14d, 17d, 21d, 24d, and 28d. ATDC5 chondrogenic differentiation was assayed via Alizarin Red S (ARS) staining, Alcian blue staining, immunoblotting, and QPCR.
Results: Our results demonstrate that ZnCl2 treatment can induce proteoglycan and calcium deposition as per Alcian blue and ARS staining in ATDC5 chondrocyte cells. ZnCl2 treatment also increased transcriptional expression of Col2a1 and increased phospho-Akt protein levels over time.
Conclusions: The experimental results indicate that ZnCl2 can be promote ATDC5 chondrocytes to differentiate in vitro. Our results coincide with other studies that show that Zn+2 can stimulation collagen production or enhance bone healing outcomes in animal models [4, 5]. Our data indicate that ZnCl2 may be a useful adjuvant for promoting chondrogenesis during endochondral ossification, enhancing cartilage repair, or improving cartilage tissue engineering applications.
K E Y W O R D S
Chondrogenesis, Zinc Chloride, Insulin mimetic,Fracture healing
I N T R O D U C T I O N
Regenerative medicine often focuses on ways to improve bone and cartilage repair. A significant portion of the population has complications that prevent or delay healing [6]. Osteobiologics like recombinant human bone morphogenic proteins (such as rhBMP-2) are used to improve bone healing but have disadvantages such as high cost and adverse effects associated with their supraphysiologic dosages. Unlike bone, cartilage has a limited capacity to self-repair because the tissue is avascular and is composed of a mixture of fibrous tissue, fibrocartilage, and hyaline cartilage [7]. When cartilage repair is necessary, autologous chondrocytes in conjugation with a biodegradable collagen membrane are used to produce new cartilage at the site [8, 9]. Unfortunately, use of autologous chondrocytes has many drawbacks including variable outcomes, donor site damage, difficult in vitro proliferation, and limited chondrocyte yield. Therefore, cartilage regeneration studies have focused on utilizing mesenchymal stem cells (MSCs) as a promising alternative for cartilage regeneration [10]. Previous studies have demonstrated that MSCs can differentiate into chondrocytes [10, 11]. Highly proliferative and stable cartilage cell lines such as C3H10T1/2, ATDC5, and RJC3.1 have been developed and are often used as research models [12-14]. Of these models, the AT805 teratocarcinoma derived cell line, ATDC5, has become the most commonly used chondrogenic model in research. ATDC5 cells reliably differentiate into chondrocytes using straightforward culturing methods and ATDC5 cells are similar to mesenchymal derived chondrocytes [13].
ATDC5 cells are often induced to differentiate into chondrocytes by adding insulin to the media [12, 13]. Insulin promotes proliferation and induces genes important for cellular differentiation, extracellular matrix synthesis, and collagen synthesis [15]. Collagen synthesis is an important component of bone repair. During the earlier stages of bone repair a fibrocartilaginous callus forms through a process known as endochondral ossification [16, 17]. This cartilage is made by callus chondrocytes and serves as an anlage of bone formation. Fracture healing studies have demonstrated that locally applied insulin enhances callus cartilage formation and bone healing in diabetic or normal rat models [16, 18]. While the application of insulin has been successful in animal models, use of insulin as an orthobiologic will require development of suitable delivery vehicles to limit the potential of insulin-induced hypoglycemia while allowing incorporation of the relative fragile insulin protein.
Therefore, research has focused on utilizing small molecules, including insulin mimetic compounds like vanadyl acetylacetonate (VAC), sodium tungstate, or zinc chloride (ZnCl2) to accelerate bone repair Zn+2 is the second most common trace metal found in the body and over 75% of this Zn+2 is located in skeletal muscle and bone [5, 16, 17, 19-22]. Zn+2 is vital to processes including respiration, pH and CO2 equilibrium, ureagenesis, gluconeogenesis, and lipogenesis [23, 24]. Its role in both gluconeogenesis and lipogenesis eventually lead to the investigation of Zn+2 as anti-diabetic agent and an insulin mimetic. Zn+2’s ability to work as insulin mimetic was first reported in 1980, when ZnCl2 was found to mimic insulin’s ability to stimulate lipogenesis in rat adipocytes [25]. Since then, the effectiveness of Zn+2 as an insulin mimetic has been demonstrated in vivo and in vitro to reduce serum insulin levels, prevent insulin resistance, decrease or normalize blood glucose levels, and reduce diabetes [26-29].
Various Zn+2 compounds such as Bis-maltolato-Zinc (II) have been incorporated into cells with doses ranging from 100nM to 1mM to investigate lipogenesis and gluconeogenesis [29]. Other cell culture studies have shown that ZnCl2 can increase osteoblast activity and reduce osteoclast differentiation but the relationship between ZnCl2 and chondrogenesis is limited [1, 4, 30, 31]. One study using bovine fetal chondrocytes demonstrated that ZnCl2 at doses between 1-50mM promoted collagen formation, but the data was not statistically significant when 35S-sulfate incorporation into macromolecules was measured [32]. In another study, growth plate chondrocytes treated with Zn+2 (10-100µM) were found to have increased alkaline phosphatase activity and other markers of mineralization [33]. The mechanism by which Zn+2 affects chondrogenesis is not well understood [29]. Studies using rat adipocytes and 3T3-L1 fibroblasts have shown that Zn+2 can enhance phosphorylation of the insulin receptor (IR)-β subunit and other receptor protein tyrosine kinases (R-PTKs) similar to insulin [29, 34]. Zn+2 induced phosphorylation of the IR-β is likely through the inhibition of protein tyrosine phosphatases (PTPase) which increases the level of tyrosine phosphorylation of multiple R-PTKs. Once R-PTKs are activated, they can lead to the activation of many downstream targets including MAP kinase and phosphatidylinositol 3-kinase (PI3-K). Activation of these molecules and their corresponding pathways can positively influence gene transcription, cell growth and proliferation, glucose uptake, glycogen synthesis and other functions [34-37]. In fact, pre-clinical studies have shown that a single dose of ZnCl2 given immediately after fracture can promote fracture healing [5]. Thus, the focus of our labs initial experiments was to study the early effects of ZnCl2 treatment on gene expression. Since ZnCl2 is often used in vivo bone healing models, we treated ATDC5 cells with ZnCl2 at concentrations between 0µM and1000µM to evaluate the effect of ZnCl2 treatment on chondrogenesis [5, 16, 18, 38-41].
Methods
I Cell Culture
ATDC5 cells were obtained as a gift from the O’Connor Lab (Rutgers New Jersey Medical School, Newark, NJ). Insulin was purchased from Invitrogen. ZnCl¬2 was purchased from VWR. Cells were cultured in growth medium containing DMEM/F12 (Corning), 5% fetal bovine serum (FBS) (Atlanta Biologics), 1% penicillin and streptomycin (Corning), 1% glutamate (Corning), 10 µg/ml transferrin (Invitrogen), and 30 nM sodium selenite (Sigma-Aldrich) in a humidified atmosphere of 5% CO2 at 37°C. Only passage numbers between 3-8 were used for this study. Plates were seeded at 70% density and allowed to become confluent. Chondrogenesis was initiated by changing the medium to differentiation medium. Differentiation medium consisted of growth media supplemented with 10 µg/ml of insulin (IDM) or 0, 10, 100, or 1000 µM ZnCl2. Insulin was used because insulin mimetics like Zn+2 are thought to signal through a pathway similar to insulin to promote bone formation. Insulin is also a common growth factor utilized to promote chondrocyte differentiation 15. Differentiation medium was changed every 2 days. ZnCl2 treatment concentrations were based on previously published studies and preliminary dose-response data collected in the lab [32, 33, 42]. A dose response curve using increasing concentrations of ZnCl2 (10, 25, 50, 100, 500, 1000 µM) and measuring proteoglycan deposition determined that doses of 10, 100, and 1000 µM had the most diverse effect on chondrogenesis and therefore were utilized for this study.
II Calcium Deposition Assay
To evaluate calcium deposits in the cell cultures, Alizarin Red S (ARS), an anthraquinone dye was used. ATDC5 cells were grown and then fixed with 4% formaldehyde for 15min at room temperature. After fixation, cells were washed 3X with diH20 and then 40 mM ARS was added to each well and incubated at room temperature for 30min. After dye removal, cells were washed with diH20, and images were taken using a phase microscope.
To quantify calcification, 10% acetic acid was added and incubated at room temperature for 30 min while gently shaking. The solution was transferred into a tube, vortexed for 30 sec, heated to 85°C for 10 min, placed on ice for 5 min, and centrifuged for 15 min at 20,000 g. The supernatant was combined with 10% ammonium hydroxide. The samples were measured in triplicate at 405 nm absorbance using a 96-well plate reader. The concentration of the unknowns was calculated using a standard curve and compared to ATDC5 cells differentiated using insulin.
III Alcian Blue Assay
To evaluate cartilage production in ATDC5 cells, Alcian blue staining was used. Cells were fixed with 100% cold methanol for 5 min on ice. After fixation, cells were treated with 0.1% Alcian blue in 0.1M HCl overnight. The cells were washed 3X with 1X HBSS and then the Alcian blue was extracted with 6M guanidine-HCl overnight. A standard curve and the samples were measured at 595nm absorbance in triplicate using a 96-well plate reader. The concentration of the unknowns was calculated using the standard curve.
Table 1: Primer Sequences used for QPCR
|
Gene Name |
Sequence (5’ to 3’) |
Annealing Temperature (°C) |
|
gapdh_F |
ACCACAGTCCATGCCATCAC |
60 |
|
gapdh_R |
TCCACCACCCTGTTGCTGTA |
|
|
Col2A1_F |
TGGGTGTTCTATTTATTTATTGTCTTCCT |
60 |
|
Col2A1_R |
GCGTTGGACTCACACCAGTTAGT |
|
|
Col10A1_F |
CATGCCTGATGGCTTCATAAA |
60 |
|
Col10A1_R |
GCGTTGGACTCACACCAGTTAGT |
|
|
mTOR_F |
CCATCCAATCTGATGCTGGA |
60 |
|
mTOR_R |
GGTGTGGCATGTGGTTCTGT |
|
|
RUNX2_F |
GACGAGGCAAGAGTTTCACC |
60 |
|
RUNX2_R |
GGACCGTCCACTGTCACTTT |
|
|
ALP_F |
CCGATGGCACACCTGCTT |
60 |
|
ALP_R |
GGAGGCATACGCCATCACAT |
|
|
B-actin_F |
GACAGGATGCAGAAGGAGATTACTG |
60 |
|
B-actin_R |
CCACCGATCCACACAGAGTACTT |
|
|
Acan_F |
GGC GAA TGG AAC GAC GTC CC |
60 |
|
Acan_R |
GGA AGC TCC TCT CAG TGG GC |
|
|
Sox9_F |
GTA CCC GCA TCT GCA CAA C |
60 |
|
Sox9_R |
TCC ACG AAG GGT CTC TTC TC |
IV Immunoblotting
After washing with HBSS, ATDC5 cells were lysed in mammalian protein extraction (MPER) buffer (GE Healthcare) by rocking the plate gently for 10min at room temperature. The lysate was clarified by centrifugation at 20,000xg for 30min at 4°C. The clarified lysate was collected and utilized for immunoblots. Total protein concentration was determined using a Pierce bicinchoninic acid (BCA) protein assay (Thermo Fischer). In preparation for protein separation, samples were diluted 1:1 with 2X SDS PAGE Sample Buffer containing 10% 2-mercaptoethanol and heated at 70°C for 10min. Proteins were separated on 4-12% gradient NuPAGE Bis-Tris protein gels (Thermo Fischer) following the manufacturer’s instructions and transferred to polyvinylidene membrane. The immunoblot was blocked using Superblock (Thermo Scientific) for an hour at room temperature or overnight at 4°C. Primary immunodetection of GAPDH (Cell Signaling Technology), AKT (Cell Signaling Technology), and phospho-AKT (Cell Signaling Technology), and mTOR (Cell Signaling Technology) was performed using mouse reactive antibodies. Secondary immunodetection was completed using goat or rabbit-HRP conjugated antibodies (R&D Systems) that was appropriate for the primary antibody. Bound antibodies were detected by enhanced chemiluminescence detection following manufacturer’s procedure (ThermoScientific). Chemiluminescent signals were visualized in triplicate and quantified using a Fluorchem M system and software provided by the manufacturer (Protein Simple).
V Quantitative PCR
RNA samples were collected from approximately 1.2 x 10⁶ cells ATDC5 cells found in a single well of each 6-well cell culture plate. For each time point and treatment group, three separate isolates were collected. Prior to total RNA isolation, the media in each well was aspirated and washed 3X with 1X HBSS. Total RNA was isolated immediately from ATDC5 cells using an RNAeasy mini kit (Qiagen) using the manufacturer’s instructions and reconstituted RNA in 20uL of RNAse free water at neutral pH. Purified RNA was quantified spectrophotometrically using a Biodrop (Biodrop). RNA quality was verified using an A260/A280 ratio and checked for integrity using agarose gel electrophoresis. Only samples, with ratios of 1.8-2.0 and intact after gel electrophoresis analysis were utilized for cDNA synthesis. Samples were stored at -80°C until utilized for cDNA synthesis.
For cDNA synthesis, 1 µg of total RNA was used in a 20 µl standard reverse transcription (RT) reaction containing 1X RT buffer (New England BioLabs), 0.5 mM per dNTP (New England BioLabs), 1 µl of RNAse inhibitor (New England BioLabs), and 1 µl of M-MLV reverse transcriptase (New England BioLabs) were used. Reactions were performed at 42°C for 1 hour, followed by a 10min incubation at 95°C to inactivate the reverse transcriptase enzyme. cDNA samples were stored at -20°C prior to qPCR analysis.
qPCR was performed utilizing qPCR SYBR® mastermix in 96-well optical plates according to the manufacturer’s protocol (ThermoScientific). Reactions were manually completed in triplicate. The primer sequences for detection of col2a1, Col10a1, β-actin, Runx2, mTOR, Acan, and Sox9 were based on the coding sequences of the respective mRNAs (Table 1) and were designed to amplicon products between 100-130bp. Prior to analysis primer titrations were completed between 50 nM to 300 nM. Forward and reverse primers were used at a concentration of 70 nM. Annealing temperatures were also optimized prior to qPCR analysis and are listed in Table 1 for each gene. Each 25 µl reaction was prepared with a final concentration of 500 nM ROX dye, 3 mM MgCl2, 70 nM of forward and reverse primers, and 250 ng of template cDNA. The qPCR cycling was completed using an ABI StepOnePlus Sequence Detection System (Applied BioSystems), ABI qPCR specific barcode plates, and sealing covers specified by Applied Biosystems. Samples were heated for 15min at 95°C and DNA was amplified for 40 cycles of 15s at 95°C, 30s at 58-60°C, and 60s at 72°C, followed by a melt curve for 1 cycle at 95°C for 30s, 1 cycle of 60°C for 30s and, 80 cycles at 60°C for 10s. Data were analyzed using Sequence Detection Software version 2.3 (Applied Biosystems) using a comparative qPCR method. Negative (no template control, NTC) and positive controls were utilized on each plate to verify the integrity of the experiment and to detect any variation between plates. Gene expression was found in samples with Cq values between 15 and 35, Cq values ≥40 were not utilized for analysis. Triplicate Cq values were normalized to their respective reference gene GAPDH (that were verified to be stable during chondrogenesis). 2-Cq was calculated and used where appropriate for data analysis and statistical tests based on Scmittgen et al [43,44].
VI Data Analysis
Data analysis was completed using SigmaPlot Software version 13.0. The data analysis was performed using one way or two-way ANOVA analysis, followed by post hoc tests Holm-Sidak, or Tukey’s as necessary. Differences were considered significant at P < 0.05.
Table 2: Two-Way Analysis of Variance: Effect of Treatment on Calcium Deposition. Treatment groups include ATDC5 cells grown in differentiation medium consisting of growth media supplemented with 10 mg/ml insulin (IDM) or the indicated amount of ZnCl2. n=3 for each time point and treatment group
|
Comparison of Treatment Groups at Each Time Point (Holm-Sidak Test p Values) |
||||||
|
Day |
IDM vs. 0µM ZnCl2 |
IDM vs. 10µM ZnCl2 |
IDM vs. 100µM ZnCl2 |
0µM ZnCl2 vs. 10µM ZnCl2 |
0µM ZnCl2 vs. 100µM ZnCl2 |
10µM ZnCl2 vs. 100µM ZnCl2 |
|
2 |
0.995 |
1.00 |
1.000 |
0.937 |
1.000 |
1.000 |
|
4 |
1.000 |
1.00 |
1.000 |
0.989 |
0.999 |
0.995 |
|
7 |
0.999 |
0.997 |
0.999 |
0.999 |
0.945 |
0.987 |
|
10 |
1.000 |
0.990 |
1.000 |
0.999 |
1.000 |
1.000 |
|
14 |
0.927 |
0.992 |
0.997 |
0.922 |
0.949 |
0.999 |
|
17 |
0.571 |
0.929 |
0.943 |
0.748 |
0.748 |
0.860 |
|
21 |
0.042 |
0.352 |
0.019 |
0.235 |
<0.001 |
<0.001 |
|
24 |
0.008 |
0.273 |
0.005 |
0.092 |
<0.001 |
<0.001 |
|
28 |
0.001 |
0.025 |
0.004 |
0.244 |
<0.001 |
<0.001 |
*p<0.001 with power of 1.00 at α = 0.05
Results
I Treatment with Zinc Chloride Promotes Calcium Deposition
The effect of ZnCl2 treatment on calcium deposition during chondrocyte differentiation was analyzed. ATDC5 cells were differentiated with growth media supplemented with IDM or 0µM, 10µM, or 100µM ZnCl2. Cells were harvested on days 2, 4, 7, 10, 14, 17, 21, 24, and 28 after treatment. Deposited calcium was measured using ARS staining. Calcium deposition in ATDC5 cultures was found to be significantly different among treatment groups via two-way ANOVA analysis (P < 0.001, Table 2). Significant differences were found when comparing time after treatment (P < 0.001) and a significant interaction between time and treatment was found (P < 0.001). Table 2 shows the comparison of treatment groups at each time point using a Holm-Sidak Test. Calcium deposition was similar between ATDC5 cultures treated with 100µM ZnCl2 and IDM samples between days 2-17. However, at days 21 (P=0.019), 24 (P=0.005), and 28 (P=0.004), the 100µM ZnCl2 treatment increased calcium deposition by approximately 1.5-fold when compared to IDM samples (Figure 1). No significant increase in calcium deposition was found with 10µM ZnCl2 treatment when compared to the IDM group.
Table 3: Two-Way Analysis of Variance: Effect of Treatment on Proteoglycan Deposition within Time Points. Treatment groups include ATDC5 cells grown in differentiation medium consisting of growth media supplemented with 10 mg/ml insulin (IDM) or the indicated amount of ZnCl2. n=3 for each time point and treatment group
|
Comparison of Treatment Groups at Each Time Point (Holm-Sidak Test p Values) |
||||||
|
Day |
IDM vs. 0µM ZnCl2 |
IDM vs. 100µM ZnCl2 |
IDM vs. 1000µM ZnCl2 |
0µM ZnCl2 vs. 100µM ZnCl2 |
0µM ZnCl2 vs. 1000µM ZnCl2 |
100µM ZnCl2 vs. 1000µM ZnCl2 |
|
2 |
1.00 |
0.999 |
1.000 |
0.989 |
0.998 |
0.989 |
|
4 |
<0.001 |
<0.001 |
<0.001 |
<0.001 |
0.406 |
<0.001 |
|
7 |
<0.001 |
0.221 |
<0.001 |
<0.001 |
0.004 |
<0.001 |
|
10 |
<0.001 |
<0.001 |
<0.001 |
<0.001 |
0.0180 |
<0.001 |
|
14 |
<0.001 |
<0.001 |
<0.001 |
<0.001 |
<0.001 |
<0.001 |
|
17 |
<0.001 |
<0.001 |
0.847 |
<0.001 |
<0.001 |
<0.001 |
|
21 |
0.101 |
0.229 |
0.600 |
0.778 |
0.015 |
0.063 |
*p<0.001 with power of 1.00 at α = 0.05
Table 4: Statistical Analysis of Gene Expression for ZnCl2 Treated ATDC5 Cells
|
Two-Way Analysis of Variance p Values |
|||
|
|
Effect of Time After Treatment |
Effect of Treatment Group |
Interaction Between Time After Fracture and Drug Treatment |
|
Col2a1 |
<0.001 |
<0.001 |
<0.001 |
|
Col10a1 |
<0.001 |
0.119 |
<0.001 |
|
mTOR |
<0.001 |
0.073 |
0.003 |
|
Runx2 |
<0.001 |
0.537 |
0.328 |
|
Acan |
0.015 |
0.576 |
0.890 |
|
Sox9 |
0.283 |
0.677 |
0.987 |
Table 5: Two-Way Analysis of Variance: Effect of Treatment on Gene Expression at A) 2, B) 4, C) 24, and D) 48 Hours. Treatment groups include ATDC5 cells grown in differentiation medium consisting of growth media supplemented with 10 mg/ml insulin (IDM) or the indicated amount of ZnCl2. NS=non-significant
|
|
B) 4 Hours |
|||||
|
|
IDM vs 0µM ZnCl2 |
IDM vs 100µM ZnCl2 |
IDM vs 1000µM ZnCl2 |
0µM vs 100µM ZnCl2 |
0µM vs 1000uM ZnCl2 |
100µM vs 1000µM ZnCl2 |
|
Col2a1 |
NS |
NS |
NS |
NS |
NS |
NS |
|
Col10a1 |
<0.001 |
<0.001 |
<0.001 |
NS |
NS |
0.040 |
|
mTOR |
0.014 |
NS |
0.014 |
NS |
NS |
NS |
|
Runx2 |
NS |
NS |
NS |
NS |
NS |
NS |
|
ALP |
NS |
NS |
NS |
NS |
NS |
NS |
|
Acan |
NS |
NS |
NS |
NS |
NS |
NS |
|
Sox9 |
NS |
NS |
NS |
NS |
NS |
NS |
|
|
D) 48 Hours |
|||||
|
|
IDM vs 0µM ZnCl2 |
IDM vs 100µM ZnCl2 |
IDM vs 1000µM ZnCl2 |
0µM vs 100µM ZnCl2 |
0µM vs 1000uM ZnCl2 |
100µM vs 1000µM ZnCl2 |
|
Col2a1 |
<0.001 |
<0.001 |
NS |
NS |
<0.001 |
0.002 |
|
Col10a1 |
<0.001 |
<0.001 |
<0.001 |
0.032 |
<0.001 |
NS |
|
mTOR |
<0.001 |
<0.001 |
<0.001 |
NS |
NS |
NS |
|
Runx2 |
NS |
NS |
NS |
NS |
NS |
NS |
|
ALP |
NS |
NS |
NS |
NS |
NS |
NS |
|
Acan |
NS |
NS |
NS |
NS |
NS |
NS |
|
Sox9 |
NS |
NS |
NS |
NS |
NS |
NS |
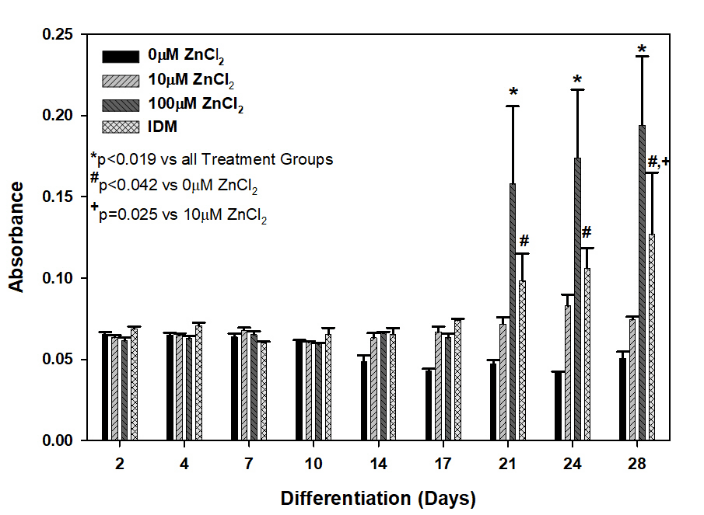
Figure 1: ZnCl2 Treatment Promotes Calcium Deposition. Differentiated ATDC5 cells were harvested at day 2, 4, 7, 10, 14, 17, 21, 24, or 28. Treatment groups include ATDC5 cells grown in differentiation medium consisting of growth media supplemented with 10 mg/ml insulin (IDM) or the indicated amount of ZnCl2. n=3 for each time point and treatment group. Error bars represent mean±SD. */#/^ denote statistically significant differences between treatment groups where appropriate; corresponding p values are noted.
II Treatment with Zinc Chloride Upregulates Proteoglycan Deposition
ZnCl2 treatment also promoted proteoglycan deposition in the ATDC5 cultures. Proteoglycan synthesis was quantified for IDM, 0µM, 100µM and 1,000µM ZnCl2-treated cultures and statistical differences were found after two-way ANOVA analysis (Table 3). Significant differences were found when comparing time after treatment (P < 0.001), effect of treatment (P < 0.001), and when comparing the interaction between time and treatment (P < 0.001). Analysis showed that proteoglycan deposition was most abundant between days 4 and 14 in both IDM and 100µM ZnCl2 treated ATDC5 cultures (Figure 2, Table 3). On day 4, IDM treated cells had deposited significantly more proteoglycans than either ZnCl2 treatment group (P < 0.001). However, on day 14, 100µM ZnCl2-treated cultures had 1.5-fold more proteoglycans when compared to IDM treated cells (P < 0.001). When comparing the 100µM to 0µM ZnCl2 treatment, proteoglycan deposition was significantly greater between days 4-17, suggesting that ZnCl2 can stimulate proteoglycan deposition in the absence of insulin (P < 0.001 for days 4-17) analysis of the 1,000µM ZnCl2 dose showed a significant decrease in proteoglycan concentration between days 4-14 (Figure 2, Table 3). The 1,000µM ZnCl2 dose inhibited proteoglycan deposition of ATDC5 cells by treatment day 4, but quantification of viable cells measured via the MTT assay on days 2 and 4 showed no significant differences in viability between the insulin, 10µM, 100µM, and 1000µM ZnCl2 doses (data not shown).

Figure 2: Quantification of Proteoglycan Deposition after ZnCl2 Treatment over Time. Differentiated ATDC5 cells were harvested at day 2, 4, 7, 10, 14, 17 and 21. Treatment groups include ATDC5 cells grown in differentiation medium consisting of growth media supplemented with 10 mg/ml insulin (IDM) or the indicated amount of ZnCl2. n=3 for each time point and treatment group. Error bars represent mean±SD. */#/^ denote statistically significant differences between treatment groups where appropriate; corresponding p values are noted.
III Treatment with Zinc Chloride Effects P-Akt and mTor Protein Expression
In order to elucidate possible mechanisms by which zinc chloride treatment induced chondrogenesis in ATDC5 cells, phospho-Akt and Akt expression levels were measured at 2, 4, 24 and 48 hours after treatment. Figure 3 shows that ZnCl2 treatment upregulated phospho-Akt expression to levels similar or greater than the 0µM ZnCl2 and IDM group. The 1,000µM ZnCl2 dose significantly increased phospho-Akt expression by 19-fold, at 4 and 24 hours post-treatment (P < 0.024). The 100µM ZnCl2 dose did not significantly affected phospho-Akt expression when compared to the 0µM ZnCl2 treatment group but was similar to IDM induced phospho-AKT expression on 4 and 24 hours post treatment. The data also showed that phospho-Akt expression peaked between 4 and 24 hours and returned to normal 48 hours after treatment with ZnCl2. As expected, cells treated with 0µM ZnCl2 did not activate phospho-Akt. mTOR expression was measured at 24 hours post treatment. The data demonstrates that mTOR expression is significantly increased in all treatment groups when compared to the 0µM ZnCl2 (P < 0.042). The 100µM ZnCl2 has significantly more mTOR protein expression when compared to 1000µM ZnCl2 (P < 0.016).

Figure 3: phospho-Akt Protein Levels in Zinc Chloride Treated ATDC5 Cells. Treatment groups include ATDC5 cells grown in differentiation medium consisting of growth media supplemented with 10 mg/ml insulin (IDM) or the indicated amount of ZnCl2. n=3 for each time point and treatment group. A) Protein samples at 24 hours after indicated ZnCl2 or IDM treatment for Phospho-AKT and AKT. B) Quantification of phospho-AKT/AKT protein levels at 2, 4, 24, 48 hours after ZnCl2 or insulin treatment. C) Protein samples at 24 hours after indicated ZnCl2 or IDM treatment for mTOR and GAPDH. D) Quantification of total mTOR protein levels 24 hours after ZnCl2 or insulin treatment. n=3 for each time point and treatment group. Error bars represent mean±SD. */#/^ denote statistically significant differences between treatment groups where appropriate; corresponding p values are noted
IV Zinc Chloride Treatment Promotes Chondrogenic Gene Expression in ATD C5 Cells
Gene expression was quantified for specific markers to determine if ZnCl2 treatment promoted ATDC5 chondrocyte differentiation through transcriptional control. ATDC5 cells were treated with IDM, 0µM, 100µM, or 1000µM ZnCl2 after reaching confluence and harvested at 2, 4, 24, or 48 hours after treatment. ZnCl2 treatment caused significant effects on expression of chondrocyte-related genes. 100µM ZnCl2 significantly increased col2a1 mRNA levels as compared to 0µM ZnCl2, IDM, and 1000µM ZnCl2 treated cells (P < 0.026). The 100µM ZnCl2 dose caused a 2.9- (P=0.011), 6.1- (P < 0.001), and a 1.6-fold (P < 0.001) increase in col2a1 mRNA levels at 2, 24, and 48 hours, respectively as compared to controls (Figure 4A, Table 4 & 5). The 1,000µM ZnCl2 dose also increased col2a1 mRNA levels by 3.9- (P=0.003), and 7.6-fold (P < 0.001) at hours 24 and 48, respectively when compared to controls (Table 4-5). A significant difference in col2a1 mRNA levels was found between time points after accounting for treatment groups (P=0.002, P values for all comparisons can be found in Table 4 and 5). Col2a1 expression levels were similar between 100µM ZnCl2 and IDM treated cells at both at 2 and 4 hours. However, significantly more col2a1 was expressed in 100µM ZnCl2 treatment groups at 24 and 48 hours when compared to IDM and 0 µM ZnCl2 treatment groups. At 48 hours, the 100µM ZnCl2 treated ATDC5 cultures had 0.25-fold less (P < 0.050) col10a1 mRNA as compared to 0µM ZnCl2 (Figure 4B, Table 4-5). The 1,000 µM dose of ZnCl2 significantly reduced col10a1 expression as compared to controls at 4 (P=0.018) and 48 (P < 0.001) hours after treatment. IDM treatment was found to be significantly higher than all treatment groups between 2 and 24 hours (P < 0.050). Although Acan was found to increase over the early timepoints after treatment (P=0.015) no significant differences were found among the treatment groups (Figure 4C, Table 4&5). Sox9 levels were also measured, no significant differences were detected between group between 2 and 48 hours (Figure 4D). Alkaline phosphatase was also quantified but no significant differences were found between treatment groups (data not shown). These data suggest that the 100 µM dose of ZnCl2 stimulates ATDC5 chondrocyte maturation and the expression of collagen markers.
Expression of other genes were also quantified to determine a mechanism by which ZnCl2 treatment promoted chondrogensis. Runx2 expression was also compared between treatment groups over time, IDM treatment was found to elicit significantly higher levels of Runx2 as compared to other treatments (P < 0.001, Figure 4E, Table 4 & 5). ZnCl2 treatment did not increase Runx2 expression at any time point. 100µM ZnCl2 reduced mTOR gene expression at 2 (P =< 0.001), 24 (P < 0.001), and 48 hours (P=0.022) as compared to IDM treated ATDC5 cells (Figure 4F). The 1,000µM ZnCl2 significantly reduced mTOR expression at 2 (P < 0.001), 4 (P < 0.014), and 48 hours (P < 0.001) as compared to the 0 µM ZnCl2 control group (Figure 4F, Table 4 and 5). IDM treated was found to stimulate mTOR expression. Since mTOR is an Insulin Receptor Substrate-1 (IRS1) inhibitor, a reduction of mTOR expression suggests IRS1 may be involved in ZnCl2 induced ATDC5 chondrogenesis.
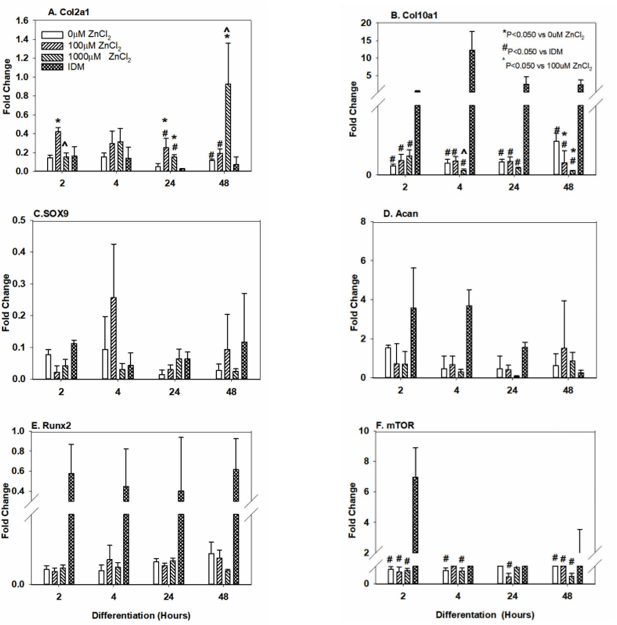
Figure 4: G)Gene Expression of ZnCl2 No significant difference between the Alcian blue (Figure 1) data and acan mRNA levels (Figure 4D) was found at 48 hours among the treatment groups. Treated Cells over Time. Induction of A) Col2a1 B) Col10a1 C) Sox9 D) Acan E) Runx2 or F) mTOR mRNA expression was determine at 2, 4, 24, and 48 hours post-treatment following the onset of differentiation. Treatment groups include ATDC5 cells grown in differentiation medium consisting of growth media supplemented with 10 mg/ml insulin (IDM) or the indicated amount of ZnCl2. Values represent fold change relative to day 0 of differentiation. n=3 for each time point and treatment group. Error bars represent mean±SD. */#/^ denote statistically significant differences between treatment groups where appropriate; corresponding p values are noted. No statistical difference was found via 2-way ANOVA for mRNA levels of SOX9, Acan, or Runx2.
Discussion
Recent studies showed that Zn+2 can stimulate bone formation and mineralization in vivo and in vitro, suggesting Zn+2 may have therapeutic potential [1, 4, 30, 31, 45]. For example, intraperitoneal Zn+2 injections have been shown to restore essential tissue components that were reduced within the fracture site [46]. In fracture healing studies, insulin mimetic compounds like ZnCl2 can enhance bone healing in normal and diabetic animals like insulin [5, 16, 40]. However, the mechanism by which insulin mimetic compounds, including ZnCl2 and VAC, improve bone healing is not well understood. The current data suggests that insulin and insulin mimetic work by enhancing chondrogenesis and osteoblastogenesis while preventing osteoclast proliferation [47-49]. Recently, Mueller et al. demonstrated that insulin was essential for promoting human mesenchymal stem cells (MSCs) to undergo chondrogenesis in a cell pellet model. In the absence of insulin, MSCs were unable to undergo chondrogenesis or express cartilage differentiation markers [47]. Other data shows that ZnCl2, can enhance bone regeneration by increasing cell proliferation and collagen synthesis in an in vitro osteoblast model [2]. However, to our knowledge, the role of ZnCl2 on chondrocytes has not been evaluated. Here we showed that ZnCl2 enhanced ATDC5 chondrocyte differentiation and stimulated the transcriptional expression of chondrogenic markers and induced chondrocyte differentiation in the absence of insulin treatment in a chondrocyte model.
The results of our studies coincide with those of Yamaguchi et al. who demonstrated that Zn+2 could stimulation collagen production in rat femora and calvaria [4]. Our analysis also show that ZnCl2 induces ATDC5 chondrocyte differentiation by transcriptional upregulation of col2a1 and col10a1, important markers of chondrogenesis and chondrocyte hypertrophy, respectively. ZnCl2 treatment in rat fracture models increased fracture callus cartilage formation and callus mechanical strength [5, 39]. Wey et al. also found that ZnCl2 treatment increased callus levels of vascular endothelial growth factor (VEGF) and insulin growth factor-1 (IGF-1). These results suggest that ZnCl2 treatment increases growth factor expression, which in turn stimulates callus chondrogenesis to promote endochondral ossification. VAC, another insulin mimetic compound, also increases callus chondrogenesis and vascular endothelial growth factor-C (VEGF-C) levels, suggesting that ZnCl2 may produce the same in vivo effects on callus endochondral ossification as VAC [39-41, 50].
Insulin-like growth factor-1 (IGF-1) is an important regulator of chondrogenesis and exerts its influence by increasing chondrocyte proliferation, synthesis of type II collagen, and proteoglycans in chondrocytes [51-53]. Since insulin is structurally similar to IGF-1 if can activate the IGF-1 receptor and stimulate ECM production in chondrocyte-based tissue engineering products [54, 55]. Insulin and IGF-1 have been used in cartilage repair to enhance healing and engineer cartilage [54, 56, 57]. Since ZnCl2 is an insulin mimetic compound, it was anticipated that ZnCl2 would work through mechanisms similar to insulin or IGF-1 to exert its effects on chondrogenesis. Our data however suggests that ZnCl2 may be working through other mechanisms. As Runx2 gene expression levels trend higher when IDM and ZnCl2 treated groups are compared. Additionally, p-akt protein expression was significantly higher in the 1000µM ZnCl2 treated groups at 4 and 24 hours post-treatment. This data suggests that ZnCl2 may work through alternative pathways to stimulate chondrogenesis and promote bone healing.
An array of signaling regulators and mechanisms control the main facets of chondrogenesis and cartilage production. These regulators include family members of the fibroblast growth factor (FGF), transforming growth factor β (TGF-β)/ bone morphogenic protein (BMP), Wnt/β-catenin, and hedgehog signaling pathways. Phosphatidylinostiol 3-kinase (PI3K)/Akt signaling is modulated by many of the above pathways. Our data coincides with other research in an in vitro cardiac model that demonstrates that ZnCl2 can enhance Akt phosphorylation [58]. Lee et al. demonstrated that ZnCl2 induced Akt phosphorylation through stimulation of the IGF-1 receptor tyrosine kinase (IGF-1RTK) and not epidermal growth factor receptor (EGFR) [58, 59]. However, Zn+2 has been shown to activate EGFR signaling and modulate insulin signaling by inhibiting protein tyrosine phosphatase (PTPase) [58]. Therefore, it is possible that exogenous Zn+2 can activate IGF-1 RTK through inhibition of PTPase. Although little is known about the mechanism by which Zn+2 stimulates IGF-1RTK, Lee et al’s data suggest that Zn+2 activates IGF-1RTK by directly or indirectly interacting with the specific tyrosine kinase domain [58].
Downstream targets of PI3k/Akt signaling pathway include transcription factors fundamental to differentiation of key bone-related cells like osteoblasts, osteoclasts, and chondrocytes. Runx2 is a transcription factor which has been shown to regulate chondrocyte migration and differentiation through PI3k/Akt signaling [60, 61]. Our data indicates that ZnCl2 does not induce ATDC5 cells to stimulate Runx2 transcription within the first 48 hours of treatment. This data suggests that insulin mimetic compound, ZnCl2 may not initially utilize Runx2 transcription to enhance ATDC5 chondrogenesis as insulin has been shown to do [60, 61]. Furthermore, our gene expression analysis shows that ZnCl2 treatment modulate the transcriptional and protein expression of mTOR, which functions in a negative feedback loop with insulin receptor substance (IRS-1) [62]. Our data demonstrates that both IDM and ZnCl2 at 24 hours increase mTOR protein expression. IDM also showed a significant increase in mTOR RNA expression when compared to 0µM ZnCl2 while treatment with ZnCl2 at doses of 100-1000µM did not. Since mRNA messages undergo many processing events during transcription, it is possible that the mTOR gene levels are different from protein in the presence of ZnCl2 treatment as result of various gene processing events. By modulating transcriptional expression of mTOR, it is possible that ZnCl2 promotes indirectly the activation of IRS-1 and other PI3K or Akt downstream targets. Current research suggests that FGF and insulin work together to induce chondrogenesis and to subsequently produce fully functional cartilage [63]. Thus, another possibility is that ZnCl2 works synergistically with FGF to promote ATDC5 chondrogenesis. Additional experimentation is needed to determine whether ZnCl2 promotes ATDC5 chondrogenesis through activation of the insulin-signaling pathway, the FGF pathway, or through an unknown mechanism.
Zn+2’s osteoconductive nature has been well studied and it is known to enhance collagen deposition and mineralization in osteoblasts. Our data suggest zinc chloride’s can enhance collagen formation in ATDC5 chondrogenic cells and demonstrates its role in chondrocyte maturation. These finding are clinically relevant and suggest that Zn+2 may be useful to promote chondrocyte maturity and differentiation while regulating the function of key bone cells like osteoblasts and osteoclasts [42]. In summary, zinc chloride may enhance endochondral ossification or cartilage formation in bone fracture healing or in clinical models were cartilage formation is impaired.
Article Info
Article Type
Research ArticlePublication history
Received: Wed 12, Sep 2018Accepted: Thu 04, Oct 2018
Published: Sat 08, Dec 2018
Copyright
© 2023 Jessica Cottrell. This is an open-access article distributed under the terms of the Creative Commons Attribution License, which permits unrestricted use, distribution, and reproduction in any medium, provided the original author and source are credited. Hosting by Science Repository.DOI: 10.31487/j.RGM.2018.02.008
Author Info
Corresponding Author
Jessica CottrellSeton Hall University, 400 South Orange Ave, South Orange, NJ 07079, USA
Figures & Tables

Table 1: Primer Sequences used for QPCR
|
Gene Name |
Sequence (5’ to 3’) |
Annealing Temperature (°C) |
|
gapdh_F |
ACCACAGTCCATGCCATCAC |
60 |
|
gapdh_R |
TCCACCACCCTGTTGCTGTA |
|
|
Col2A1_F |
TGGGTGTTCTATTTATTTATTGTCTTCCT |
60 |
|
Col2A1_R |
GCGTTGGACTCACACCAGTTAGT |
|
|
Col10A1_F |
CATGCCTGATGGCTTCATAAA |
60 |
|
Col10A1_R |
GCGTTGGACTCACACCAGTTAGT |
|
|
mTOR_F |
CCATCCAATCTGATGCTGGA |
60 |
|
mTOR_R |
GGTGTGGCATGTGGTTCTGT |
|
|
RUNX2_F |
GACGAGGCAAGAGTTTCACC |
60 |
|
RUNX2_R |
GGACCGTCCACTGTCACTTT |
|
|
ALP_F |
CCGATGGCACACCTGCTT |
60 |
|
ALP_R |
GGAGGCATACGCCATCACAT |
|
|
B-actin_F |
GACAGGATGCAGAAGGAGATTACTG |
60 |
|
B-actin_R |
CCACCGATCCACACAGAGTACTT |
|
|
Acan_F |
GGC GAA TGG AAC GAC GTC CC |
60 |
|
Acan_R |
GGA AGC TCC TCT CAG TGG GC |
|
|
Sox9_F |
GTA CCC GCA TCT GCA CAA C |
60 |
|
Sox9_R |
TCC ACG AAG GGT CTC TTC TC |
Table 2: Two-Way Analysis of Variance: Effect of Treatment on Calcium Deposition. Treatment groups include ATDC5 cells grown in differentiation medium consisting of growth media supplemented with 10 mg/ml insulin (IDM) or the indicated amount of ZnCl2. n=3 for each time point and treatment group
|
Comparison of Treatment Groups at Each Time Point (Holm-Sidak Test p Values) |
||||||
|
Day |
IDM vs. 0µM ZnCl2 |
IDM vs. 10µM ZnCl2 |
IDM vs. 100µM ZnCl2 |
0µM ZnCl2 vs. 10µM ZnCl2 |
0µM ZnCl2 vs. 100µM ZnCl2 |
10µM ZnCl2 vs. 100µM ZnCl2 |
|
2 |
0.995 |
1.00 |
1.000 |
0.937 |
1.000 |
1.000 |
|
4 |
1.000 |
1.00 |
1.000 |
0.989 |
0.999 |
0.995 |
|
7 |
0.999 |
0.997 |
0.999 |
0.999 |
0.945 |
0.987 |
|
10 |
1.000 |
0.990 |
1.000 |
0.999 |
1.000 |
1.000 |
|
14 |
0.927 |
0.992 |
0.997 |
0.922 |
0.949 |
0.999 |
|
17 |
0.571 |
0.929 |
0.943 |
0.748 |
0.748 |
0.860 |
|
21 |
0.042 |
0.352 |
0.019 |
0.235 |
<0.001 |
<0.001 |
|
24 |
0.008 |
0.273 |
0.005 |
0.092 |
<0.001 |
<0.001 |
|
28 |
0.001 |
0.025 |
0.004 |
0.244 |
<0.001 |
<0.001 |
*p<0.001 with power of 1.00 at α = 0.05
Table 3: Two-Way Analysis of Variance: Effect of Treatment on Proteoglycan Deposition within Time Points. Treatment groups include ATDC5 cells grown in differentiation medium consisting of growth media supplemented with 10 mg/ml insulin (IDM) or the indicated amount of ZnCl2. n=3 for each time point and treatment group
|
Comparison of Treatment Groups at Each Time Point (Holm-Sidak Test p Values) |
||||||
|
Day |
IDM vs. 0µM ZnCl2 |
IDM vs. 100µM ZnCl2 |
IDM vs. 1000µM ZnCl2 |
0µM ZnCl2 vs. 100µM ZnCl2 |
0µM ZnCl2 vs. 1000µM ZnCl2 |
100µM ZnCl2 vs. 1000µM ZnCl2 |
|
2 |
1.00 |
0.999 |
1.000 |
0.989 |
0.998 |
0.989 |
|
4 |
<0.001 |
<0.001 |
<0.001 |
<0.001 |
0.406 |
<0.001 |
|
7 |
<0.001 |
0.221 |
<0.001 |
<0.001 |
0.004 |
<0.001 |
|
10 |
<0.001 |
<0.001 |
<0.001 |
<0.001 |
0.0180 |
<0.001 |
|
14 |
<0.001 |
<0.001 |
<0.001 |
<0.001 |
<0.001 |
<0.001 |
|
17 |
<0.001 |
<0.001 |
0.847 |
<0.001 |
<0.001 |
<0.001 |
|
21 |
0.101 |
0.229 |
0.600 |
0.778 |
0.015 |
0.063 |
*p<0.001 with power of 1.00 at α = 0.05
Table 4: Statistical Analysis of Gene Expression for ZnCl2 Treated ATDC5 Cells
|
Two-Way Analysis of Variance p Values |
|||
|
|
Effect of Time After Treatment |
Effect of Treatment Group |
Interaction Between Time After Fracture and Drug Treatment |
|
Col2a1 |
<0.001 |
<0.001 |
<0.001 |
|
Col10a1 |
<0.001 |
0.119 |
<0.001 |
|
mTOR |
<0.001 |
0.073 |
0.003 |
|
Runx2 |
<0.001 |
0.537 |
0.328 |
|
Acan |
0.015 |
0.576 |
0.890 |
|
Sox9 |
0.283 |
0.677 |
0.987 |
Table 5: Two-Way Analysis of Variance: Effect of Treatment on Gene Expression at A) 2, B) 4, C) 24, and D) 48 Hours. Treatment groups include ATDC5 cells grown in differentiation medium consisting of growth media supplemented with 10 mg/ml insulin (IDM) or the indicated amount of ZnCl2. NS=non-significant
|
|
B) 4 Hours |
|||||
|
|
IDM vs 0µM ZnCl2 |
IDM vs 100µM ZnCl2 |
IDM vs 1000µM ZnCl2 |
0µM vs 100µM ZnCl2 |
0µM vs 1000uM ZnCl2 |
100µM vs 1000µM ZnCl2 |
|
Col2a1 |
NS |
NS |
NS |
NS |
NS |
NS |
|
Col10a1 |
<0.001 |
<0.001 |
<0.001 |
NS |
NS |
0.040 |
|
mTOR |
0.014 |
NS |
0.014 |
NS |
NS |
NS |
|
Runx2 |
NS |
NS |
NS |
NS |
NS |
NS |
|
ALP |
NS |
NS |
NS |
NS |
NS |
NS |
|
Acan |
NS |
NS |
NS |
NS |
NS |
NS |
|
Sox9 |
NS |
NS |
NS |
NS |
NS |
NS |
|
|
B) 4 Hours |
|||||
|
|
IDM vs 0µM ZnCl2 |
IDM vs 100µM ZnCl2 |
IDM vs 1000µM ZnCl2 |
0µM vs 100µM ZnCl2 |
0µM vs 1000uM ZnCl2 |
100µM vs 1000µM ZnCl2 |
|
Col2a1 |
NS |
NS |
NS |
NS |
NS |
NS |
|
Col10a1 |
<0.001 |
<0.001 |
<0.001 |
NS |
NS |
0.040 |
|
mTOR |
0.014 |
NS |
0.014 |
NS |
NS |
NS |
|
Runx2 |
NS |
NS |
NS |
NS |
NS |
NS |
|
ALP |
NS |
NS |
NS |
NS |
NS |
NS |
|
Acan |
NS |
NS |
NS |
NS |
NS |
NS |
|
Sox9 |
NS |
NS |
NS |
NS |
NS |
NS |
|
|
D) 48 Hours |
|||||
|
|
IDM vs 0µM ZnCl2 |
IDM vs 100µM ZnCl2 |
IDM vs 1000µM ZnCl2 |
0µM vs 100µM ZnCl2 |
0µM vs 1000uM ZnCl2 |
100µM vs 1000µM ZnCl2 |
|
Col2a1 |
<0.001 |
<0.001 |
NS |
NS |
<0.001 |
0.002 |
|
Col10a1 |
<0.001 |
<0.001 |
<0.001 |
0.032 |
<0.001 |
NS |
|
mTOR |
<0.001 |
<0.001 |
<0.001 |
NS |
NS |
NS |
|
Runx2 |
NS |
NS |
NS |
NS |
NS |
NS |
|
ALP |
NS |
NS |
NS |
NS |
NS |
NS |
|
Acan |
NS |
NS |
NS |
NS |
NS |
NS |
|
Sox9 |
NS |
NS |
NS |
NS |
NS |
NS |
References
1. Matsui T, Yamaguchi M (1995) Zinc modulation of insulin-like growth factor's effect in osteoblastic MC3T3-E1 cells. Peptides 16: 1063-1068. [Crossref]
2. Seo HJ, Cho YE, Kim T, Shin HI, Kwun IS (2010) Zinc may increase bone formation through stimulating cell proliferation, alkaline phosphatase activity and collagen synthesis in osteoblastic MC3T3-E1 cells. Nutr Res Pract 4: 356-361. [Crossref]
3. Yamaguchi M, Kishi S (1995) Inhibitory effect of zinc-chelating dipeptide on parathyroid hormone-stimulated osteoclast-like cell formation in mouse marrow cultures: involvement of calcium signaling. Peptides 16: 629-633. [Crossref]
4. Yamaguchi M, Oishi H, Suketa Y (1987) Stimulatory effect of zinc on bone formation in tissue culture. Biochem Pharmacol 36: 4007-4012. [Crossref]
5. Wey A, Cunningham C, Hreha J, Breitbart E, Cottrell J, et al. Local ZnCl2 accelerates fracture healing. J Orthop Res 32: 834-841. [Crossref]
6. Schmidmaier G, Schwabe P, Strobel C, Wildemann B (2008) Carrier systems and application of growth factors in orthopaedics. Injury 2: 37-43. [Crossref]
7. Luo Y, Sinkeviciute D, He Y, Karsdal M, Henrotin Y, et al. (2017) The minor collagens in articular cartilage. Protein Cell 8: 560-572. [Crossref]
8. Ali A, Zafar H, Zia M, Ul Haq I, Phull AR, et al. (2016) Synthesis, characterization, applications, and challenges of iron oxide nanoparticles. Nanotechnol Sci Appl 9: 49-67. [Crossref]
9. Phull AR, Eo SH, Abbas Q, Ahmed M, Kim SJ (2016) Applications of Chondrocyte-Based Cartilage Engineering: An Overview. Biomed Res Int 1879837. [Crossref]
10. Koga H, Engebretsen L, Brinchmann JE, Muneta T, Sekiya I (2009) Mesenchymal stem cell-based therapy for cartilage repair: a review. Knee Surg Sports Traumatol Arthrosc 17: 1289-1297. [Crossref]
11. Bosnakovski D, Mizuno M, Kim G, Ishiguro T, Okumura M, et al. (2004) Chondrogenic differentiation of bovine bone marrow mesenchymal stem cells in pellet cultural system. Exp Hematol 32: 502-509. [Crossref]
12. Lin EA, Kong L, Bai XH, Luan Y, Liu CJ (2009) miR-199a, a bone morphogenic protein 2-responsive MicroRNA, regulates chondrogenesis via direct targeting to Smad1. J Biol Chem 284: 11326-11335. [Crossref]
13. Atsumi T, Miwa Y, Kimata K, Ikawa Y (1990) A chondrogenic cell line derived from a differentiating culture of AT805 teratocarcinoma cells. Cell Differ Dev 30: 109-116. [Crossref]
14. Spagnoli A, Hwa V, Horton WA, Lunstrum GP, Roberts CT, et al. (2001) Antiproliferative effects of insulin-like growth factor-binding protein-3 in mesenchymal chondrogenic cell line RCJ3.1C5.18. relationship to differentiation stage. J Biol Chem 276: 5533-5540. [Crossref]
15. Yao Y, Zhai Z, Wang Y (2014) Evaluation of insulin medium or chondrogenic medium on proliferation and chondrogenesis of ATDC5 cells. Biomed Res Int 569241.
16. Gandhi A, Beam HA, O'Connor JP, Parsons JR, Lin SS (2005) The effects of local insulin delivery on diabetic fracture healing. Bone 37: 482-490. [Crossref]
17. Lin HN, Cottrell J, O'Connor JP (2016) Variation in lipid mediator and cytokine levels during mouse femur fracture healing. J Orthop Res 34: 1883-1893. [Crossref]
18. Park AG, Paglia DN, Al-Zube L, Hreha J, Vaidya S, et al. (2013) Local insulin therapy affects fracture healing in a rat model. J Orthop Res 31: 776-782. [Crossref]
19. El Karib AO, Al-Ani B, Al-Hashem F, Dallak M, Bin-Jaliah I, et al. (2016) Insulin and vanadium protect against osteoarthritis development secondary to diabetes mellitus in rats. Arch Physiol Biochem 122:148-154. [Crossref]
20. Khader A, Sherman LS, Rameshwar P, Arinzeh TL (2016) Sodium Tungstate for Promoting Mesenchymal Stem Cell Chondrogenesis. Stem Cells Dev 25: 1909-1918. [Crossref]
21. Jackson MJ (2007) Physiology of Zinc:General Aspects: Springer-Verlag.
22. Organisation WH (2001) Sources of Human and Environmental Exposure. United Nations Environment Programme and the WHO. Geneva 29-43.
23. Scozzafava A, Menabuoni L, Mincione F, Mincione G, Supuran CT (2001) Carbonic anhydrase inhibitors: synthesis of sulfonamides incorporating dtpa tails and of their zinc complexes with powerful topical antiglaucoma properties. Bioorg Med Chem Lett 11: 575-582. [Crossref]
24. Supuran CT, Scozzafava A, Casini A (2003) Carbonic anhydrase inhibitors. Med Res Rev 23: 146-189.
25. Coulston L, Dandona P (1980) Insulin-like effect of zinc on adipocytes. Diabetes 29: 665-667. [Crossref]
26. Adachi Y, Yoshida J, Kodera Y, Kato A, Yoshikawa Y, et al. (2004) A new insulin-mimetic bis(allixinato)zinc(II) complex: structure-activity relationship of zinc(II) complexes. J Biol Inorg Chem 9: 885-893. [Crossref]
27. Ilouz R, Kaidanovich O, Gurwitz D, Eldar-Finkelman H (2002) Inhibition of glycogen synthase kinase-3beta by bivalent zinc ions: insight into the insulin-mimetic action of zinc. Biochem Biophys Res Commun 295: 102-106. [Crossref]
28. Karamali M, Heidarzadeh Z, Seifati SM, Samimi M, Tabassi Z, et al. (2015) Zinc supplementation and the effects on metabolic status in gestational diabetes: A randomized, double-blind, placebo-controlled trial. J Diabetes Complications 29: 1314-1319. [Crossref]
29. Vardatsikos G, Pandey NR, Srivastava AK (2013) Insulino-mimetic and anti-diabetic effects of zinc. J Inorg Biochem 120: 8-17. [Crossref]
30. Hall SL, Dimai HP, Farley JR (1999) Effects of zinc on human skeletal alkaline phosphatase activity in vitro. Calcif Tissue Int 64: 163-172. [Crossref]
31. Yamaguchi M, Yamaguchi R (1986) Action of zinc on bone metabolism in rats. Increases in alkaline phosphatase activity and DNA content Biochem Pharmacol 35: 773-777. [Crossref]
32. Koyano Y, Hejna M, Flechtenmacher J, Schmid TM, Thonar EJ, et al. (1996) Collagen and proteoglycan production by bovine fetal and adult chondrocytes under low levels of calcium and zinc ions. Connect Tissue Res 34: 213-225. [Crossref]
33. Litchfield TM, Ishikawa Y, Wu LN, Wuthier RE, Sauer GR (1998) Effect of metal ions on calcifying growth plate cartilage chondrocytes. Calcif Tissue Int 62: 341-349. [Crossref]
34. Tang X, Shay NF (2001) Zinc has an insulin-like effect on glucose transport mediated by phosphoinositol-3-kinase and Akt in 3T3-L1 fibroblasts and adipocytes. J Nutr 131: 1414-1420. [Crossref]
35. Avruch J. Insulin (1998) signal transduction through protein kinase cascades. Mol Cell Biochem 182: 31-48. [Crossref]
36. Kyosseva SV (2004) Mitogen-activated protein kinase signaling. Int Rev Neurobiol 59: 201-220. [Crossref]
37. Pessin JE, Saltiel AR (2000) Signaling pathways in insulin action: molecular targets of insulin resistance. J Clin Invest 106: 165-169. [Crossref]
38. Koerner JD, Vives MJ, O'Connor JP, Chirichella P, Breitbart EA, et al. (2016) Zinc has insulin-mimetic properties which enhance spinal fusion in a rat model. Spine J 16: 777-783. [Crossref]
39. Krell ES, Ippolito JA, Montemurro NJ, Lim PH, Vincent RA, et al. (2017) Local Zinc Chloride Release from a Calcium Sulfate Carrier Enhances Fracture Healing. J Orthop Trauma 31: 168-174. [Crossref]
40. Paglia DN, Wey A, Hreha J, Park AG, Cunningham C, et al. (2014) Local vanadium release from a calcium sulfate carrier accelerates fracture healing. J Orthop Res 32: 727-734. [Crossref]
41. Paglia DN, Wey A, Park AG, Breitbart EA, Mehta SK, et al. (2012) The effects of local vanadium treatment on angiogenesis and chondrogenesis during fracture healing. J Orthop Res 30: 1971-1978. [Crossref]
42. Yamaguchi M, Weitzmann MN (2011) Zinc stimulates osteoblastogenesis and suppresses osteoclastogenesis by antagonizing NF-kappaB activation. Mol Cell Biochem 355: 179-186. [Crossref]
43. Bustin SA, Benes V, Garson JA, Hellemans J, Huggett J, et al. (2009) The MIQE guidelines: minimum information for publication of quantitative real-time PCR experiments. Clin Chem 55: 611-622. [Crossref]
44. Schmittgen TD, Livak KJ (2008) Analyzing real-time PCR data by the comparative C(T) method. Nat Protoc 3: 1101-1108. [Crossref]
45. Yamaguchi M, Ehara Y (1995) Zinc decrease and bone metabolism in the femoral-metaphyseal tissues of rats with skeletal unloading. Calcif Tissue Int 57: 218-223. [Crossref]
46. Igarashi A, Yamaguchi M (1999) Stimulatory effect of zinc acexamate administration on fracture healing of the femoral-diaphyseal tissues in rats. Gen Pharmacol 32: 463-469. [Crossref]
47. Mueller MB, Blunk T, Appel B, Maschke A, Goepferich A, et al. (2013) Insulin is essential for in vitro chondrogenesis of mesenchymal progenitor cells and influences chondrogenesis in a dose-dependent manner. Int Orthop 37: 153-158. [Crossref]
48. Ferron M, Wei J, Yoshizawa T, Del Fattore A, DePinho RA, et al. (2010) Insulin signaling in osteoblasts integrates bone remodeling and energy metabolism. Cell 142: 296-308. [Crossref]
49. DeMambro VE, Maile L, Wai C, Kawai M, Cascella T, et al. (2012) Insulin-like growth factor-binding protein-2 is required for osteoclast differentiation. J Bone Miner Res 27: 390-400. [Crossref]
50. Ippolito JA, Krell ES, Cottrell J, Meyer R, Clark D, et al. (2017) Effects of local vanadium delivery on diabetic fracture healing. J Orthop Res. 35: 2174-2180. [Crossref]
51. Guntur AR, Rosen CJ (2013) IGF-1 regulation of key signaling pathways in bone. Bonekey Rep 2: 437. [Crossref]
52. Loeser RF, Chubinskaya S, Pacione C, Im HJ (2005) Basic fibroblast growth factor inhibits the anabolic activity of insulin-like growth factor 1 and osteogenic protein 1 in adult human articular chondrocytes. Arthritis Rheum 52: 3910-3917. [Crossref]
53. Tyler JA (1989) Insulin-like growth factor 1 can decrease degradation and promote synthesis of proteoglycan in cartilage exposed to cytokines. Biochem J 260: 543-548. [Crossref]
54. Kellner K, Schulz MB, Gopferich A, Blunk T (2001) Insulin in tissue engineering of cartilage: a potential model system for growth factor application. J Drug Target 9: 439-448. [Crossref]
55. Schmid C (1995) Insulin-like growth factors. Cell Biol Int 19: 445-457. [Crossref]
56. Cucchiarini M, Henrionnet C, Mainard D, Pinzano A, Madry H (2015) New trends in articular cartilage repair. J Exp Orthop 2:8. [Crossref]
57. Frisch J, Venkatesan JK, Rey-Rico A, Madry H, Cucchiarini M (2015) Current progress in stem cell-based gene therapy for articular cartilage repair. Curr Stem Cell Res Ther 10: 121-31. [Crossref]
58. Lee S, Chanoit G, McIntosh R, Zvara DA, Xu Z (2009) Molecular mechanism underlying Akt activation in zinc-induced cardioprotection. Am J Physiol Heart Circ Physiol 297: H569-575. [Crossref]
59. Wu W, Silbajoris RA, Whang YE, Graves LM, Bromberg PA, et al. (2005) p38 and EGF receptor kinase-mediated activation of the phosphatidylinositol 3-kinase/Akt pathway is required for Zn2+-induced cyclooxygenase-2 expression. Am J Physiol Lung Cell Mol Physiol 289: L883-889. [Crossref]
60. Fujita T, Azuma Y, Fukuyama R, Hattori Y, Yoshida C, et al. (2004) Runx2 induces osteoblast and chondrocyte differentiation and enhances their migration by coupling with PI3K-Akt signaling. J Cell Biol 166: 85-95. [Crossref]
61. Fujita T, Fukuyama R, Enomoto H, Komori T (2004) Dexamethasone inhibits insulin-induced chondrogenesis of ATDC5 cells by preventing PI3K-Akt signaling and DNA binding of Runx2. J Cell Biochem 93: 374-383. [Crossref]
62. Dungan CM, Williamson DL (2017) Regulation of skeletal muscle insulin-stimulated signaling through the MEK-REDD1-mTOR axis. Biochem Biophys Res Commun 482: 1067-1072. [Crossref]
63. Green JD, Tollemar V, Dougherty M, Yan Z, Yin L, et al. (2015) Multifaceted signaling regulators of chondrogenesis: Implications in cartilage regeneration and tissue engineering. Genes Dis 2: 307-27. [Crossref]