Vitamin D Deficiency is Associated with Metabolic Syndrome
A B S T R A C T
Background: Metabolic syndrome (MetS), insulin resistance (IR) and diabetes mellitus (DM) are highly interrelated abnormalities seeking multidisciplinary public health interventions. Vitamin D has recently gained attention as a protective factor for MetS, IR, DM and cardiovascular diseases (CVD). However, there is no clearly defined mechanism of action, and supplementation guidelines on vitamin D (VD) in either prevention or treatment against MetS, IR, DM and CVD. The purpose of this study is to determine the strength of association between VD and MetS, IR, and DM in the general U.S. population.
Methods: The study was done using the National Health and Nutrition Examination Survey (NHANES) 2005-2006 data. NHANES data represent the civilian, non-institutionalized US population. Subject recruitment was based on a multistage, stratified sampling method. Regression models were used to determine the relationship of vitamin D with DM, MetS and IR.
Results: We found a consistent observation in which VD deficiency was significantly associated with DM (OR=2.16), MetS (OR=2.09) and IR (OR=1.83). Female gender, older age, and overweight - all positively associated with DM, MetS or IR.
Conclusion: The inverse relationship of VD status with MetS, IR and DM indicates a strong support of increasing vitamin D intake as an inexpensive intervention strategy in the national endeavor to reduce the burden of MetS, IR, DM, and its complications.
Keywords
Metabolic syndrome, diabetes, vitamin D, vitamin D deficiency
Introduction
Metabolic syndrome (MetS) is a constellation of metabolic disorders, including obesity, glucose abnormality, hypertension and hyperlipidemia [1]. Generally, MetS is highly associated with visceral adiposity, atherogenic dyslipidemia and endothelial dysfunction. In the US, although MetS was reduced from 25.5 to 22.9% between 1999 and 2010, the prevalence of abdominal obesity in adults is still high [2]. Atherogenic dyslipidemia is manifested by elevated plasma triacylglyceride (TG), elevated low-density lipoprotein (LDL) and reduced high-density lipoprotein (HDL) cholesterol [3]. Endothelial dysfunction that significantly contributes to atherosclerosis is the consequence of oxidative stress, advanced glycation products, increased free fatty acid (FFA), and inflammatory cytokines.
It is a well-known fact that vitD regulates calcium metabolism for the development and maintenance of bone health. It has also been increasingly recognized to play a protective role in MetS and cardiovascular diseases (CVD) [4, 5]. Serum concentration of 25(OH)D3, a metabolic intermediate used to determine vitD status, is inversely correlated with body mass index (BMI) and inflammation [6-8]. Moreover, VD is clinically associated with muscle strength, breast cancer, colon cancer, cardiovascular disease, type 1 DM, autoimmune diseases and overall mortality [9-15]. VitD receptor (VDR) is expressed in a wide range of different tissues, including intestine, bone, and kidney [9, 16].
A number of factors influence the status of vitD. It is synthesized in the skin, where exposure to sunlight (UVB) converts 7-dehydrocholesterol to pre-vitD. Continued exposure to UVB converts pre-vitD to vitD, which is transported to the liver and kidney by the 50-kD vitD-binding protein for further processing. Since vitD synthesis depends on the intensity of sun exposure, as a consequence, human vitD status is variable with the seasons. Poor vitD status is reported during the winter, especially in the northern hemisphere [17]. Secondly, the dietary intake of vitD is based on two forms, ergocalciferol (D2) and cholecalciferol (D3). Although there is no convincing data on the preferred form of vitD, D3 is generally assumed to be more effective than D2 in maintaining serum 25(OH)D [18]. The normal cut-off point of 25(OH)D representing adequate vitD status remains controversial. The Endocrine Society recommended daily intake of 1000 to 2000 IU to achieve 30 to 50 ng/ml of 25(OH)D whereas the Institute of Medicine in 2011 released a vitD deficiency (VDD) level at 25(OH)D < 20 ng/ml [19, 20].
According to CDC, only two-thirds of the US population had sufficient vitD levels (50-150 nmol/L) from 2001 to 2006 [11]. This implies that one-third of the population is at risk of deficiency or vitD insufficiency. Given that the main source of vitD comes from sunlight, people who are sedentary or who live away from the tropics may have difficulty obtaining optimal levels. The purpose of this study is to assess the strength of predictive associations between VDD and MetS.
Subjects and Methods
We used the National Health and Nutrition Examination Survey (NHANES) 2005–2006 data (CDCP) to examine the strength of association between vitD and MetS. NHANES data represent the civilian, non-institutionalized US population. Subject recruitment was based on a multistage, stratified sampling method. Detailed survey procedures, including study approval, human subject consent, home or mobile center examinations, interviews and blood collections are available from the NHANES website (CDCP). Thus, no additional review board approval was required for the use of the de-identified public data for secondary analysis considered in this study.
We used the 3 out of 5 risk factors to diagnose MetS according to the definition of ATP III from the American Heart Association (AHA)/National Heart, Lung, and Blood Institute (NHLBI) definition and the 2009 Joint Scientific Statement [2, 21, 22]: 1) Waist circumference (WC) ≥ 102 cm (male adults) and ≥ 88 cm (female adults); 2) FBG ≥ 100 mg/dl; 3) BP ≥ 130/85 mm Hg; 4) TG ≥ 150 mg/dl; and 5) HDL <40 mg/dl (male adults) and <50 mg/dl (female adults). The use of prescription drugs available for lipid-lowering agents, anti-hypertensive, and anti-hyperglycemic medications was not included in the criteria. The criteria used to define MetS was applied to all participants included in the study.
Serum 25 (OH)D determination was done using the DiaSorin 25-OH assay (Stillwater MN) (CDCP) at the National Center for Environmental Health, CDC, Atlanta, GA. The DiaSorin assay kit had been reformulated by the manufacturer in 1998 by introducing an antibody that provided improved binding and altering the washing solution to reduce non-specific binding and the quality control pool drift [23]. As of 2010, 25(OH)D chemical analysis has been revised to adjust NHANES 2000-2006 data to the reformulated DiaSorin assay reagent and calibration. The 2005-2006 data were mathematically adjusted to higher values to avoid the systematic bias identified. WC was measured at the high point of the iliac crest at minimal respiration to the nearest 0.1 cm. Serum TG concentrations were determined with the enzymatic hydrolyzation to glycerol, and HDL was determined by the lipoprotein precipitation method using heparin–manganese chloride. FBG was determined by the enzymatic method. Average of all available BP measurements was used. Race/ethnicity was determined by self-reported survey responses. BMI (kg/m2) was calculated from measured weight and height.
Data analyses included all available participants in the NHANES, 2005–2006 survey. SPSS was used for statistical analysis (Statistical Analysis for Social Scientists version 22, USA). Descriptive statistics included mean comparisons, t-tests for continuous and normally distributed variables, and proportions and Chi-square tests for ordinal and nominal variables. Logistic regression was used to assess the strength of associations between the outcome variable (MetS) and vitD as a predictor variable. Covariates included age, gender, race/ethnicity (White, African American, other races), and BMI. VitD was used as a dichotomous variable transformed using 5, 10, 20, and 30 ng/ml of serum vitD as cut-off values. Missing cases were excluded in each step of the analysis, assuming that the representative nature would not differ remarkably from what was represented by the entire data.
Results
Subject Characteristics
All available data from NHANES 2005-2006 was used for assessing the association of vitD with MetS. As shown in (Table 1), a total of 10,348 participants were included in the analysis. Participant age categories were 1) <20 years (51.9%), 2) 20–39 years (18.6%), 3) 40–59 years (14.4%) and 4) ≥60 years (15.2%). Participants were 49.1% male and 50.9% female. The race was categorized as 1) African American (26.2%), White (38.0%), and 3) Others (35.9%, includes Mexican American, Hispanics, and other mixed races).
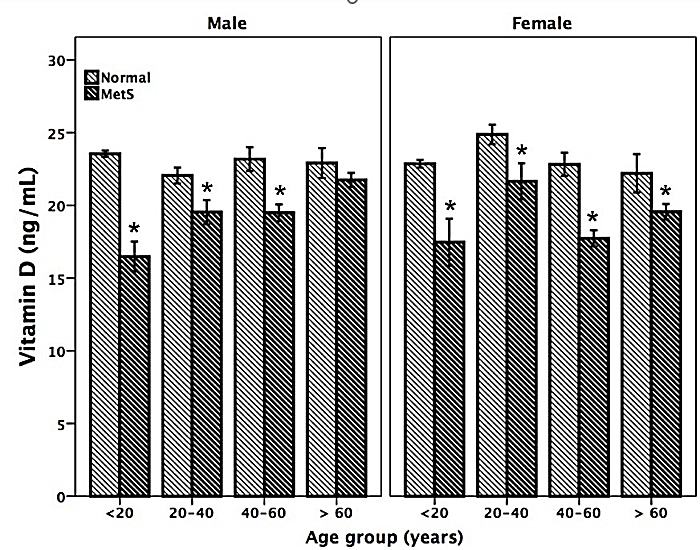
Figure 1: Vitamin D status is low in men and women participants with MetS across the different age groups.
*p < 0.01 MetS versus controls with no MetS
As shown in (Figure 1), VDD was clearly seen to be significantly lower among subjects with MetS across all ages. Logistic regression analysis showed a strong negative correlation between VD levels and the presence of MetS. Subjects within the age range of 20-40 years with VDD were 2.6 times more likely to have MetS. The risk of having MetS progressively increased with age to 6.6 and 10.3 times more likely for those between 40-60 years and those over 60 years, respectively. VitD deficient African Americans and White Americans had a similar risk of having MetS to those categorized as “Other Races”. Overweight/obese individuals of all races with VDD had 60.3 times greater risk of having MetS compared to normal-weight individuals. All covariates had a significant impact on predicting MetS (p<0.001).
Table 1: Demographic Characteristics of Participants.
|
Male |
Female |
Total |
|||||||||
|
Age Groups |
Count |
% of Total |
Count |
% of Total |
Count |
% of Total |
|||||
|
Age1: < 20y |
2693 |
26.0 |
2676 |
25.9 |
5369 |
51.9 |
|||||
|
Age2: 20-39.9y |
844 |
8.2 |
1079 |
10.4 |
1923 |
18.6 |
|||||
|
Age3: 40-59.9y |
742 |
7.2 |
744 |
7.2 |
1486 |
14.4 |
|||||
|
Age4: ≥ 60y |
801 |
7.7 |
769 |
7.4 |
1570 |
15.2 |
|||||
|
Race Groups |
|||||||||||
|
AA |
1360 |
13.1 |
1350 |
13.0 |
2710 |
26.2 |
|||||
|
WA |
1958 |
18.9 |
1970 |
19.0 |
3928 |
38.0 |
|||||
|
Others |
1762 |
17.0 |
1948 |
18.8 |
3710 |
35.9 |
|||||
|
Total |
5080 |
49.1 |
5268 |
50.9 |
10348 |
100 |
|||||
Age of the participants was stratified into groups of 20 years. Race/ethnicity consisted of African Americans (AA), White Americans (WA) and “Others” including Mexican American, other Hispanics, and mixed races.
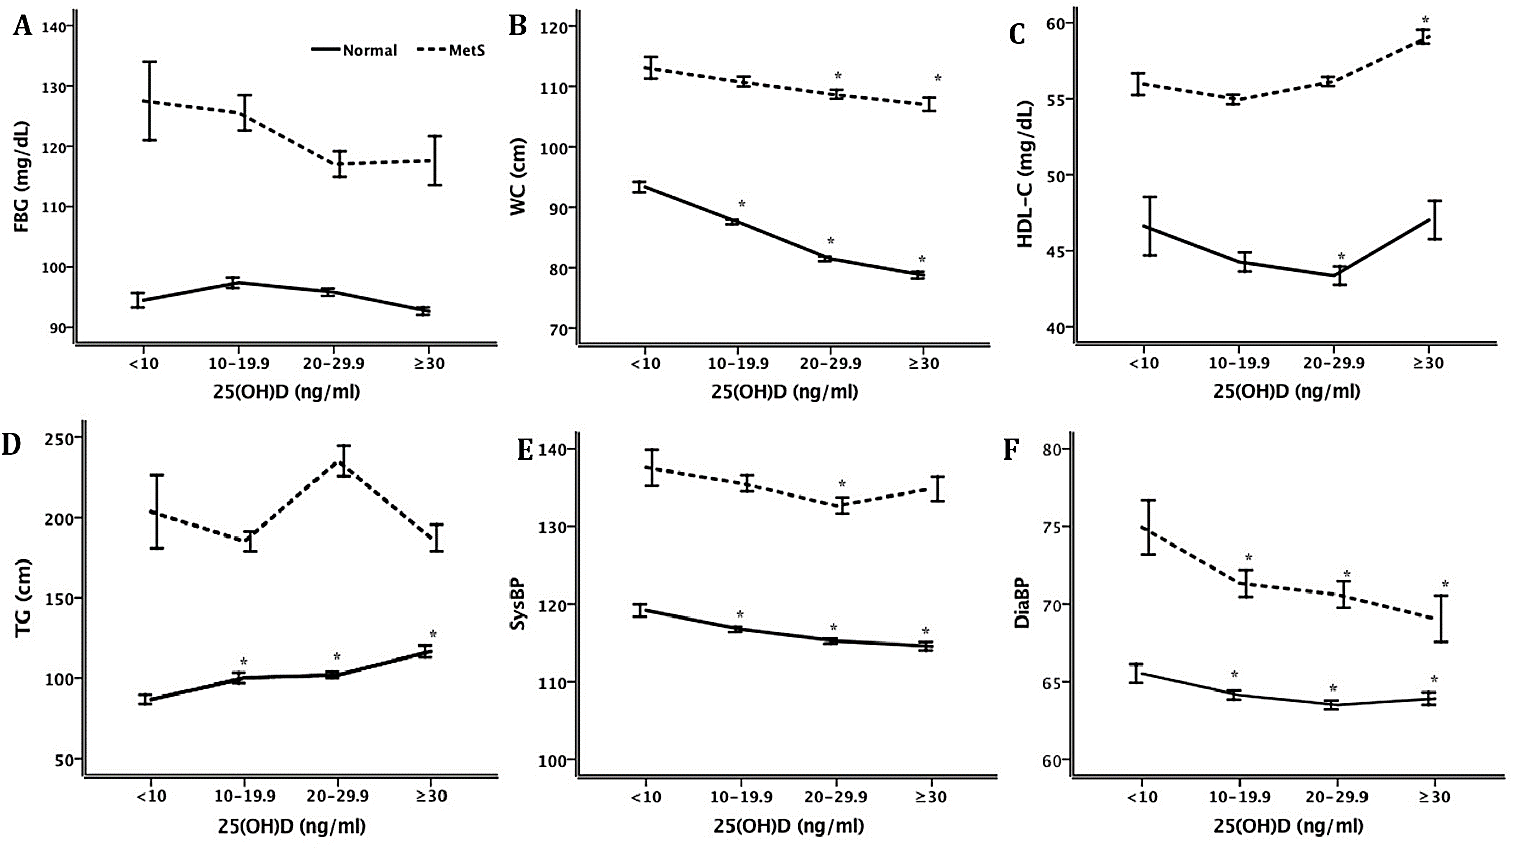
Figure 2: Association of vitD status with risk outcomes of MetS. vitD was categorized in equal intervals shown in the x-axis (Gp1, < 10; Gp2, 10-19.9; Gp3, 20-29.9, and Gp4, ≥30). For trend analysis risk outcomes were compared to the lowest vitD status using one-way ANOVA. The risk outcomes analyzed were, HDL, WC, diastolic BP, systolic BP, TG and FBG.
As shown in (Figure 2A), those participant groups with MetS and very low VitD levels were found to have significantly higher fasting blood sugar levels, but as the VitD status normalized the blood sugar progressively improved and was not statistically different among those with and without MetS. Waist circumference was inversely related to vitD status in the group without MetS, but it did not reach statistical significance (Figure 2B). HDL concentrations showed a U-shaped relationship (Figure 2C) when correlated to vitD status with different minimum levels of lowest 25(OH)D concentrations, 10-20 ng/ml for those with MetS and 20-30 ng/ml for those without MetS. In subjects without MetS, TG concentration (Figure 2D) steadily increased with increasing vitD status. Participants with MetS generally had higher TG than those without MetS, but the difference was only significant when vitD status was the lowest. Systolic blood pressure was inversely related to vitD status in the group without MetS (Figure 2E). For the group without MetS, systolic BP was inversely related to vitD concentrations steadily. Participants with MetS had generally about 20 mmHg higher BP than the group without MetS. Diastolic blood pressure was similarly inversely related to vitD status in both groups without and with MetS (Figure 2F). Those participants with MetS generally had about 8 mmHg higher BP than the group without MetS.
Table 2: Logistic Regression on the Association of MetS and VDD. MetS was used as outcome variable whereas vitD status was used as independent variable for individual risk outcomes describing MetS.
|
|
B
|
S.E.
|
Wald
|
df
|
p
|
OR |
95% C.I. for OR
|
|
|
Lower |
Upper |
|||||||
|
MetS |
|
|
|
|
|
|
|
|
|
25(OH)D ≥5 ng/ml |
0.9 |
0.5 |
3 |
1 |
0.081 |
2.5 |
0.9 |
7.0 |
|
25(OH)D ≥10 ng/ml |
-0.2 |
0.1 |
2 |
1 |
0.133 |
0.8 |
0.7 |
1.1 |
|
25(OH)D ≥20 ng/ml |
-0.3 |
0.1 |
17 |
1 |
0.000 |
0.7 |
0.6 |
0.8 |
|
25(OH)D ≥30 ng/ml |
-0.1 |
0.1 |
1 |
1 |
0.370 |
0.9 |
0.7 |
1.1 |
|
WC |
|
|
|
|
|
|
|
|
|
25(OH)D ≥5 ng/ml |
0.2 |
0.3 |
1 |
1 |
0.418 |
1.3 |
0.7 |
2.2 |
|
25(OH)D ≥10 ng/ml |
-0.5 |
0.1 |
41 |
1 |
0.000 |
0.6 |
0.5 |
0.7 |
|
25(OH)D ≥20 ng/ml |
-0.4 |
0.1 |
51 |
1 |
0.000 |
0.7 |
0.6 |
0.8 |
|
25(OH)D ≥30 ng/ml |
-0.2 |
0.1 |
5 |
1 |
0.024 |
0.8 |
0.7 |
1.0 |
|
HDL |
|
|
|
|
|
|
|
|
|
25(OH)D ≥5 ng/ml |
0.1 |
0.3 |
0 |
1 |
0.791 |
1.1 |
0.6 |
2.0 |
|
25(OH)D ≥10 ng/ml |
-0.1 |
0.1 |
1 |
1 |
0.438 |
0.9 |
0.8 |
1.1 |
|
25(OH)D ≥20 ng/ml |
-0.1 |
0.1 |
5 |
1 |
0.029 |
0.9 |
0.8 |
1.0 |
|
25(OH)D ≥30 ng/ml |
-0.4 |
0.1 |
19 |
1 |
0.000 |
0.7 |
0.6 |
0.8 |
|
TG |
|
|
|
|
|
|
|
|
|
25(OH)D ≥5 ng/ml |
0.6 |
0.6 |
1 |
1 |
0.335 |
1.8 |
0.5 |
6.3 |
|
25(OH)D ≥10 ng/ml |
0.3 |
0.1 |
5 |
1 |
0.029 |
1.4 |
1.0 |
1.8 |
|
25(OH)D ≥20 ng/ml |
0.1 |
0.1 |
2 |
1 |
0.123 |
1.2 |
1.0 |
1.4 |
|
25(OH)D ≥30 ng/ml |
0.1 |
0.1 |
0 |
1 |
0.554 |
1.1 |
0.8 |
1.4 |
|
FBG |
|
|
|
|
|
|
|
|
|
25(OH)D ≥5 ng/ml |
0.3 |
0.4 |
1 |
1 |
0.463 |
1.4 |
0.6 |
3.3 |
|
25(OH)D ≥10 ng/ml |
0.0 |
0.1 |
0 |
1 |
0.785 |
1.0 |
0.8 |
1.3 |
|
25(OH)D ≥20 ng/ml |
-0.1 |
0.1 |
2 |
1 |
0.168 |
0.9 |
0.7 |
1.1 |
|
25(OH)D ≥30 ng/ml |
-0.2 |
0.1 |
3 |
1 |
0.109 |
0.8 |
0.7 |
1.0 |
|
BP |
|
|
|
|
|
|
|
|
|
25(OH)D ≥5 ng/ml |
1.0 |
0.4 |
5 |
1 |
0.022 |
2.8 |
1.2 |
6.6 |
|
25(OH)D ≥10 ng/ml |
-0.2 |
0.1 |
3 |
1 |
0.069 |
0.8 |
0.7 |
1.0 |
|
25(OH)D ≥20 ng/ml |
-0.1 |
0.1 |
5 |
1 |
0.029 |
0.9 |
0.8 |
1.0 |
|
25(OH)D ≥30 ng/ml |
0.0 |
0.1 |
0 |
1 |
0.856 |
1.0 |
0.8 |
1.2 |
Table 2 shows the strength of the association between VDD (based on different cut-off points) and the risk of having MetS. Logistic regression showed that participants having vitD levels of 5 ng/ml or less had more hypertension with an OR of 2.8; 95%CI (1.2, 6.6). VDD, particularly at concentrations below 5 ng/ml, predicted the risk of high BP according to the definition used in MetS. Keeping other factors constant, the risk of having high blood pressure among participants with MetS and VDD was 2.8 times more than those without MetS.
VDD with levels less than 10 ng/ml (25 nmol/L) was significantly associated with hypertriglyceridemia and increased WC with an OR of 1.4; 95% CI (1.0, 1.8) and OR 0.6; 95% CI (0.5, 0.7), respectively. WC, which is a better marker of central obesity, was inversely associated with VDD.
Similarly, participants with MetS having levels of 25(OH)D less than 30 ng/ml (75 nmol/L) were found to have low levels of HDL when compared to those without MetS.
This study confirmed that VDD is predictive of MetS when the 25(OH)D less than 20 ng/ml was used as the highest cut-off value. Within this group, VDD prevalence was 45.9% of valid cases. From the same data, Forrest et al. reported that VDD was highest among adult African Americans (82.1%) and Hispanics (69.2%) [24]. Out of 10348 subjects, 4029 (38.9%) had no MetS whereas 1140 (11.0%) had MetS. Among the subjects who had MetS, 52.2% had VDD, whereas 34.4% of those without MetS had VDD. As revealed by the chi-square test, the association of MetS and VDD (based on 20 ng/ml cut-off point) was highly significant (λ2=114, p<0.001). Risk analysis for this association showed an odds ratio of 2.1, 95% CI (1.8, 2.4).
The 25(OH)D concentration showed a mean linear decrease from 23.2 ng/ml in groups without MetS to 18.9 ng/ml in those with the highest MetS risk. Corresponding to lowest (25(OH)D<10 ng/ml) to highest (25(OH)D ≥ 30 ng/ml) groups respectively, HDL increased from 53.5 to 59.4 mg/dl; TG decreased from 136.5 to 116.5 mg/dl; WC decreased from 96.1 to 80.8 cm for 25(OH)D group 30 to 39.9 ng/ml. Similarly, systolic BP decreased from 121.7 to 116.5 mmHg, whereas diastolic BP decreased from 66.8 to 64.0 mmHg, respectively. All parameters are in line with the definition of MetS except FBG, which showed neither a linear trend nor a significant prediction of MetS with increasing vitD status.
In the absence of MetS, 25(OH)D ranging from 20-30 ng/ml showed a significant protective predictor of BP (OR=0.8; 95%CI (0.7, 0.95)). This association did not reach significance for those who had MetS already. Better vitD status did not show better BP in this group of participants.
In this study, logistic regression analyses were developed to describe the relationship of VDD with MetS. The relationships were assessed before and after adjusting for covariates, namely gender (male as reference), Age 1 (<20 years used as a reference), Age 2 (20-40 years), Age 3 (40-60 years), Age 4 (60+ years). Overall, participants with better vitD status were at lower MetS risk. The analysis revealed an optimum concentration of 25(OH)D predicting VDD and the associations with combined risk outcomes of MetS, namely, WC, HDL, TG, FBG and BP. Based on BP, VDD at 25(OH)D < 20 ng/ml clearly represent an optimal cut-off point for the assessment of vitD deficiency. Based on HDL and WC, higher concentrations of 25(OH)D was more beneficial. VitD status is generally related to MetS and its risk outcomes. The result of this study sheds some light in the debate as to whether vitD status contributes to cardio metabolic risk over long periods of time. VDD and all covariates, including female gender, older age, and overweight positively predicted MetS.
Discussion
Data of the US population presented in this study showed a significant association of VDD and MetS. Our study confirmed several other reports that have identified similar inverse associations between vitD levels and prevalence of MetS, however it should also be known that there are other studies that reported the contrary [25-27]. The difference in the outcomes of these studies might be attributed to confounders and statistical over-adjustments of the data variables besides a smaller sample size. In our study, we adjusted for a select few variables found to be of significant relevance in the prediction models, namely gender, race, age and BMI. In doing so, VDD was found to be positively predictive of MetS with or without the contribution of covariates, including female gender, older age, and overweight/obesity. However, several other factors not adjusted for such as psychosocial factors, life style variables including, smoking, alcohol use, exercise and dietary factors such as vitamins A, K and C, calcium and magnesium might have been potential confounders.
A number of risk factors enhance the progression of MetS to DM and its complications. The development of DM is mainly due to defects in insulin secretion and insulin action in peripheral tissues (muscle, adipose and the liver). The combined genetic and lifestyle factors directly or indirectly interact towards the development of DM. These may include dietary habits, lifestyle, obesity, adipose tissue location, insulin secretion, insulin action, production of pro-inflammatory products, and endothelial integrity. The consistent association of VDD with these factors renders VDD a potential predictor of MetS.
In this study, we showed a significant association of MetS with VDD. VDD by itself is a predictor of cardiovascular diseases and has been shown to contribute to all-cause mortality [28]. It has been suggested that VDD may be used as a screening tool in the efforts preventing the public from cardiovascular mortality [24]. However, several factors may bias measurements of vitD status in patients, which in turn confound the exact relationship of vitD to metabolic abnormalities. For instance, the D2 and D3 forms of vitD may differently influence vitD status in terms of their serum 25(OH)D outputs [18]. While serum 25(OH)D level is a useful marker of VitD status, the absence of a linear response in serum 25(OH)D to vitD intake makes it difficult to determine the ideal amount of vitD patients need to consume [29]. Baseline serum levels, dose and duration of VitD supplementation, as well as frequency, and type of vitD used, in determining vitamin D status in the general population may affect the vitD status. Our data, being a cross-sectional study, provides no causal evidence for vitD status and MetS.
The recommended vitD intake varies for patients with different medical conditions, such as osteoporosis, metabolic disorders, cancer, and immunological conditions [30, 31]. With regard to the use of serum 25(OH)D as a reliable marker of vitD status, controversies surrounding the effectiveness of vitamin D2 versus D3 in raising 25HOD levels remains unresolved [30]. Some studies show that D3 is superior to D2 in raising 25OHD levels whereas others suggest that D2 and D3 are equally effective [19, 31-33]. Armas et al. showed that the two different forms of vitD produce similar rises in serum 25(OH)D over the initial 1 to 3 days of administration. The levels of 25(OH)D continues to rise with D3 and peaks at day 14 but falls to baseline by day 14 in those taking D2; thus, they concluded that D2 is less potent [18].
Vitamin D3, which is commercially derived from UVB irradiating 7-dehydrocholesterol, is obtained from lanolin in sheep's wool. Its animal origin deters its wider utilization, especially by strict vegetarian communities and vegans [34]. These controversies indicate the importance of using D2 and D3 VitD forms depending on their utilization by different people having different beliefs in their diet.
MetS is linked with insulin resistance, which is a situation whereby the action of insulin is significantly impaired at the cellular level. The exact mechanism is not yet clear. However, it is a defect seen in the insulin signaling pathway after it was initiated by molecular binding of the insulin-to-insulin receptor that induces a cascade of molecular activations leading to glucose uptake [35-38]. Any impairment in this physiological process, including inappropriate activation of other proteins, can cause insulin resistance and intolerance of glucose transport both systemically or locally [39, 40]. Depending on the pathophysiological status of cells, the adipose tissue can produce active substances that are either beneficial or detrimental for insulin sensitivity (e.g., adiponectin, leptin, and TNF-α), leading to MetS, DM and its complications [41].
This study weighs in over the debate of whether vitD status over long periods of time contributes to cardio metabolic risk. Prior to the development of MetS, vitD showed protection in the outcome variables used to define MetS. Worsening of MetS risk was observed with VDD. Prediction of MetS risk outcomes with VDD was lost in participants already in a state of MetS. This study also provides valuable information to contribute to the current debate as to what constitutes a 25(OH)D value that should be used as a target for vitamin D adequacy.
When evaluating the association VDD with the other risk factors considered in this study, no single value could be determined as optimum. However, 25(OH)D ranging from 20 to 40 ng/ml showed protective predictions against cardio-metabolic risk factors. Within this range of values, the higher the concentration of 25(OH)D the better. Defining variables of MetS such as TG, WC and HDL showed increased risk with low vitD status. Increased protective effects of better vitD status were evident in each risk outcome variable that are components of MetS, which includes DM and insulin resistance.
This study has a number of limitations. First, the cross-sectional study design in such a study would fail to establish causality. The sample size limitation to a further stratification and consideration of other factors would hinder the creation of samples of sufficient homogeneity and further details in the analysis. Yet, several lifestyle and dietary factors unaccounted for in this study are potential confounders of the relationship between VDD and metabolic diseases. vitD status variation is also limited by the season of blood collection for 25(OH)D analysis and the latitudinal locations of participants. Nevertheless, our results showed that age, gender and BMI are significant predictors and/or confounders in the relationship demonstrated between VDD and MetS.
Overall, the association of VDD and MetS and its components offer strong support for the provision of vitD supplementation as an inexpensive intervention strategy in the national endeavor to reduce the burden of MetS in the US. It is reasonable to encourage vitD supplementation, food fortification and increased intake of traditional dietary sources of vitD such as fish, fish oils and dairy products so as to reduce the prevalence of vitamin D deficiency in the population.
Acknowledgment
This study was supported by Internal Medicine, the Medical School of Wayne State University. Dr. Richard Miller has contributed on the initial planning and write of the paper. But then because of chronic problem he had he passed away.
Author Contributions
A.F. researched the data and had written the manuscript. R.M. reviewed/edited the manuscript. L.W. researched the data. B.S. reviewed/edited the manuscript.
Conflicts of Interest
None.
Abbreviations
ATP III: adult treatment panel
BMI: body mass index
BP: blood pressure
CDC: centers for disease control and prevention
CVD: cardiovascular diseases
D2: ergocalciferol
D3: cholecalciferol
DM: diabetes mellitus
FBG: fasting blood glucose
HDL: high-density lipoprotein
HOMA-IR: insulin resistance homeostatic model assessment
IL-6: interleukin-6
LDL: low-density lipoprotein
MetS: metabolic syndrome
NHANES: national health and nutrition examination survey
NHLBI: national heart, lung, and blood institute
OR: odds ratio
TG: triacylglyceride
TNFα: tumor necrosis factor α
UVB: ultraviolet B
VitD: vitamin D
VDD: vitamin D deficiency
VDR: vitamin D receptor
μM: micromoles/liter
Article Info
Article Type
Research ArticlePublication history
Received: Mon 11, May 2020Accepted: Thu 28, May 2020
Published: Thu 30, Jul 2020
Copyright
© 2023 Berhane Seyoum. This is an open-access article distributed under the terms of the Creative Commons Attribution License, which permits unrestricted use, distribution, and reproduction in any medium, provided the original author and source are credited. Hosting by Science Repository.DOI: 10.31487/j.JDMC.2020.01.03
Figures & Tables
Table 1: Demographic Characteristics of Participants.
|
Male |
Female |
Total |
|||||||||
|
Age Groups |
Count |
% of Total |
Count |
% of Total |
Count |
% of Total |
|||||
|
Age1: < 20y |
2693 |
26.0 |
2676 |
25.9 |
5369 |
51.9 |
|||||
|
Age2: 20-39.9y |
844 |
8.2 |
1079 |
10.4 |
1923 |
18.6 |
|||||
|
Age3: 40-59.9y |
742 |
7.2 |
744 |
7.2 |
1486 |
14.4 |
|||||
|
Age4: ≥ 60y |
801 |
7.7 |
769 |
7.4 |
1570 |
15.2 |
|||||
|
Race Groups |
|||||||||||
|
AA |
1360 |
13.1 |
1350 |
13.0 |
2710 |
26.2 |
|||||
|
WA |
1958 |
18.9 |
1970 |
19.0 |
3928 |
38.0 |
|||||
|
Others |
1762 |
17.0 |
1948 |
18.8 |
3710 |
35.9 |
|||||
|
Total |
5080 |
49.1 |
5268 |
50.9 |
10348 |
100 |
|||||
Age of the participants was stratified into groups of 20 years. Race/ethnicity consisted of African Americans (AA), White Americans (WA) and “Others” including Mexican American, other Hispanics, and mixed races.
Table 2: Logistic Regression on the Association of MetS and VDD. MetS was used as outcome variable whereas vitD status was used as independent variable for individual risk outcomes describing MetS.
|
|
B
|
S.E.
|
Wald
|
df
|
p
|
OR |
95% C.I. for OR
|
|
|
Lower |
Upper |
|||||||
|
MetS |
|
|
|
|
|
|
|
|
|
25(OH)D ≥5 ng/ml |
0.9 |
0.5 |
3 |
1 |
0.081 |
2.5 |
0.9 |
7.0 |
|
25(OH)D ≥10 ng/ml |
-0.2 |
0.1 |
2 |
1 |
0.133 |
0.8 |
0.7 |
1.1 |
|
25(OH)D ≥20 ng/ml |
-0.3 |
0.1 |
17 |
1 |
0.000 |
0.7 |
0.6 |
0.8 |
|
25(OH)D ≥30 ng/ml |
-0.1 |
0.1 |
1 |
1 |
0.370 |
0.9 |
0.7 |
1.1 |
|
WC |
|
|
|
|
|
|
|
|
|
25(OH)D ≥5 ng/ml |
0.2 |
0.3 |
1 |
1 |
0.418 |
1.3 |
0.7 |
2.2 |
|
25(OH)D ≥10 ng/ml |
-0.5 |
0.1 |
41 |
1 |
0.000 |
0.6 |
0.5 |
0.7 |
|
25(OH)D ≥20 ng/ml |
-0.4 |
0.1 |
51 |
1 |
0.000 |
0.7 |
0.6 |
0.8 |
|
25(OH)D ≥30 ng/ml |
-0.2 |
0.1 |
5 |
1 |
0.024 |
0.8 |
0.7 |
1.0 |
|
HDL |
|
|
|
|
|
|
|
|
|
25(OH)D ≥5 ng/ml |
0.1 |
0.3 |
0 |
1 |
0.791 |
1.1 |
0.6 |
2.0 |
|
25(OH)D ≥10 ng/ml |
-0.1 |
0.1 |
1 |
1 |
0.438 |
0.9 |
0.8 |
1.1 |
|
25(OH)D ≥20 ng/ml |
-0.1 |
0.1 |
5 |
1 |
0.029 |
0.9 |
0.8 |
1.0 |
|
25(OH)D ≥30 ng/ml |
-0.4 |
0.1 |
19 |
1 |
0.000 |
0.7 |
0.6 |
0.8 |
|
TG |
|
|
|
|
|
|
|
|
|
25(OH)D ≥5 ng/ml |
0.6 |
0.6 |
1 |
1 |
0.335 |
1.8 |
0.5 |
6.3 |
|
25(OH)D ≥10 ng/ml |
0.3 |
0.1 |
5 |
1 |
0.029 |
1.4 |
1.0 |
1.8 |
|
25(OH)D ≥20 ng/ml |
0.1 |
0.1 |
2 |
1 |
0.123 |
1.2 |
1.0 |
1.4 |
|
25(OH)D ≥30 ng/ml |
0.1 |
0.1 |
0 |
1 |
0.554 |
1.1 |
0.8 |
1.4 |
|
FBG |
|
|
|
|
|
|
|
|
|
25(OH)D ≥5 ng/ml |
0.3 |
0.4 |
1 |
1 |
0.463 |
1.4 |
0.6 |
3.3 |
|
25(OH)D ≥10 ng/ml |
0.0 |
0.1 |
0 |
1 |
0.785 |
1.0 |
0.8 |
1.3 |
|
25(OH)D ≥20 ng/ml |
-0.1 |
0.1 |
2 |
1 |
0.168 |
0.9 |
0.7 |
1.1 |
|
25(OH)D ≥30 ng/ml |
-0.2 |
0.1 |
3 |
1 |
0.109 |
0.8 |
0.7 |
1.0 |
|
BP |
|
|
|
|
|
|
|
|
|
25(OH)D ≥5 ng/ml |
1.0 |
0.4 |
5 |
1 |
0.022 |
2.8 |
1.2 |
6.6 |
|
25(OH)D ≥10 ng/ml |
-0.2 |
0.1 |
3 |
1 |
0.069 |
0.8 |
0.7 |
1.0 |
|
25(OH)D ≥20 ng/ml |
-0.1 |
0.1 |
5 |
1 |
0.029 |
0.9 |
0.8 |
1.0 |
|
25(OH)D ≥30 ng/ml |
0.0 |
0.1 |
0 |
1 |
0.856 |
1.0 |
0.8 |
1.2 |
*p < 0.01 MetS versus controls with no MetS
References
- Paul L Huang (2009) A comprehensive definition for metabolic syndrome. Dis Model Mech 2: 231-237. [Crossref]
- Hiram Beltrán-Sánchez , Michael O Harhay, Meera M Harhay, Sean McElligott (2013) Prevalence and Trends of Metabolic Syndrome in the Adult U.S. Population, 1999–2010. J Am Coll Cardiol 62: 697-703. [Crossref]
- Clay F. Semenkovich (2006) Insulin resistance and atherosclerosis. J Clin Invest 116: 1813-1822. [Crossref]
- B J Boucher (1998) Inadequate vitamin D status: does it contribute to the disorders comprising syndrome ‘X’? Br J Nutr 79: 315-327. [Crossref]
- Jared P Reis, Denise von Mühlen, Edgar R Miller 3rd (2008) Relation of 25-hydroxyvitamin D and parathyroid hormone levels with metabolic syndrome among US adults. Eur J Endocrinol 159: 41-48. [Crossref]
- Michael F Holick, Neil C Binkley, Heike A Bischoff-Ferrari, Catherine M Gordon, David A Hanley et al. (2011) Evaluation, Treatment, and Prevention of Vitamin D Deficiency: an Endocrine Society Clinical Practice Guideline. J Clin Endocrinol Metab 96: 1911-1930. [Crossref]
- Susan Cheng, Joseph M Massaro, Caroline S Fox, Martin G Larson, Michelle J Keyes (2009) Adiposity, cardiometabolic risk, and vitamin D status: the Framingham Heart Study. Diabetes 59: 242-248. [Crossref]
- Margherita T Cantorna, Sanhong Yu, Danny Bruce (2008) The paradoxical effects of vitamin D on type 1 mediated immunity. Mol Aspects Med 29: 369-375. [Crossref]
- Marjolein Visser, Dorly J H Deeg, Paul Lips, Longitudinal Aging Study Amsterdam (2003) Low Vitamin D and High Parathyroid Hormone Levels as Determinants of Loss of Muscle Strength and Muscle Mass (Sarcopenia): The Longitudinal Aging Study Amsterdam. J Clin Endocrinol Metab 88: 5766-5772. [Crossref]
- Joan M Lappe, Dianne Travers-Gustafson, K Michael Davies, Robert R Recker, Robert P Heaney (2007) Vitamin D and calcium supplementation reduces cancer risk: results of a randomized trial. Randomized Controlled Trial 85: 1586-1591. [Crossref]
- D M Freedman, M Dosemeci, K McGlynn (2002) Sunlight and mortality from breast, ovarian, colon, prostate, and non-melanoma skin cancer: a composite death certificate-based case-control study. Occup Environ Med 59: 257-262. [Crossref]
- Dae Hyun Kim, Siamak Sabour, Utpal N Sagar, Suzanne Adams, David J Whellan (2008) Prevalence of Hypovitaminosis D in Cardiovascular Diseases (from the National Health and Nutrition Examination Survey 2001 to 2004). Am J Cardiol 102: 1540-1544. [Crossref]
- E Hyppönen, E Läärä, A Reunanen, M R Järvelin, S M Virtanen (2001) Intake of vitamin D and risk of type 1 diabetes: a birth-cohort study. Lancet 358: 1500-1503. [Crossref]
- Cutolo M, K Otsa, M Uprus, S Paolino and B Seriolo (2007) Vitamin D in rheumatoid arthritis. Autoimmunity Rev 7: 59-64.
- Michal L Melamed, Erin D Michos, Wendy Post, Brad Astor (2008) 25-hydroxyvitamin d levels and the risk of mortality in the general population. Arch Intern Med 168: 1629-1637. [Crossref]
- Yong-Guo Zhang, Shaoping Wu, Jun Sun (2013) Vitamin D, vitamin D receptor and tissue barriers. Tissue Barriers 1: e23118. [Crossref]
- Carlos Eduardo Andrade Chagas, Maria Carolina Borges, Lígia Araújo Martini, Marcelo Macedo Rogero (2012) Focus on vitamin D, inflammation and type 2 diabetes. Nutrients 4: 52-67. [Crossref]
- Laura A G Armas, Bruce W Hollis, Robert P Heaney (2004) Vitamin D2 Is Much Less Effective than Vitamin D3 in Humans. J Clin Endocrinol Metab 89: 5387-5391. [Crossref]
- Rachael M Biancuzzo, Azzie Young, Douglass Bibuld, Mona H Cai, Michael R Winter (2010) Fortification of orange juice with vitamin D(2) or vitamin D(3) is as effective as an oral supplement in maintaining vitamin D status in adults. Am J Clin Nutr 91: 1621-1626. [Crossref]
- Anne C Looker, Clifford L Johnson, David A Lacher, Christine M Pfeiffer, Rosemary L Schleicher et al. (2011) Vitamin D status: United States, 2001-2006. NCHS Data Brief 59: 1-8. [Crossref]
- K G M M Alberti, Robert H Eckel, Scott M Grundy, Paul Z Zimmet, James I Cleeman et al. (2009) Harmonizing the Metabolic Syndrome: A Joint Interim Statement of the International Diabetes Federation Task Force on Epidemiology and Prevention; National Heart, Lung, and Blood Institute; American Heart Association; World Heart Federation; International Atherosclerosis Society; and International Association for the Study of Obesity. Circulation 120: 1640-1645. [Crossref]
- Adit A Ginde, Jonathan M Mansbach, Carlos A Camargo Jr (2009) Association between serum 25-hydroxyvitamin D level and upper respiratory tract infection in the Third National Health and Nutrition Examination Survey. Arch Intern Med 169: 384-390. [Crossref]
- CDCP, CfDCaP Centers for Disease Control and Prevention. NHANES 2005–2006.
- Kimberly Y Z Forrest, Wendy L Stuhldreher (2011) Prevalence and correlates of vitamin D deficiency in US adults. Nutr Res 31: 48-54. [Crossref]
- Jared P Reis, Denise von Mühlen, Donna Kritz-Silverstein, Deborah L Wingard, Elizabeth Barrett-Connor (2007) Vitamin D, Parathyroid Hormone Levels, and the Prevalence of Metabolic Syndrome in Community-Dwelling Older Adults. Diabetes Care 30: 1549-1555. [Crossref]
- Earl S Ford, Guixiang Zhao, Chaoyang Li, William S Pearson (2009) Serum concentrations of vitamin D and parathyroid hormone and prevalent metabolic syndrome among adults in the United States. J Diabetes 1: 296-303. [Crossref]
- Jøran Hjelmesaeth, Dag Hofsø, Erlend T Aasheim, Trond Jenssen, Johan Moan, Helle Hager et al. (2009) Parathyroid hormone, but not vitamin D, is associated with the metabolic syndrome in morbidly obese women and men: a cross-sectional study. Cardiovasc Diabetol 8: 7. [Crossref]
- John H Lee, James H O'Keefe, David Bell, Donald D Hensrud, Michael F Holick (2008) Vitamin D Deficiency. An Important, Common, and Easily Treatable Cardiovascular Risk Factor? J Am Coll Cardiol 52: 1949-1956. [Crossref]
- Institute of Medicine, F a N B (2010) Dietary Reference Intakes for Calcium and Vitamin D. . Washington, DC: National Academy Press.
- Reinhold Vieth, Heike Bischoff-Ferrari, Barbara J Boucher, Bess Dawson-Hughes, Cedric F Garland et al. (2007) The urgent need to recommend an intake of vitamin D that is effective. Am J Clin Nutr 85: 649-650. [Crossref]
- H M Trang, D E Cole, L A Rubin, A Pierratos, S Siu (1998) Evidence that vitamin D3 increases serum 25-hydroxyvitamin D more efficiently than does vitamin D2. Am J Clin Nutr 68: 854-858. [Crossref]
- Paul Glendenning, Gerard T Chew, Hannah M Seymour, Melissa J Gillett, Peter R Goldswain et al. (2009) Serum 25-hydroxyvitamin D levels in vitamin D-insufficient hip fracture patients after supplementation with ergocalciferol and cholecalciferol. Bone 45: 870-875. [Crossref]
- Michael F Holick, Rachael M Biancuzzo, Tai C Chen, Ellen K Klein, Azzie Young et al. (2008) Vitamin D2 is as effective as vitamin D3 in maintaining circulating concentrations of 25-hydroxyvitamin D. J Clin Endocrinol Metab 93: 677-681. [Crossref]
- Margaret Ashwell, Elaine M Stone, Heiko Stolte, Kevin D Cashman, Helen Macdonald et al. (2010) UK Food Standards Agency Workshop Report: an investigation of the relative contributions of diet and sunlight to vitamin D status. Br J Nutr 104: 603-611. [Crossref]
- R A Heller-Harrison, M Morin, M P Czech (1995) Insulin Regulation of Membrane-associated Insulin Receptor Substrate 1. J Biol Chem 270: 24442-24450. [Crossref]
- Max C Petersen, Gerald I Shulman (2018) Mechanisms of Insulin Action and Insulin Resistance. Physiol Rev 98: 2133-2223. [Crossref]
- Michael P Czech (2020) Mechanisms of insulin resistance related to white, beige, and brown adipocytes. Mol Metab 34: 27-42. [Crossref]
- Kanwal Rehman, Kamran Haider, Komal Jabeen, Muhammad Sajid Hamid Akash (2020) Current perspectives of oleic acid: Regulation of molecular pathways in mitochondrial and endothelial functioning against insulin resistance and diabetes. Rev Endocr Metab Disord [Crossref]
- J M Backer, G G Schroeder, C R Kahn, M G Myers Jr, P A Wilden et al. (1992) Insulin stimulation of phosphatidylinositol 3-kinase activity maps to insulin receptor regions required for endogenous substrate phosphorylation. J Biol Chem 267: 1367-1374. [Crossref]
- Charlotte Brøns, Louise Groth Grunne (2017) MECHANISMS IN ENDOCRINOLOGY: Skeletal muscle lipotoxicity in insulin resistance and type 2 diabetes: a causal mechanism or an innocent bystander? Eur J Endocrinol 176: R67-R78. [Crossref]
- Amaia Rodríguez, Silvia Ezquerro, Leire Méndez-Giménez, Sara Becerril, Gema Frühbeck (2015) Revisiting the adipocyte: a model for integration of cytokine signaling in the regulation of energy metabolism. Am J Physiol Endocrinol Metab 309: E691-E714. [Crossref]