Study on the Administration Method of Combining Tetrandrine with Adriamycin to Reverse Drug-Resistance of Leukemia
A B S T R A C T
Increasing drug efflux pumps (P-gp) on the cell membrane due to the overexpression of MDR1 gene in tumor cells is the main mechanism of multidrug resistance of cancer cells. P-gp belongs to the ATP-binding cassette family and functions as a transmembrane efflux pump that translocates chemotherapy drugs from an intracellular to an extracellular domain; thus, it is impossible to achieve efficient drug accumulation in tumor cells. Tetrandrine (TTD) has been shown in both in vitro and in animal experiments to reverse MDR by reducing the expression of MDR1 mRNA and P-gp. However, the effect of administration of TTD one week before chemotherapy is not ideal in the current clinical trials. In view of the previous in vitro and animal experiments have confirmed the effect of TTD in reversing the drug resistance of leukemia, this study returned to the cell experiment, selected K562 and K562/ADM cell lines as the research object, through different ADM combined with TTD administration sequences, to detect the inhibitory effect of different administration sequences on cell proliferation and whether it affected the intracellular ADM concentration, P- gp ATPase activity, MDR1 mRNA and P-gp expression levels, comparing the effect of TTD combined with ADM different administration sequences on the reversal of MDR in K562/ADM cells. We found that TTD can significantly antagonize P-gp-mediated ADM resistance by competitively binding P-gp and down-regulating P-gp expression and we, therefore, conclude that the co-administration of TTD, as a drug resistance reversal agent with ADM may be a better administration in the clinic.
Keywords
Multidrug resistance, reversal agents, tetrandrine, adriamycin, K562/ADM
Introduction
In the type of leukemia, Acute myeloid leukemia (AML) predominantly affects the elderly, with a median age of 69 years at the time of diagnosis. For decades, chemotherapy has been the most basic treatment for AML, especially the main treatment for elderly patients. However, elderly patients have not responded well to chemotherapy, with a long-term survival rate of only 5%~15% and median overall survival <1 year [1, 2]. Multidrug resistance (MDR) is considered to be the most important and common cause of cancer chemotherapy failure [3]. Therefore, the key to improve the clinical therapeutic effect of tumor is to overcome MDR.
Previous studies have shown that the main mechanism of MDR is closely related to the overexpression of transmembrane proteins. ATP-binding cassette (ABC) transporters are ATP-dependent efflux pumps on cell membranes that transfer substrates from an intracellular to an extracellular domain, directly reducing intracellular drug concentration and leading to drug resistance [4]. The p-glycoprotein (P-gp) is the first ABC transporter in human mammals to be identified and is composed of 1,280 amino acids that contain two homologous parts, each consisting of a Transmembrane domain (TMD) and a Nucleotide binding domain (NBD). TMDs are responsible for binding and transporting substrates, and NBDs have ATP binding sites and ATPase activity and can provide energy through ATP hydrolysis. P-gp-mediated drug resistance is mainly determined by P-gp adenosine triphosphatase (ATPase) activity and drug-induced ATP hydrolysis by transport [5-7]. P-gp is widely expressed in over 400 cancers and its expression level is positively correlated with the degree of drug resistance of cancer cells. Up to now, more than 300 compounds have been identified as potential substrates of P-gp [8].
As a calcium channel blocker, TTD has been shown in both in vitro and in vivo experiments to reverse MDR by reducing the expression of MDR1 mRNA and P-gp, increasing intracellular drug concentration and enhancing the toxic effect of Adriamycin (ADM) on drug-resistant leukemia cells [9-12].
However, the effect of administration of TTD one week before chemotherapy is not ideal in the current clinical trials. In view of the previous in vitro and animal experiments have confirmed the effect of TTD in reversing the drug resistance of leukemia, we consider whether the drug delivery method in our clinical trials is responsible for the poor efficacy. This study returned to the cell experiment, selected K562 and K562/ADM cell lines as the research object, through different ADM combined with TTD administration sequences, to detect the inhibitory effect of different administration sequences on cell proliferation and whether it affected the intracellular ADM concentration, P-gp ATPase activity, MDR1 mRNA and P-gp expression levels, comparing the effect of TTD combined with ADM different administration sequences on the reversal of MDR in K562/ADM cells, provides a theoretical basis for the clinical formulation of a reasonable administration sequence.
Materials and Methods
I Materials
The drug-sensitive human chronic myeloid leukemia cell line K562 was kept by our laboratory, and its drug-resistant variant K562/ADM (ADM-resistant K562 cells) was obtained from the Institute of Hematology of Chinese Academy of Medical Sciences (Tianjin, China). ADM standards were purchased from APExBIO (USA). CCK-8 kit (Cell Counting Kit) was purchased from Vazyme Biotech Co., Ltd. (Nanjing, China). TTD was purchased from Pharmaceutical Factory (Jinhua, Zhejiang). Dithiothreitol, egtazic acid, anthocyanin, MgATP and Trizol were purchased from Sigma (USA). Rabbit anti-human P-gp was purchased from ABclonal Biotechnology Co., Ltd. Western blot primary antibody dilution, RIPA lysate and 5X SDS-PAGE protein loading buffer were purchased from Biyuntian Biotechnology Company (Jiangsu, China). Oligo dT and primers were purchased from Shanghai Shenggong Co., Ltd. SYBR Master Mixture was purchased from QIAGEN company (USA). M-MLV, dNTPs and Rnase Inhibitor were purchased from Promega company. qPCR Primer Set was purchased from Guangzhou Ruibo Company. Primer (R&F) was purchased from Shanghai Jikai Company. F-4600 Fluorescence spectrophotometer is the Hitachi brand.
The horizontal electrophoresis tank is the product of Beijing Liuyi Scientific Instrument Factory. The vertical electrophoresis tank is the product of BIO-RAD (USA).The semi-dry transfer tank is the product of Pharmacia Biotech. Multifunctional fluorescence quantitative microplate reader is the product of Bio-TEK company (USA). The real-time fluorescence quantitative PCR instrument is the product of Agilent, and the RNA/DNA quantifier is the product of Pharmacia Biotech Gene Quant II.
II Reagent and Solution Preparation
ADM solution was prepared in ultra-pure water with a concentration of 200 µg/mL, protected from light and stored at −20 °C for later use. TTD was dissolved in DMSO in a concentration of 3 mmol/L and stored as stock. Cell lysates (0.3 mol/L HCl: 50% Ethanol 1: 1) was used as previously reported. Pyrolysis liquid (Tris-HCl (10 mmol/L, pH7.8), KCl (10 mmol/L), MgCl2 (2 mmol/L), Dithiothreitol (1 mmol/L), egtazic acid (1 mmol/L)) was used for detecting ATPase activity. Reagent for Phosphate determination (3 mol/L sulphuric acid: 2.5% ammonium molybdate: 10% ascorbic acid: water=1:1:1:2) was stored in a refrigerator at 4°C.
III Cell Culture
K562 cells were cultured in RPMI 1640 medium containing 10% FBS, and K562/ADM cells were cultured in 37°C, 5% CO2 incubator with RMPI 1640 medium containing 10% FBS and ADM final concentration of 1 μg/mL. Change the fluid once a day and passaged every 2-3 days.
IV The Sensitivity of Cells to Drugs was Observed by CCK-8 Method
ADM, TTD, or a combination of ADM and TTD were added to the cells in the logarithmic growth phase. The maximum concentration of ADM was l0 μg/mL for K562 cells and 100 μg/mL for K562/ADM cells. The cells were diluted with different concentrations with 3 multiple pores for each concentration. The untreated cells were used as the control group and inoculated in a 96-well plate, and each well contains 200μL of 1x10⁵ cell suspension. The cells were incubated at 37°C in an incubator with 5% CO2 for 48 h and centrifuged at 2500 rpm for 5min in a flat plate centrifuge, discarded the supernatant. Cell culture medium containing 10% FBS RPMI1640: CCK-8 solution 10:1 was used to prepare the reaction solution. 100 μL reaction solution was added to each well. The cell culture was continued at 37 °C in an incubator containing 5% CO2 for 3h and then removed, determining the absorbance at the wavelength of 490 nm on a microplate reader (OD490).
Calculation of the growth inhibition rate of cells: growth inhibition rate (%) = [(control hole absorbance - experiment hole absorbance)/(control hole absorbance - blank hole absorbance)]× 100%. IC50 was calculated by GraphPad Prism 8 according to the growth inhibition rate.
Reversal ratio = IC50 of resistant strain/IC50 after addition of the reversal agent. The experiment was repeated 3 times, 3 multiple holes were set for each time, and the average value was taken as the final result.
V Fluorescence Spectrophotometer Determine ADM Concentration
Take the ADM reserve solution and prepare a series of ADM standard solutions (10, 5, 2.5, 0.5, and 0.05 μg/mL). In the quantitative analysis mode, set the excitation wavelength λex = 469 nm and the emission wavelength λem = 593 nm. Measure the fluorescence intensity of these series of concentrations separately, make a linear relationship curve between concentration and fluorescence intensity, and get the linear equation and linear coefficient. The cells in the logarithmic growth phase were inoculated into a 12-well plate, the number of cells in each well was 1x10⁵/mL, and drugs were added in groups. The ADM concentrations were 10 and 20 μg/mL, respectively. Cells of each group were placed in a 37°C, 5% CO2 incubator for the corresponding time, washed with PBS for 3 times, centrifuged, counted, and resuspended with precooled 0.3mol /L HCl:50% ethanol (1:1) 1 mL. Overnight at 20 °C. The supernatant was collected by centrifugation, and the fluorescence value at excitation wavelength λex = 469 nm and emission wavelength λem = 593 nm was measured with a fluorescence spectrophotometer, and the fluorescence value was substituted into the linear equation to obtain the intracellular ADM concentration.
VI ATPase Activity Experiment
After incubating the cells in different groups for a corresponding period of time, extract the protein as following steps: centrifuge at 1000rpm, 5min, at 4°C, add lysis buffer at the ratio of 2×10⁷ cells to 1mL lysis buffer, swelling at 4°C for 20 min, and broken the cells by ultrasonic waves (ice bath, power 200W, ultrasonic 3s/ time, interval 10s, repeat for 30 times). Centrifuge at 100000rpm for 1h, take precipitation, add lysis buffer containing 0.25mmol/L sucrose, and set aside [13, 14]. The standard curve of fetal bovine serum protein was drawn using bovine serum protein as the standard, the protein concentration was measured by the Bradford method, and the standard curve of phosphorus was drawn [13, 14]. Collected the extracted protein 20μg and put it into culture medium (the effect of Strophanthin G, egtazic acid and sodium azide is to clear the activity of Na+-K+ -ATPase, Ca2+-ATPase, and Mitochondrial ATPase, respectively), MgATP was added to start the reaction, followed by the fixed-phosphorus reagent. After 30min, OD value was measured at 660nm, and a blank group without protein was used as a control group to remove the influence of MgATP [15].
VII MDR1 mRNA Levels were Measured by qPCR
PCR primer sequences are given in (Table 1). Cells of each group were cultured for the corresponding time at 37°C in a 5% CO2 incubator. Then RNA was extracted with TRIzol reagent, and cDNA was obtained by reverse transcription. PCR conditions were as described in (Table 2).
Table 1: PCR primer sequence.
|
Primer |
Sequence (5‘-3‘) |
Amplified fragment size |
|
|
MDR1 |
upstream: |
TGGTTTGATGTGCACGATGTTGGG |
436bp |
|
downstream: |
AGATCAGCAGGAAAGCAGCACCTA |
||
|
GAPDH |
upstream: |
TGACTTCAACAGCGACACCCA |
121bp |
|
downstream: |
CACCCTGTTGCTGTAGCCAAA |
Table 2: PCR reaction conditions.
|
Procedure |
Temperature (℃) |
Time |
Cycle (s) |
|
Pre-denaturation |
95 |
30s |
1 |
|
Denaturation |
95 |
5s |
}45 |
|
Annealing |
60 |
30s |
|
|
Dissolution curve analysis |
55-95 |
VIII P-gp Levels were Determined by Western Blots [16]
Total protein was extracted using a protein lysis buffer and quantified using a BCA protein assay kit (Beyotime Co. Ltd., CCK-8). SDS–polyacrylamide gel electrophoresis and immunoblot analyses were performed according to standard protocols. Following the separation of proteins by SDS-PAGE, the proteins were transferred onto PVDF membranes and further incubated with monoclonal antibodies. TBB5 was used as a normalizing loading control. Western blot images were captured with a LI-COR C-Digit scanner and protein band intensities were measured and analysed using the LI-COR Image Studio Digits v3.1 software.
IX Statistical Analysis
Results are presented as mean plus or minus standard deviation (SD). Data analyses were performed with SPSS statistical software (SPSS, Chicago, IL). The differences between groups were analysed by the Student t-test or analysis of variance (one-way ANOVA), and P < 0.05 was considered to be of statistical significance. GraphPad Prism Version 8.0 (GraphPad Software) was used to create a histogram. Western Blot results were performed by using ImageJ software, K562 sensitive cells were used as controls, P-gp /TBB5 gray values were calculated, and three experiments were normalized.
Results
I The Sensitivity of Cells to Drugs was Observed by CCK-8 Method
We first evaluated the effect of ADM on K562 and K562/ADM proliferation. The proliferation of K562 and K562/ADM cells were both inhibited by ADM: different inhibitory effects were shown when cells were treated with different concentrations of ADM for 48 h (P<0.05). The IC50 values were calculated by using GraphPad Prism v8.0 software were (1.06±0.10) and (44.95±5.61) μg/mL, respectively (Figure 1) and the cell inhibition rate increased with ADM concentration. The drug resistance index of K562/ADM cells was 42.41. We then evaluated the effect of TTD on K562 and K562/ADM proliferation. TTD had no cytotoxic effect on K562 cells and K562/ADM cells at lower doses (1.5, 1.0, 0.5 and 0.25 μmol/L), and the inhibition rate was less than 10%. We chose the concentration of 1.0 μmol/L for TTD as a combined dose to reverse cell resistance. The inhibitory rates of different TTD concentrations on K562 and K562/ADM cells are shown in (Table 3).
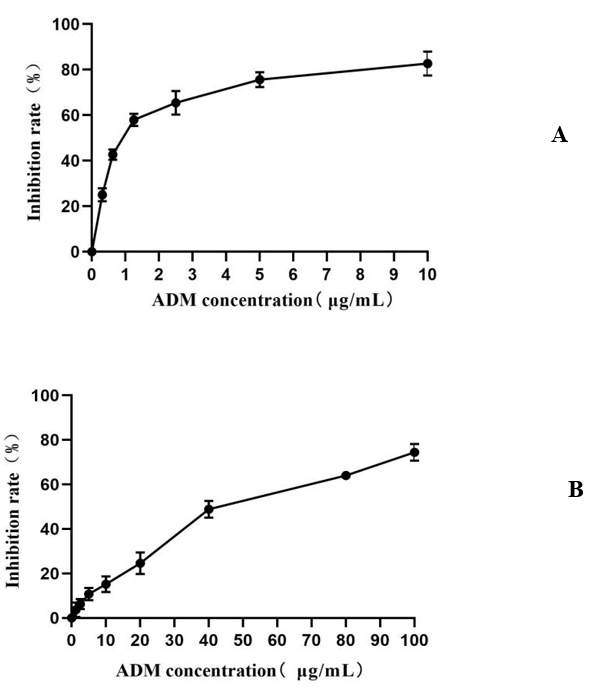
Figure 1: Effects of ADM concentration on proliferation of K562 cells and K562/ADM cells. A) Effects of different ADM concentrations on K562 cell proliferation, B) Effects of different ADM concentrations on K562/ADM cell proliferation. Compared with the blank control group, different ADM concentration groups, P<0.05.
Table 3: Inhibitory rate of different TTD concentrations on K562 and K562/ADM cells(`X±SD).
|
Concentration (μmol/L) |
K562 |
K562/ADM |
|
0.25 |
0.70±0.40 |
0.52±0.32 |
|
0.50 |
1.44±0.62 |
1.20±0.77 |
|
1.00 |
2.68±2.76 |
1.62±1.67 |
|
1.50 |
8.01±4.19 |
3.82±2.55 |
|
2.00 |
23.48±3.25 |
10.25±3.22 |
|
3.00 |
41.73±4.86 |
23.43±2.30 |
Note: Compared with the blank control group, different TTD concentration groups, P<0.05.
There was no significant difference in the effect of the proliferation of K562 cells between the TTD combined with ADM and the ADM group (P>0.05), while the effect on K562/ADM cell proliferation was significantly greater than that of ADM alone group, and the difference was statistically significant (P<0.05). When K562 and K562/ADM cells were treated with 1μmol/L TTD combined with ADM for 48 h, the IC50 values were (0.96±0.06) and (12.06±1.27) μg/mL respectively (Figure 1), and the relative drug resistance index were 0.91 and 11.38. The relative drug resistance index of K562/ADM cells was reduced by 2.73 times compared with ADM alone, as shown in (Figure 2).
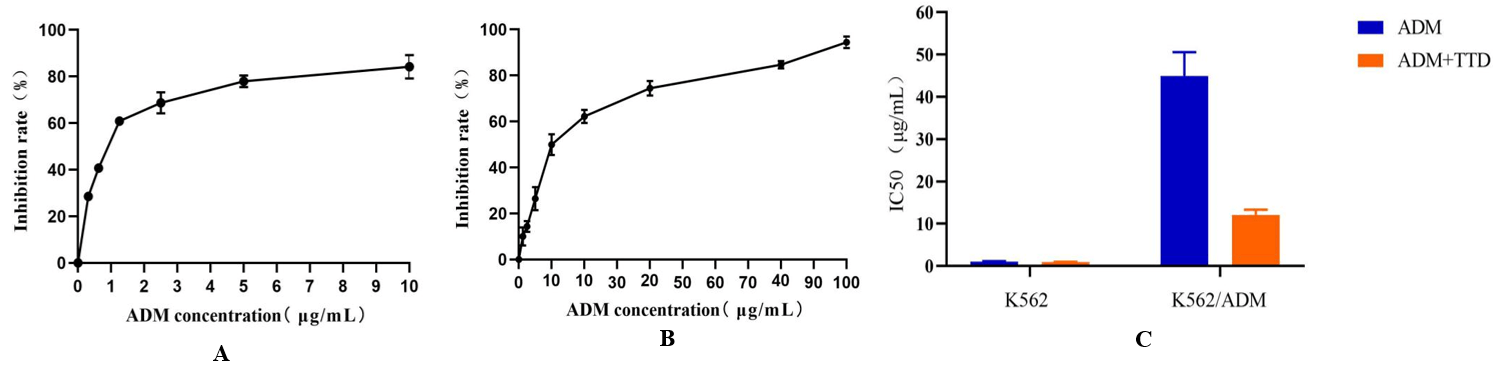
Figure 2: Effects of TTD combined with ADM on proliferation of K562 and K562/ADM cells.
A) Effects of TTD combined with ADM on K562 cell proliferation. Compared with the single-use ADM group, P>0.05. B) Effects of TTD combined with ADM on K562/ADM cell proliferation. Compared with the single-use ADM group, P<0.05. C) Effects of TTD combined with ADM on IC50 of K562 and K562/ADM cells.
II Determination of ADM Concentrati1on Using Fluorescence Spectrophotometer
The standard ADM concentration-fluorescence intensity curve was obtained by preparing a series of ADM solutions with different concentrations and measuring their fluorescence intensities. The linear relationship between ADM concentration and fluorescence intensity was good in the range of 0.05-10 μg/mL. The linear equation was Y= 224.83x + 98.257, R2 = 0.9982.
ADM concentrations were determined to be (1.23±0.06) μg/mL, (1.57±0.02) μg/mL, (0.21±0.04) μg/mL, and (0.29±0.05) μg/mL when 10 and 20 μg/mL ADM were applied to K562 and K562/ADM cells for 2h, respectively, and the intracellular ADM concentration of K562/ADM was 17.07±0.05% and 18.47±0.03% of K562 cells respectively.
Then the TTD and ADM were combined to act on K562/ADM cells in different combined administration methods, and the fluorescence intensity was measured after 48 h later. The results showed that both the TTD and ADM co-administration group and the group in which ADM was added 48 h later than TTD could increase the ADM accumulation in K562/ADM cells, and the effect of the co-administration group was more obvious. The mean ADM concentrations in K562/ADM cells were 59.84± 0.06%, 46.00± 0.05%, 74.41±0.03% and 53.04±0.03% of K562 cells in TTD and ADM co-administration group and the group in which ADM was added 48 h later than TTD. ADM concentration in K562/ADM cells in the group in which ADM was added before TTD showed no significant increase (P>0.05). The results are shown in (Table 4 & Figure 3).
Table 4: Intracellular ADM concentration in K562 and K562/ADM cells under different administration methods of ADM+TTD (`X±SD).
|
Group |
ADM (μg/mL) |
|
|
10 |
20 |
|
|
K562 |
1.23±0.06 |
1.57±0.02 |
|
K562/ADM |
0.21±0.04a |
0.29±0.05a |
|
K562/ADM+AT |
0.73±0.02ab |
1.17±0.03ab |
|
K562/ADM+A+T |
0.28±0.05ac |
0.39±0.03ac |
|
K562/ADM+T+A |
0.56±0.03abc |
0.83±0.05abc |
Note:Group: K562: K562 cells were treated with ADM for 2 h; K562/ADM: K562/ADM cells were treated with ADM for 2 h; K562/ADM+AT: ADM and TTD were simultaneously applied to K562/ADM cells for 48h; K562/ADM+A+T: K562/ADM cells, first added ADM for 48 h, then added TTD for 48 h; K562/ADM+T+A: K562/ADM cells, first added TTD for 48 h, then added ADM for 48 h. Compared with group K562,ap<0.05;Compared with group K562/ADM,bp<0.05;Compared with K562/ADM+AT group in the combination administration group,cp<0.05.

Figure 3: Intracellular ADM concentration in K562 and K562/ADM cells under different administration methods of ADM+TTD.
Group: K562: K562 cells were treated with ADM for 2 h; K562/ADM: K562/ADM cells were treated with ADM for 2 h; K562/ADM+AT: ADM and TTD were simultaneously applied to K562/ADM cells for 48h; K562/ADM+A+T: K562/ADM cells, first added ADM for 48 h, then added TTD for 48 h; K562/ADM+T+A: K562/ADM cells, first added TTD for 48 h, then added ADM for 48 h.
III ATPase Activity Experiment
TTD increases the intracellular accumulation of ADM in K562/ADM cells, indicative for P-gp efflux pump inhibition. Efflux one molecular substrate by P-gp requires hydrolysis one molecular ATP to provide energy. Therefore, the state of P-gp efflux drugs can be evaluated by the hydrolysis rate of ATP. K562 and K562/ADM cells were treated with TTD and ADM for the corresponding time, the OD value at 660nm of each group was determined by ultraviolet spectrophotometer by the inorganic phosphorus release method. The amount of 1 nmol inorganic phosphorus produced by 1mg protein decomposition ATP per min and was specified as a unit of ATPase activity. The ATPase activity in drug resistant K562/ADM cells was higher than that in sensitive K562 cells and could be increased by 20 μg/mL ADM. And the ATPase activity in K562/ADM cells was significantly increased by TTD of 1 μmol/L compared with 20 μg/mL ADM. In the combination group, the increase of the ATPase activity was considerably more pronounced in the TTD and ADM co-administration group compared with the single-ADM group, and there was no significant difference between the group in which ADM was added before TTD and single-ADM group, (P>0.05) shown in (Figure 4).
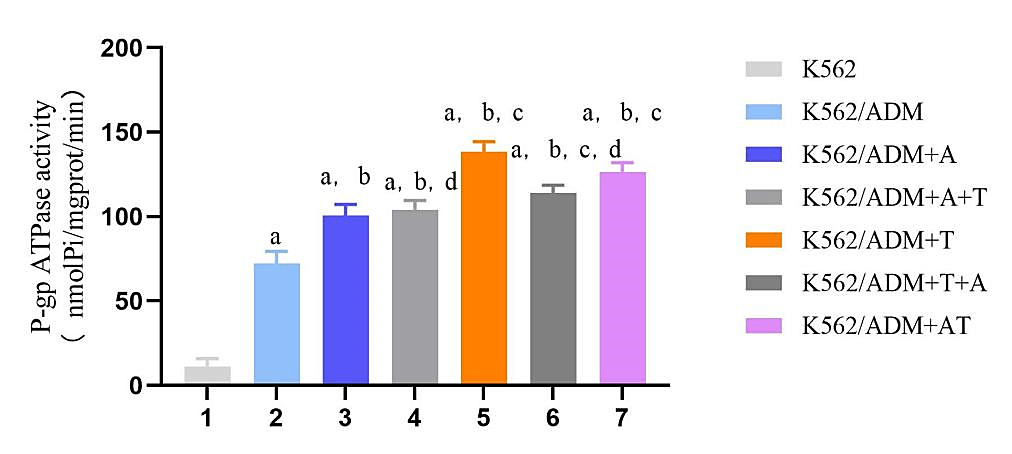
Figure 4: Effects of different administration methods of ADM+TTD on ATPase activity in K562 and K562/ADM cells.
Note:Group: K562: K562 cell control group; K562/ADM: K562/ADM cell control group; K562/ADM+A: K562/ADM cells were treated with ADM for 48h; K562/ADM+A+T: K562/ADM cells, first added ADM for 48 h, then added TTD for 48 h; K562/ADM+T: K562/ADM cells were treated with TTD for 48h; K562/ADM+T+A: K562/ADM cells, first added TTD for 48 h, then added ADM for 48 h; K562/ADM+AT: ADM and TTD were simultaneously applied to K562/ADM cells for 48h. Compared with group K562,ap<0.05;Compared with group K562/ADM,bp<0.05;Compared with group K562/ADM+A,cp<0.05;Compared with K562/ADM+AT group in the combination administration group,dp<0.05.
IV Effects of ADM and TTD on MDR1 mRNA Levels in K562 and K562/ADM Cells
Relative expression levels of target genes were determined by the 2-∆ ∆ Ct method where ∆ Ct= Ct value of target gene - Ct value of internal reference gene, −Δ Δ Ct=mean value of ∆ Ct of the control group- ∆ Ct value of each sample [17]. K562 sensitive cells were used as the control group to calculate the relative expression levels of MDR1 in K562/ADM cells and under different drug administration methods, as shown in (Figure 5).

Figure 5: Effects of different administration methods of ADM+TTD on MDR1 mRNA expression levels in K562 and K562/ADM cells.
Note: Group: K562: K562 cell control group; K562/ADM: K562/ADM cell control group; K562/ADM+A: K562/ADM cells were treated with ADM for 48h; K562/ADM+A+T: K562/ADM cells, first added ADM for 48 h, then added TTD for 48 h; K562/ADM+T: K562/ADM cells were treated with TTD for 48h; K562/ADM+T+A: K562/ADM cells, first added TTD for 48 h, then added ADM for 48 h; K562/ADM+AT: ADM and TTD were simultaneously applied to K562/ADM cells for 48h.Compared with group K562,ap<0.05; Compared with group K562/ADM,bp<0.05; Compared with K562/ADM+AT group in the combination administration group,cp<0.05.
The expression level of MDRl mRNA in K562 cells was significantly lower than that in K562/ADM cells. ADM could increase the expression level of MDR1 mRNA while TTD could significantly reduce the expression level of MDR1 mRNA in K562/ADM cells. In the combination group, the decrease of the expression level of MDR1 mRNA was considerably more pronounced in the TTD and ADM co-administration group compared with the sequential administration group, and the difference was statistically significant, (P<0.05).
V Effects of ADM and TTD on P-gp Levels in K562 and K562/ADM Cells
Western Blot results are shown in (Figure 6). The experiment of WB was repeated three times and the results were normalized and the corrected P-gp /TBB5 gray values were calculated. In normalization, the K562 group P-gp/TBB5 gray value of each experiment is used as the control group, and the gray value ratio is set to 1, the other groups take its gray ratio divided by the K562 group gray ratio as the corrected gray value ratio, and statistical analysis was carried out as in (Figure 7 & Table 5).
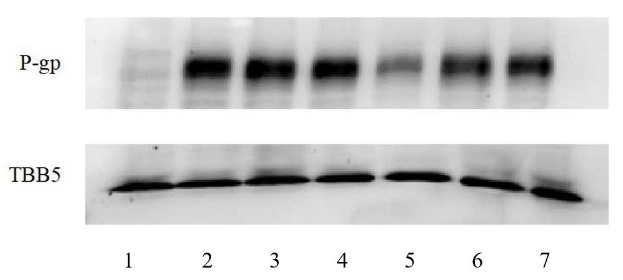
Figure 6: Effects of different administration methods of ADM+TTD on the expression of P-gp in K562 and K562/ADM cells.
1: K562, K562 cell control group; 2: K562/ADM, K562/ADM cell control group; 3: K562/ADM+A, K562/ADM cells were treated with ADM for 48h; 4: K562/ADM+A+T, K562/ADM cells, first added ADM for 48 h, then added TTD for 48 h; 5: K562/ADM+T, K562/ADM cells were treated with TTD for 48h; 6: K562/ADM+T+A, K562/ADM cells, first added TTD for 48 h, then added ADM for 48 h; 7: K562/ADM+AT, ADM and TTD were simultaneously applied to K562/ADM cells for 48h.
Table 5: The adjusted value of P-gp/TBB5 (`X±SD).
|
Group |
1 |
2 |
3 |
4 |
5 |
6 |
7 |
|
P-gp/TBB5 |
1 |
6.03±0.77a |
6.33±0.66a |
5.50±0.28a |
2.96±0.99ab |
5.44±1.54a |
4.29±0.96ab |
Note:Group: 1: K562, K562 cell control group; 2: K562/ADM, K562/ADM cell control group; 3: K562/ADM+A, K562/ADM cells were treated with ADM for 48h; 4: K562/ADM+A+T, K562/ADM cells, first added ADM for 48 h, then added TTD for 48 h; 5:K562/ADM+T, K562/ADM cells were treated with TTD for 48h; 6:K562/ADM+T+A, K562/ADM cells, first added TTD for 48 h, then added ADM for 48 h; 7:K562/ADM+AT, ADM and TTD were simultaneously applied to K562/ADM cells for 48h. Compared with group K562, ap<0.05; Compared with group K562/ADM, bp<0.05.
Western blot results for protein levels supported the mRNA results. P-gp expression level in K562/ADM cells was higher than the K562-control and was 6.03±0.77 times of it. TTD showed some inhibitory effects on P-gp expression in K562/ADM cells, and 1μmol/L TTD can reduce P-gp in K562/ADM cells to 2.96±0.99 times of K562 cells. In the combination group, the expression level of P-gp was decreased in the TTD and ADM co-administration group compared with the single-ADM group, and the sequential administration group had no effect on P-gp expression level in K562/ADM cells, (P>0.05).
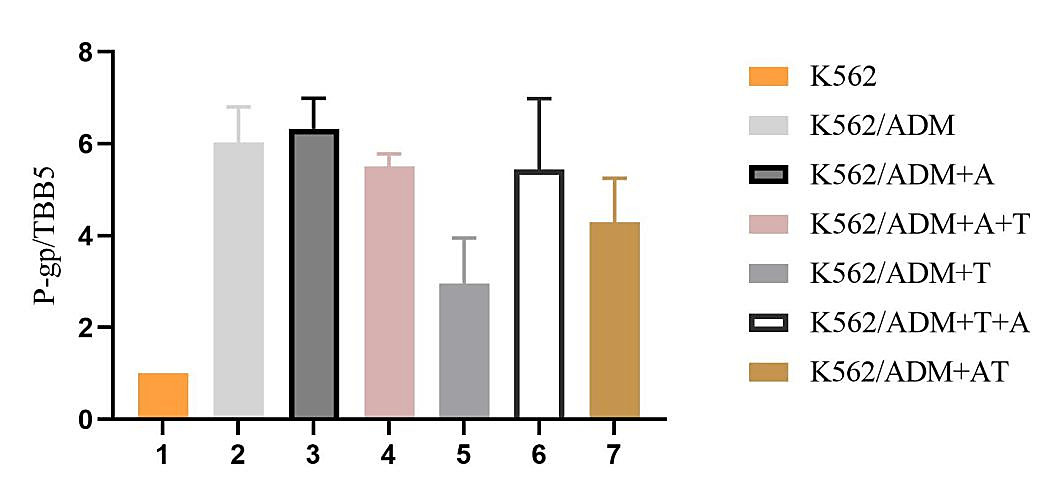
Figure 7: The adjusted value of P-gp/TBB5.
Group: 1: K562, K562 cell control group; 2: K562/ADM, K562/ADM cell control group; 3: K562/ADM+A, K562/ADM cells were treated with ADM for 48h; 4: K562/ADM+A+T, K562/ADM cells, first added ADM for 48 h, then added TTD for 48 h; 5:K562/ADM+T, K562/ADM cells were treated with TTD for 48h; 6:K562/ADM+T+A, K562/ADM cells, first added TTD for 48 h, then added ADM for 48 h; 7:K562/ADM+AT, ADM and TTD were simultaneously applied to K562/ADM cells for 48h.
Discussion
While traditional anti-tumor drugs have been in clinical use for several decades, especially in leukemia, chemotherapy is the most basic treatment scheme. However, due to the development of MDR in cancer cells, the efficacy of chemotherapy drugs is weakened, and it is difficult to achieve the expected effect, and the prognosis of tumor treatment is poor [18]. Increasing drug efflux pumps (P-gp) on the cell membrane due to the overexpression of MDR1 gene in tumor cells is the main mechanism of multidrug resistance of cancer cells. P-gp belongs to the ATP-binding cassette family and functions as a transmembrane efflux pump that translocates chemotherapy drugs from an intracellular to an extracellular domain, thus it is impossible to achieve efficient drug accumulation in tumor cells [19]. More than 300 compounds, including ADM, have been identified as potential substrates for P-gp, and it was found that MDR could be overcome by down-regulating P-gp expression or inhibiting P-gp efflux pump function [20].
Previous studies in our laboratory confirmed that P-gp was highly expressed in drug-resistant AML cells, and a variety of reversing agents including TTD were applied to study the effect of MDR reversal at the cellular and animal levels [11-12, 21, 22]. However, this study did not achieve the expected results after entering into clinical trials. Faced with unsatisfactory clinical trial results, we began to rethink the role of P-gp in MDR and how to deal with it. We believe that at this point, it is preferable to make further study how P-gp-mediated drug outflow leads to reduced drug accumulation in tumor cells and to return to the cellular level to explore how to better reverse P-gp-mediated drug resistance, rather than to continue with more therapeutic clinical trials in AML patients.
We report that TTD has a significant reversal effect on P-gp -mediated MDR. First, we conducted CCK-8 experiments to investigate the proliferation inhibition of ADM and TTD and their combined use on K562 and K562/ADM cells, calculated the IC50 value, evaluated the cytotoxicity of TTD, and found out the non-toxic concentration for reverse study. According to CCK-8 results, 1μmol/L TTD was selected for reversal study. Our data showed that TTD significantly reduced the IC50 value of ADM on K562/ADM cells and significantly reversed the P-gp -mediated MDR. The decrease in IC50 value suggested that the use of TTD increased the intracellular ADM concentration.
In order to know the effect of TTD on P-gp function, we conducted an intracellular drug concentration test. Our results indicate that TTD can significantly increase the intracellular accumulation of ADM in drug-resistant cells, which may be due to the reduction of P-gp expression, or it may affect the function of P-gp-mediated drug efflux. In addition, the data shows that in different modes of administration, the simultaneous use of TTD and ADM can increase the intracellular drug accumulation to a greater extent compared with the sequential administration group, which suggests another possibility that TTD also serves as a substrate for P-gp and its affinity with P-gp is higher than ADM. By competitively binding P-gp with ADM, the efflux of ADM in cells is reduced. In order to verify that TTD reverses the P-gp-mediated MDR through competitive inhibition to increase the accumulation of drugs with lower P-gp affinity substrates, we conducted the ATPase activity experiment.
It is well known that the P-gp transporter pumps the substrate by using the energy generated by the hydrolysis of ATP. We evaluated whether TTD would affect the ATPase activity of P-gp. The results showed that at this experimental concentration, 1 μmol/L TTD can increase the ATPase activity of K562/ADM cells to a greater extent compared with 20 μg/mL ADM, indicating that TTD is more likely to stimulate ATP hydrolysis, and when TTD and ADM are used together, the ATPase activity is close to The ATPase activity of TTD alone. These data combined with intracellular drug concentration test experiments show that TTD may act as a substrate for P-gp through competitive inhibition, and when combined with ADM, the P-gp can preferentially excrete it to increase the intracellular ADM concentration. In the mechanism of TTD reversing drug resistance, competitive inhibition may also play an important role [23]. This also explains why the addition of TTD in clinical trials failed to improve the treatment effect of patients.
In clinical trials, patients were given TTD for one week before chemotherapy, which perfectly withdrew this competitive inhibition. The intracellular ADM concentration detection experiment showed that addition of TTD and ADM sequentially was weaker than TTD and ADM co-administration group in increase intracellular ADM concentration, which also explained the problem.
Since the reverse effect may also be caused by the downregulation of P-gp expression, we then used qPCR and Western blot to investigate these possibilities. Our results show that 1 μmol/L TTD significantly down-regulates the expression of MDR1 mRNA and P-gp levels in K562/ADM cells, which is consistent with previous studies [11, 12]. It is also worth noting that in the different combined administration methods, ADM and TTD co-administration groups had a more significant reduction in the expression of MDR1 mRNA and P-gp levels in K562/ADM cells than the sequential administration group, and the difference was statistically significant. This further suggests that concurrent administration of ADM and TTD can more effectively reverse drug resistance in tumor cells. We, therefore, conclude that the co-administration of TTD, as a drug resistance reversal agent in conjunction with ADM may be a better administration in the clinic.
To sum up, our study shows that TTD can significantly antagonize P-gp-mediated ADM resistance by competitively binding p-gp and down-regulating P-gp expression. However, the role of this competitive inhibition of TTD in other chemotherapeutic drugs needs to be further studied. This effect will not exist when combined with chemotherapeutic drugs that are more likely to bind to P-gp, but this suggests that MDR reversal agents can be found in P-gp high-affinity substrates.
Acknowledgments
This work was supported by the [National Natural Science Foundation of China #1] under Grant [numbers 81170492 and 81370673 ]; [National High Technology Research and Development Program 863 of People’s Republic of China #2] under Grant [number 2012AA022703]; [National Key Basic Research Program 973 of People’s Republic of China #3] under Grant [number 2010CB732404]; [Key Medical Projects of Jiangsu Province #4] under Grant [number BL2014078]; [Key Medical of Jiangsu Province #5] under Grant [number ZDXKB2016020] and [Jiangsu Social Development Project#6] under Grant [number BE2018711].
Conflicts of Interest
None.
Article Info
Article Type
Research ArticlePublication history
Received: Sat 04, Jul 2020Accepted: Mon 20, Jul 2020
Published: Sat 01, Aug 2020
Copyright
© 2023 Baoan Chen. This is an open-access article distributed under the terms of the Creative Commons Attribution License, which permits unrestricted use, distribution, and reproduction in any medium, provided the original author and source are credited. Hosting by Science Repository.DOI: 10.31487/j.COR.2020.08.01
Figures & Tables
Table 1: PCR primer sequence.
|
Primer |
Sequence (5‘-3‘) |
Amplified fragment size |
|
|
MDR1 |
upstream: |
TGGTTTGATGTGCACGATGTTGGG |
436bp |
|
downstream: |
AGATCAGCAGGAAAGCAGCACCTA |
||
|
GAPDH |
upstream: |
TGACTTCAACAGCGACACCCA |
121bp |
|
downstream: |
CACCCTGTTGCTGTAGCCAAA |
Table 2: PCR reaction conditions.
|
Procedure |
Temperature (℃) |
Time |
Cycle (s) |
|
Pre-denaturation |
95 |
30s |
1 |
|
Denaturation |
95 |
5s |
}45 |
|
Annealing |
60 |
30s |
|
|
Dissolution curve analysis |
55-95 |
Table 3: Inhibitory rate of different TTD concentrations on K562 and K562/ADM cells(`X±SD).
|
Concentration (μmol/L) |
K562 |
K562/ADM |
|
0.25 |
0.70±0.40 |
0.52±0.32 |
|
0.50 |
1.44±0.62 |
1.20±0.77 |
|
1.00 |
2.68±2.76 |
1.62±1.67 |
|
1.50 |
8.01±4.19 |
3.82±2.55 |
|
2.00 |
23.48±3.25 |
10.25±3.22 |
|
3.00 |
41.73±4.86 |
23.43±2.30 |
Note: Compared with the blank control group, different TTD concentration groups, P<0.05.
Table 4: Intracellular ADM concentration in K562 and K562/ADM cells under different administration methods of ADM+TTD (`X±SD).
|
Group |
ADM (μg/mL) |
|
|
10 |
20 |
|
|
K562 |
1.23±0.06 |
1.57±0.02 |
|
K562/ADM |
0.21±0.04a |
0.29±0.05a |
|
K562/ADM+AT |
0.73±0.02ab |
1.17±0.03ab |
|
K562/ADM+A+T |
0.28±0.05ac |
0.39±0.03ac |
|
K562/ADM+T+A |
0.56±0.03abc |
0.83±0.05abc |
Note:Group: K562: K562 cells were treated with ADM for 2 h; K562/ADM: K562/ADM cells were treated with ADM for 2 h; K562/ADM+AT: ADM and TTD were simultaneously applied to K562/ADM cells for 48h; K562/ADM+A+T: K562/ADM cells, first added ADM for 48 h, then added TTD for 48 h; K562/ADM+T+A: K562/ADM cells, first added TTD for 48 h, then added ADM for 48 h. Compared with group K562,ap<0.05;Compared with group K562/ADM,bp<0.05;Compared with K562/ADM+AT group in the combination administration group,cp<0.05.
Table 5: The adjusted value of P-gp/TBB5 (`X±SD).
|
Group |
1 |
2 |
3 |
4 |
5 |
6 |
7 |
|
P-gp/TBB5 |
1 |
6.03±0.77a |
6.33±0.66a |
5.50±0.28a |
2.96±0.99ab |
5.44±1.54a |
4.29±0.96ab |
Note:Group: 1: K562, K562 cell control group; 2: K562/ADM, K562/ADM cell control group; 3: K562/ADM+A, K562/ADM cells were treated with ADM for 48h; 4: K562/ADM+A+T, K562/ADM cells, first added ADM for 48 h, then added TTD for 48 h; 5:K562/ADM+T, K562/ADM cells were treated with TTD for 48h; 6:K562/ADM+T+A, K562/ADM cells, first added TTD for 48 h, then added ADM for 48 h; 7:K562/ADM+AT, ADM and TTD were simultaneously applied to K562/ADM cells for 48h. Compared with group K562, ap<0.05; Compared with group K562/ADM, bp<0.05.
A) Effects of TTD combined with ADM on K562 cell proliferation. Compared with the single-use ADM group, P>0.05. B) Effects of TTD combined with ADM on K562/ADM cell proliferation. Compared with the single-use ADM group, P<0.05. C) Effects of TTD combined with ADM on IC50 of K562 and K562/ADM cells.
Group: K562: K562 cells were treated with ADM for 2 h; K562/ADM: K562/ADM cells were treated with ADM for 2 h; K562/ADM+AT: ADM and TTD were simultaneously applied to K562/ADM cells for 48h; K562/ADM+A+T: K562/ADM cells, first added ADM for 48 h, then added TTD for 48 h; K562/ADM+T+A: K562/ADM cells, first added TTD for 48 h, then added ADM for 48 h.
Note:Group: K562: K562 cell control group; K562/ADM: K562/ADM cell control group; K562/ADM+A: K562/ADM cells were treated with ADM for 48h; K562/ADM+A+T: K562/ADM cells, first added ADM for 48 h, then added TTD for 48 h; K562/ADM+T: K562/ADM cells were treated with TTD for 48h; K562/ADM+T+A: K562/ADM cells, first added TTD for 48 h, then added ADM for 48 h; K562/ADM+AT: ADM and TTD were simultaneously applied to K562/ADM cells for 48h. Compared with group K562,ap<0.05;Compared with group K562/ADM,bp<0.05;Compared with group K562/ADM+A,cp<0.05;Compared with K562/ADM+AT group in the combination administration group,dp<0.05.
Note: Group: K562: K562 cell control group; K562/ADM: K562/ADM cell control group; K562/ADM+A: K562/ADM cells were treated with ADM for 48h; K562/ADM+A+T: K562/ADM cells, first added ADM for 48 h, then added TTD for 48 h; K562/ADM+T: K562/ADM cells were treated with TTD for 48h; K562/ADM+T+A: K562/ADM cells, first added TTD for 48 h, then added ADM for 48 h; K562/ADM+AT: ADM and TTD were simultaneously applied to K562/ADM cells for 48h.Compared with group K562,ap<0.05; Compared with group K562/ADM,bp<0.05; Compared with K562/ADM+AT group in the combination administration group,cp<0.05.
1: K562, K562 cell control group; 2: K562/ADM, K562/ADM cell control group; 3: K562/ADM+A, K562/ADM cells were treated with ADM for 48h; 4: K562/ADM+A+T, K562/ADM cells, first added ADM for 48 h, then added TTD for 48 h; 5: K562/ADM+T, K562/ADM cells were treated with TTD for 48h; 6: K562/ADM+T+A, K562/ADM cells, first added TTD for 48 h, then added ADM for 48 h; 7: K562/ADM+AT, ADM and TTD were simultaneously applied to K562/ADM cells for 48h.
Group: 1: K562, K562 cell control group; 2: K562/ADM, K562/ADM cell control group; 3: K562/ADM+A, K562/ADM cells were treated with ADM for 48h; 4: K562/ADM+A+T, K562/ADM cells, first added ADM for 48 h, then added TTD for 48 h; 5:K562/ADM+T, K562/ADM cells were treated with TTD for 48h; 6:K562/ADM+T+A, K562/ADM cells, first added TTD for 48 h, then added ADM for 48 h; 7:K562/ADM+AT, ADM and TTD were simultaneously applied to K562/ADM cells for 48h.
References
- Frederick R Appelbaum, Holly Gundacker, David R Head, Marilyn L Slovak, Cheryl L Willman et al. (2006) Age and acute myeloid leukemia. Blood 107: 3481-3485. [Crossref]
- Gunnar Juliusson, Petar Antunovic, Asa Derolf, Sören Lehmann, Lars Möllgård et al. (2009) Age and acute myeloid leukemia: real world data on decision to treat and outcomes from the Swedish Acute Leukemia Registry. Blood 113: 4179-4187. [Crossref]
- Daniela Damiani, Mario Tiribelli, Donatella Raspadori, Angela Michelutti, Alessandro Gozzetti et al. (2007) The role of MDR-related proteins in the prognosis of adult acute myeloid leukemia (AML) with normal karyotype. Hematol Oncol 25: 38-43. [Crossref]
- Michael M Gottesman, Victor Ling (2006) The molecular basis of multidrug resistance in cancer: the early years of P-glycoprotein research. FEBS Lett 580: 998-1009. [Crossref]
- Z E Sauna, M M Smith, M Müller, K M Kerr, S V Ambudkar (2001) The mechanism of action of multidrug-resistance-linked P-glycoprotein. J Bioenerg Biomembr 33: 481-491. [Crossref]
- S V Ambudkar (1998) Drμg-stimulatable ATPase activity in crude membranes of human MDR1-transfected mammalian cells. Methods Enzymol 292: 504-514. [Crossref]
- M Azzaria, E Schurr, P Gros (1989) Discrete mutations introduced in the predicted nucleotide-binding sites of the mdr1 gene abolish its ability to confer multidrug resistance. Mol Cell Biol 9: 5289-5297. [Crossref]
- Lei Chen, Youyong Li, Huidong Yu, Liling Zhang, Tingjun Hou (2012) Computational models for predicting substrates or inhibitors of P-glycoprotein. Drug Discov Today 17: 343-351. [Crossref]
- Chun Ling Dai, Hui Yu Xiong, Li Fen Tang, Xu Zhang, Yong Ju Liang et al. (2007) Tetrandrine achieved plasma concentrations capable of reversing MDR in vitro and had no apparent effect on doxorubicin pharmacokinetics in mice. Cancer Chemother Pharmacol 60: 741-750. [Crossref]
- Wen Lin Xu, Hui Ling Shen, Zhong Fang Ao, Bao An Chen, Wei Xia et al. (2006) Combination of Tetrandrine as a potential-reversing agent with daunorubicin, etoposide and cytarabine for the treatment of refractory and relapsed acute myelogenous leukemia. Leuk Res 3: 407-413. [Crossref]
- Chen B, Dong Y, Zhang P (2002) Study on the reversal of multidrug resistance of K562/A02 cells by tetrandrine combined with troxifene. Chin J Hematol 12: 43-44.
- Bao An Chen, Juan Du, Chun Xiu Zhang, Jian Cheng, Feng Gao et al. (2005) Using protein chips to study mechanism underlying reversion of drug resistance in leukemia cells in tetrandrine alone or in combination with droloxifene. Zhongguo Shi Yan Xue Ye Xue Za Zhi 13: 999-1003. [Crossref]
- E J Wang, C N Casciano, R P Clement, W W Johnson (2000) Two transport binding sites of P-glycoprotein are unequal yet contingent: initial rate kinetic analysis by ATP hydrolysis demonstrates intersite dependence. Biochim Biophys Acta 1481: 63-74. [Crossref]
- Ling He, Guo Qing Liu (2002) Interaction of multidrug resistance reversal with P-glycoprotein ATPase activity on blood-brain barrier. Acta Pharmacol Sin 23: 423-429. [Crossref]
- Ji B S, He L (2008) Effect of amlodipine derivative CJXI on P-gp ATPase activity in human drug-resistant tumor cells. Chinese Pharmacol Bulletin 24: 1603-1606.
- Zachary Speth, Tanzila Islam, Kasturi Banerjee, Haluk Resat (2017) EGFR signaling pathways are wired differently in normal 184A1L5 human mammary epithelial and MDA-MB-231 breast cancer cells. J Cell Commun Signal 11: 341-356. [Crossref]
- K J Livak, T D Schmittgen (2001) Analysis of relative gene expression data using real-time quantitative PCR and the 2(-Delta Delta C(T)) Method. Methods 25: 402-408. [Crossref]
- Giovanni Luca Beretta, Giuliana Cassinelli, Marzia Pennati, Valentina Zuco, Laura Gatti (2017) Overcoming ABC transporter-mediated multidrug resistance: The dual role of tyrosine kinase inhibitors as multitargeting agents. Eur J Med Chem 142: 271-289. [Crossref]
- Marianne Samir Makboul Issac, Maggie S El Nahid, Marian Youssry Wissa (2014) Is There a Role for MDR1, EPHX1 and Protein Z Gene Variants in Modulation of Warfarin Dosage? A Study on a Cohort of the Egyptian Population. Mol Diagn Ther 18: 73-83. [Crossref]
- Ziyad Binkhathlan, Afsaneh Lavasanifar (2013) P-glycoprotein Inhibition as a Therapeutic Approach for Overcoming Multidrμg Resistance in Cancer: Current Status and Future Perspectives. Curr Cancer Drug Targets 13: 326-346. [Crossref]
- Bao An Chen, Xue Yun Shan, Jian Chen, Guom Hua Xia, Wen Lin Xu et al. (2010) Effects of imatinib and 5-bromotetrandrine on the reversal of multidrug resistance of the K562/A02 cell line. Chin J Cancer 29: 591-595. [Crossref]
- Li Yin, Bao An Chen, Jian Cheng, Jia Hua Ding, Chong Gao et al. (2010) Effect of PDMP, a glucosylceramide synthase inhibitor, on reversion of daunorubicin resistance in human leukemia cell line K562/A02. Zhongguo Shi Yan Xue Ye Xue Za Zhi 18: 79-84. [Crossref]
- Bian Sheng Ji, Ling He (2009) CJX1, an amlodipine derivative, interacts with ATPase of human P-glycoprotein. Cell Biol Int 33: 1073-1078. [Crossref]