Journals
Realistic Murine Model for Streptozotocin-induced Diabetic Peripheral Neuropathy
A B S T R A C T
Diabetic peripheral neuropathy (DPN) is a side effect of diabetes that affects ~4% of the world population. Such a high prevalence mandates appropriate models for studying potential treatments for DPN. This study used a streptozotocin (STZ) induced DPN model in Wistar rats in conjunction with a precise insulin treatment to create a realistic environment for the development and testing of DPN. Four sensory tests: Von Frey force, Von Frey time, Hargreaves method, and digit spread were used to measure neuropathy. Neuropathy was effectively measured with the Hargreaves method, the Von Frey force, and Von Frey time (p < 0.05). Digit spread produced insignificant results.
The study described herein is a realistic model for accurately testing DPN in rats treated with insulin. STZ-induced diabetic rats may be used to successfully model the progression of diabetic neuropathy in individuals treating their condition with insulin. Three methods traditionally only used in studies mimicking the symptoms of neuropathy were also effective in measuring neuropathy resulting from diabetes.
K E Y W O R D S
Diabetes, neuropathy, streptozotocin, STZ, insulin
I N T R O D U C T I O N
According to the 2014 National Diabetes statistics report published by the Center for Disease Control and Prevention (CDC), over 29.1 million Americans, or 9.3% of the population, have diabetes. The CDC estimates that 1.7 million Americans are diagnosed with diabetes each year, and the 2012 prevalence was significantly greater than the estimate for 2010. Diabetes is a leading cause of death in the United States, and “in 2010, diabetes was mentioned as a cause of death in a total of 234,051 certificates” [1].
Along with the adverse health effects of diabetes, there are also numerous complications that occur in diabetic patients, such as: hypertension, hypoglycemia, various cardiovascular diseases, retinopathy, nephropathy and neuropathy. Currently, it is estimated that 60-70% of diabetic patients are currently suffering from some degree of diabetic peripheral neuropathy, or DPN [2]. Patients report experiencing burning, shooting, and stabbing pain; allodynia, paresthesia, hyperesthesia, cramping, tingling, muscle weakness, and serious foot problems such as ulcers, infection and joint or bone pain [2]. With such a widespread occurrence of DPN, researchers have searched for ways to reverse and treat the disease. Many treatments address the symptoms of DPN but are unable to reverse the neuropathy. Analgesics, antidepressants and anticonvulsants have proven useful in reducing pain but fail to address the neuropathy itself [3].
In recent years, diabetes and diabetes-related complications have increased in prevalence, leading to a corresponding increase in diabetes research [1]. Developing a model in laboratory animals for studying peripheral neuropathy after inducing diabetes that allows for lengthened experiment timelines and closer similarity to human models will prove extremely beneficial to subsequent researchers aiming to explore ways in which it may be possible to treat, cure, and prevent diabetes-related complications, such as DPN. While many contemporary studies forego the use of insulin in order to rapidly produce diabetic symptoms in their animals, our results indicate that insulin administration allows the quality of life for neuropathic experimental animals to remain similar to healthy control animals, allowing for greater similarity to a human model [4, 5]. These results are significant because research on effective treatments of DPN will become more thorough and observable for those using this model of streptozotocin (STZ)-induced diabetes.
Materials and Methods
I Animals
Ninety Wistar albino rats, bred from 2 male and 4 female breeding animals, originally acquired from Charles River Laboratory (Wilmington, MA), were used in this study. Of the original 90 rats, 24 died prior to the analysis of the results: 18 were sacrificed after failing to develop diabetes pos¬¬t STZ injection, 1 died from STZ injection,1 was euthanized after reaching a humane intervention point and 4 passed away from diabetic related complications. The remaining 66 animals consisted of 46 males and 20 females. The animals were housed in pairs in large shoebox style cages with food and water ad libitum. The protocol for this study was approved by Brigham Young University’s Institutional Animal Care and Use Committee (IACUC) in accordance with the National Institute of Health Guide for the Care and Use of Laboratory Animals (Guide for the Care) [6]. Upon reaching 3 weeks of age, rats were weaned from their mothers, at which point they were randomly sorted into testing groups. Four separate nerve tests were administered three times a week to each rat. These tests focused on testing the mechanoreceptors, thermoreceptors, and motor function.
II Induction of Diabetes Mellitus
Animals sorted into the diabetes group were induced with diabetes via a weight proportional administration of STZ (Sigma-Aldrich, St Louis, MO), via tail vein injection at 90 days of age. STZ is commonly used to produce diabetic animals for research purposes and does so by causing cell death of pancreatic beta-cells. An injection of STZ will typically induce type 1 diabetes after a single injection [7]. Each animal was administered 65 mg STZ per kilogram of body weight from a solution of 45 mg STZ/ml saline. Prior to STZ injection, a 2.5% lidocaine 2.5% prilocaine mixture was applied topically to the injection site. Non-diabetic control animals were administered the same volume, substituting saline for STZ solution.
III Insulin Administration
After administration of STZ, it has been shown that insulin receptors are more sensitive in rats; therefore, all animals induced with diabetes were given an additional subcutaneous 1 ml injection of 40% glucose to maintain glucose levels within the rat [8]. Beginning two days after induction of diabetes with STZ, animals began to be treated with subcutaneous injections of insulin (Vetsulin 40U).
Insulin was administered according to weight as determined by the insulin curve test described below. Insulin was administered by withdrawing the correct dose of insulin into a syringe attached to a 30-gauge needle. Air bubbles were then removed from the barrel by gently tapping the side of the syringe. The injection was made by grabbing the scruff of the neck to produce an exposed area of excess skin and inserting the needle into the scruff perpendicular to the rat’s body to ensure no intramuscular injection occurred. The plunger was withdrawn slightly to check for the absence of blood. If no blood was present, the insulin was administered. Following injection, the volume of insulin administered was recorded.
IV Insulin Curve Testing
In order to determine proper insulin dosing for the animals, an insulin curve was developed. Three rats were purchased from the Charles River Laboratory and induced with diabetes according to the STZ protocol. After induction, blood glucose levels were assessed every 4 hours for 4 weeks. During the first two weeks, insulin was administered to maintain levels between 250-350 mg/dL. Insulin was initially administered at 0.9U/100g body weight and adjusted at 20% increases or decreases depending on blood glucose readings. If a rat was determined to be hypoglycemic (< 40 mg/dL), 1cc of glucose was administered IP and the next insulin dose was reduced by 20%. After the curve was proven to successfully regulate blood glucose levels in the three animals for one week, the curve was considered ready for use on the actual experimental group. The curve was then used as the guideline to maintain blood glucose levels of the diabetic group between 250-350 mg/dL. Table 1 reports the insulin dosage according to weight that was developed and used for the extent of the study.
Table 1: Insulin Therapy Guide
|
Rat Weight |
100-174g |
175-249g |
250-349g |
350-424g |
425-499g |
500-574g |
575g+ |
|
Insulin |
0.5U |
1U |
1.5U |
2U |
2.5U |
3U |
3.5U |
V Blood Glucose Testing
Blood samples were assessed daily by drawing blood from the lateral tail vein. Animals were placed in a restraint device. The tips of the rat’s tails were cleansed twice with 70% alcohol and allowed to air dry, thus preventing infection at the tail nick site and contamination of the blood sample. Blood was drawn by removing the existing scab at the tail nick site with forceps. Sterilization of the tail nick site with alcohol wipes was performed before every blood drawing. Two drops of blood were obtained from the tail nick site; the first was removed with gauze and discarded, and the second was collected on a testing strip and read by a ReliOn Prime glucometer. The resulting blood glucose level (BGL in mg/dL) was recorded. If the strip was misread or the glucometer produced an unexpected value, the test was repeated.
VI Hargreaves method
To assess thermoreceptor sensitivity, an IR beam was applied to the left hind paw using the Ugo Basile Thermal Plantar apparatus [9]. The beam intensity was calibrated to cause withdrawal of the limb in healthy rats at 10 seconds and had a cut-off point at 20 seconds to avoid tissue damage in case the paw was not removed. Six rats were placed on a clean, dry glass platform within individual enclosures and allowed to acclimate. Starting with the rat in the first enclosure, the IR beam was placed directly beneath the mid-plantar surface of the hind paw. The rat removed the paw in response to the perception of applied heat. The full cycle was repeated 3 times per test to provide 3 measurements per rat. Each rat underwent this test 3 times a week: either MWF or TThSa. If the glass became soiled with urine or dirtied with dust, the glass was cleaned before nerve testing could occur, as curvature from the drops of urine would split the IR beam and not provide the desired effect. Measurements were recorded manually. To standardize these measurements, one member of each team was trained and was the one performing this nerve test each time that team was working in the lab.
VII Von Frey Force and Von Frey Time
The mechanical withdrawal threshold of the rats was assessed using the Ugo Basile dynamic plantar aesthesiometer to evaluate mechanoreceptor sensitivity. The dynamic plantar aesthesiometer is automatic and was calibrated to incrementally apply up to 50 g of force in 0.5 g steps over 10 seconds. A cutoff of 50 g of force was set as a humane endpoint after which no additional force would be applied. On each day of testing, up to six rats were placed on a mesh platform within individual enclosures and allowed to acclimate. The device’s filament was placed directly beneath the mid-plantar surface of the left hind paw. Mechanical withdrawal threshold was measured by the force applied by the aesthesiometer filament at the time of limb withdrawal. The full cycle was repeated 3 times per test to provide 3 measurements per rat. Each rat underwent this test 3 times a week: either MWF or TThSa. Two measurements were obtained from this test: Von Frey force and Von Frey time.
VIII Digit Spread
Progression of peripheral neuropathy can be examined by the pressure applied when walking on the hind paws [10]. Distribution of pressure can be viewed in the spread of the digits. Ink was evenly applied to the left hind paw of the rat, and the rat was then encouraged to walk across a piece of paper. This test was performed three times a week for each animal. Spread of the left hind digits was measured using a micrometer. Distance between intermediate digital pads 2 and 4 from the right side of each pad was measured, as well as long digital spread between pads 1 and 5. A decrease in distance between digital pads implies an increased sensitivity to pressure applied when walking, indicating neuropathy. Differences in digital spread due to gender and age were included in the analysis.
IX Pain and Distress Scoring
Each animal was monitored for pain and distress as appropriate for the condition, procedure, and degree of invasiveness [11]. A system of pain and distress scoring that included a small number of easily assessed indices (see Table 2 below), so as to control for possible researcher variation in subjective assessment of animal distress was developed and used in daily health assessments of animal subjects to minimize animal suffering.
Table 2: Pain & Distress Scoring
|
Body Weight 0 Normal 1 < 10% weight loss 2 10 - 15 % weight loss, eating 3 > 20% weight loss, not eating |
|
Appearance 0 Normal 1 Lack of grooming 2 Coat rough, possible nasal or ocular discharge 3 Coat very rough, abnormal posture, eyes sunken and glazed |
|
Clinical Signs 0 Normal 1 Diarrhea, constipation 2 Respiratory rates altered, respiratory depth altered, skin tents 3 Cyanotic extremities, labored breathing |
|
Unprovoked Behavior 0 Normal 1 Minor changes 2 Abnormal behavior, less mobile, less alert, inactive when activity expected 3 Paralysis, inability to remain upright, shivering, convulsion |
The overall score was tabulated and used to help assess the status of each animal. A total score of 3 or less was considered normal. A total score of 4-6 indicated some evidence of pain or discomfort. A total score of 7-9 suggested ample evidence of suffering with some type of amelioration indicated. A total score of 10-12 was evidence of severe pain. Appropriate action was taken after consultation and recommendation from the University Veterinarian. Any single score of 3 (severe) for an independent variable automatically placed the animal in the 7-9 category. In accordance with the protocol approved by Brigham Young University’s IACUC, a total score of six or higher, or any single score of 3 was reported to the University veterinarian and BYU’s IACUC. The veterinarian then initiated appropriate therapeutic measures including medication and dietary supplementation. Any animal that consistently displayed severe signs of stress and pain, lost more than 20% of their healthy body weight, or presented with a severe infection around the treatment site was euthanized according to approved IACUC protocol.
X Statistical Analysis
The statistical analysis was taken from averages of all of the values recorded for each rat, in order to treat each rat as an individual in the data set. The Interquartile Range Rule (IQR) was used to eliminate any extreme outliers in the distribution for each data set, and small data sets were examined as if they had a normal distribution. After application of the IQR Rule, one outlier was identified among the male non-diabetic rats. Two-Sample t-tests were used to compare any pair of data mentioned in the “Results” section, and this was done with the assumption that the population standard deviations were not equal between the two data sets. The two-sample t-tests were used under the assumption that every rat recording (post-induction) was treated as an individual. The p-values from these one-sided t-tests are reported in parentheses. This method was used to give a comparison of the average value statistics of all of the diabetic rats compared to the non-diabetic ones.
Figures 1 and 2 display comparisons between the diabetic and non-diabetic rat measurements on a weekly basis. These comparisons were used to find out whether specific weeks were statistically different from their variable counterpart (diabetic compared to non-diabetic). Asterisks identify the specific weeks where the diabetic group measurements were statistically different from the non-diabetic group. Each measurement was used as an individual in one-way ANOVA tests. A “pseudo” Bonferroni correction method was used to reduce the risk of type I errors. This pseudo Bonferroni correction method was used to compare the groups on a weekly basis (weeks 12-29) and determine statistical significance. Weeks 6-11 were not tested for significance because they were pre-STZ induction. They were however included in the graphs for control comparison purposes. The Bonferroni test gets too conservative with many multiple comparisons, so we used a pseudo Bonferroni comparison with an alpha = 0.005 to show presumed significance and an alpha = 0.001 to show confirmed significance. The 0.005 significance level was used as a comparison in compensation of the excessive conservative nature of the Bonferroni test, and the 0.001 level was tested as a more extreme comparison for reference sake.
Table 3: Timeline
|
Nerve assays began |
21 days |
|
Diabetes was induced |
90 days |
|
Insulin treatment began |
91 days |
|
Nerve assays ended |
203 days |
XI Timeline
As described in the previous sections, the Hargreaves method, the Von Frey test and Digit Spread were conducted three times a week. These three tests constitute Nerve Assays in the timeline shown in Table 3.
Results
I Female rat data
Figure 1A shows the mean total pain and distress scoring for female rats at each week. There was a little more variation than the male rat groups, but overall the female diabetic and non-diabetic rats had minimal pain or distress during the experiment, except for a slight rise in diabetic rats following the induction of STZ at week 12. Figure 1B shows the rat groups mean and standard error of the mean for BGL (in mg/dL) for each week through the study. A noticeable statistical difference was seen between diabetic and non-diabetic rats, which should be expected from the induction of STZ. Figure 1C shows mean and standard error of the mean of the average rat weight (in grams). The rat weights were appropriately increasing with age and showed no severe weight fluctuations.
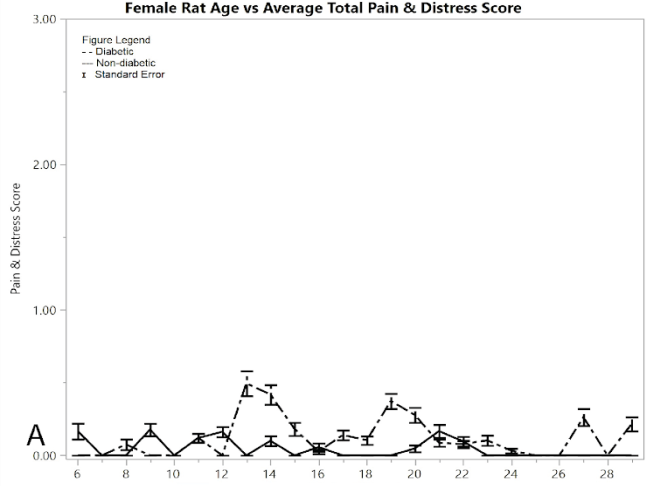
Figure 1: Results for female rats comparing diabetic and non-diabetic groups vs. rat age: A) average total pain and distress scores

Figure 1: B) average blood glucose levels
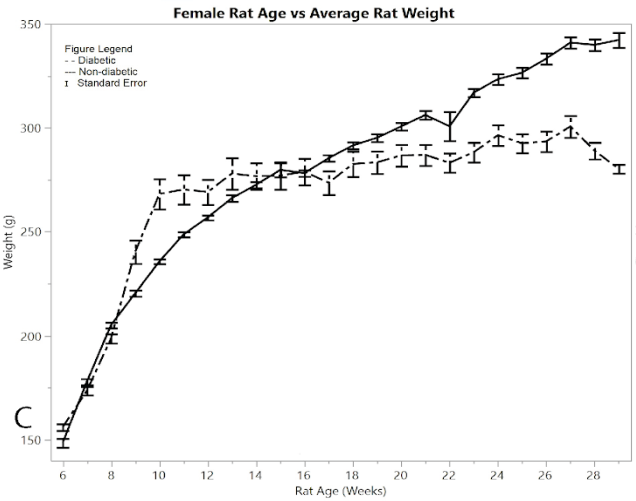
Figure 1: C) average rat weights
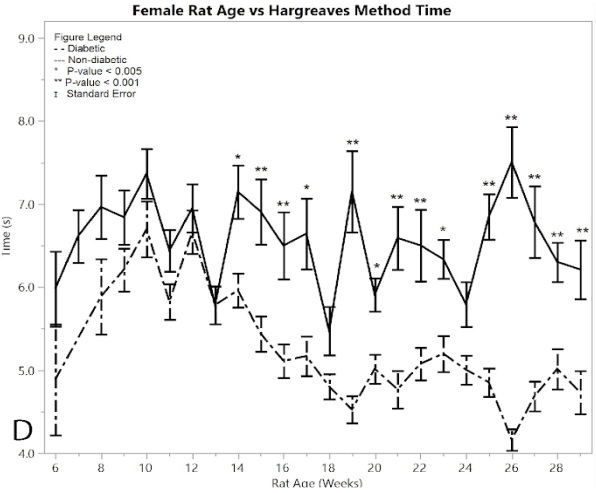
Figure 1: D) average reaction times to the Hargeaves method
Starting immediately from the point of induction, the Hargreaves method time results showed a significant difference between the female post-induction diabetic rats and the female non-diabetic control rats at almost every single time point (p < 0.001) (Figure 1D). This hypersensitivity beginning at week 15, indicates the successful development of neuropathy in the post-induction diabetic rats. The average of the post-induction diabetic female rats was 5.038 ± 0.049 seconds, and the average of the non-diabetic female rats was 6.539 ± 0.084 seconds, giving a practically significant difference of 1.501 ± 0.097 seconds. There were fourteen weeks that had statistically different response times between the diabetic and non-diabetic groups using the one-way ANOVA test, including weeks (p-value): 14 (p = 0.0015), 15 (p = 0.0006), 16 (p = 0.0009), 17 (p = 0.0015), 19 (p = 0.0001), 20 (p =0.0046), 21 (p = 0.0001), 22 (p = 0.0008), 23 (p = 0.0021), 25 (p = 0.0001), 26 (p = 0.0001), 27 (p = 0.0001), 28 (p = 0.0007), 29 (p = 0.0008). See Supplementary Material for all ANOVA results
Testing the average Von Frey time between the post-induction diabetic group and the non-diabetic control group proved that the post-induction diabetic rats had a faster Von Frey time than the non-diabetic control (p = 0.001) (Figure 1E). The average Von Frey time of the female diabetic rats was 3.477 ± 0.054 seconds, and the average Von Frey time of the female non-diabetic rats was 4.015 ± 0.062 seconds, giving a mean difference of 0.537 ± 0.082 seconds. There were three weeks that had statistically different rat response times between the diabetic and non-diabetic groups according to the one-way ANOVA analysis, including weeks (p-value): 21 (p = 0.0018), 26 (p = 0.0032), 27 (p = 0.0006).

Figure 1: E) average reaction times to the Von Frey apparatus
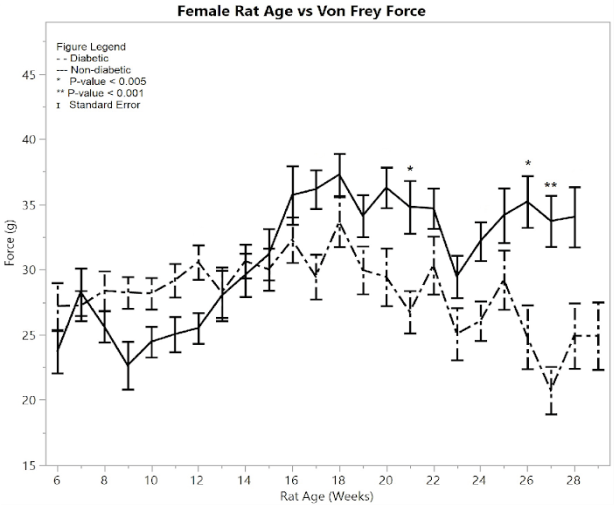
Figure 1: F) average reaction forces to the Von Frey apparatus
Testing the average Von Frey force between the post-induction diabetic group and the non-diabetic control group gave the conclusion that the post-induction diabetic group’s force average was significantly less than the non-diabetic control group (p = 0.001) (Figure 1F). The average Von Frey force of the post-induction diabetic rats was 29.04 ± 0.453 g, and the average Von Frey force of the non-diabetic control rats was 32.793 ± 0.452 g, so the mean difference was 3.753 ± 0.64 g. There were three weeks that had statistically different rat response times between the diabetic and non-diabetic groups according to the one-way ANOVA analysis, including weeks (p-value): 21 (p = 0.0029), 26 (p = 0.0029), 27 (p = 0.0005).
Unlike the female results from the Hargreaves method and the males’ Hargreaves and Von Frey results, female Von Frey results did not show large amounts of significance until week 27. Lesser amounts of significance occur at weeks 21 and 26. This variation is attributed to the smaller size of the female diabetic group compared to the male diabetic group. Overall, the graphs still show significance between diabetic and non-diabetic females.
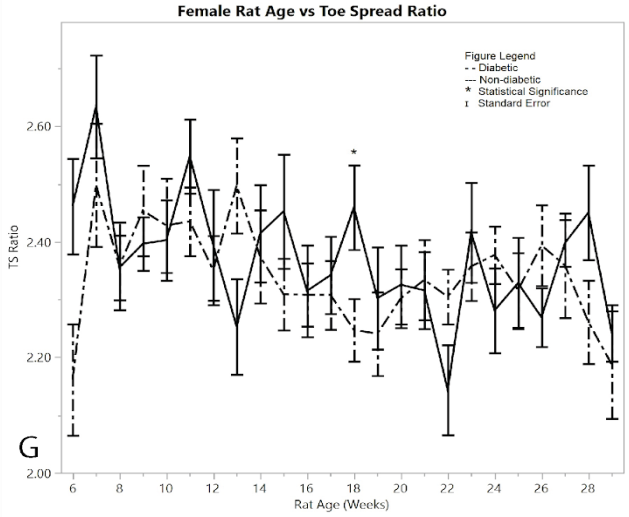
Figure 1: G) average toe spread ratios
As a measurement of their ability to control the spread of their toes, the mean digit spread ratios for females did not show significance between the diabetic and non-diabetic results (Figure 1G). Although there was no significance between the two groups, there was a noticeable change in the controls exhibited by the post-induction diabetic group immediately following induction, but this week (week 6) was excluded because of the pseudo Bonferroni correction method. Week 18 was statistically significant, since its p-value was less than 0.005, so it is the only statistically different week among the female toe spread ratio results.
II Male Rat Data
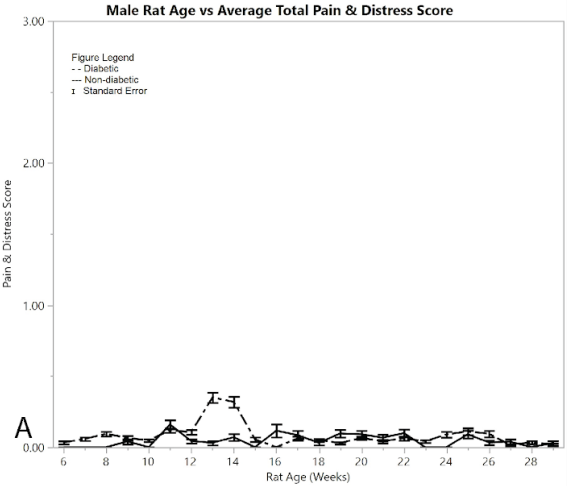
Figure 2: Results for male rats comparing diabetic and non-diabetic groups vs. rat age: A) average total pain and distress scores
Figure 2A shows average pain and distress scoring of the male rats. As can be seen from the figure, both diabetic and non-diabetic rats had minimal pain or distress during the experiment, except for the slight rise in diabetic rats following induction of STZ at week 12. Figure 2B shows mean and standard error of the mean for BGL (in mg/dl), per week of the study. The male group had an almost exact reflection of the female group in terms of BGL, thus supporting that the STZ was administered in the same way. Figure 2C shows means and standard error of the means of the weight (in grams), showing that non-diabetic rats gained significantly more weight than the diabetic group, but at a consistent non-fluctuating rate. The diabetic rats had a consistent weight of around 445 grams after week 12.
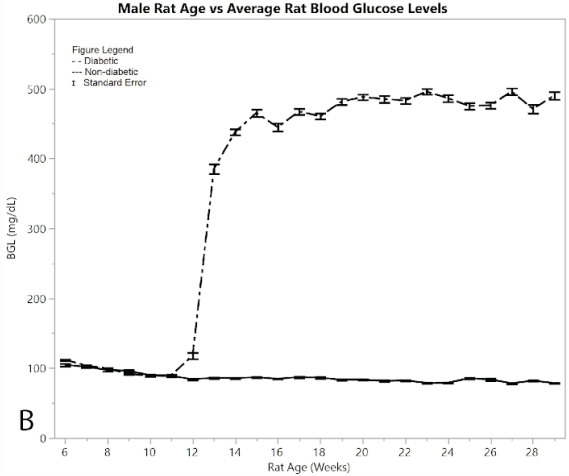
Figure 2:B) average blood glucose levels
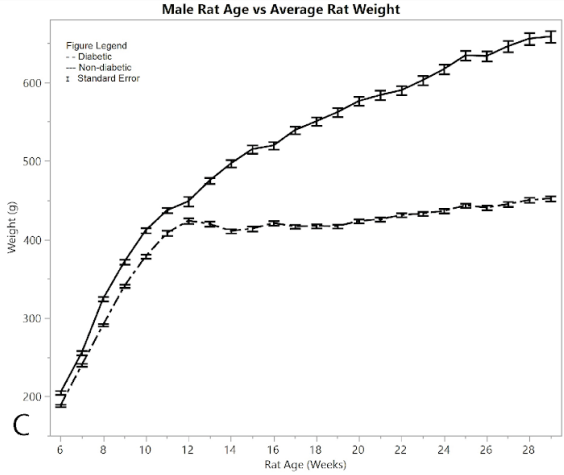
Figure 2:C) average rat weights
The Hargreaves method was conducted on both diabetic and non-diabetic male rats to measure response time for both pre- and post-induction (Figure 2D). Starting at 14 weeks of age the diabetic rats began to show a statistically significant hypersensitivity compared to the non-diabetics. This response time seen in the post induction group continued to increase, giving an overall average of 5.238 ± 0.033 seconds, while the non-diabetic control group showed an average response time of 5.831 ± 0.063 seconds, giving an average difference of 0.594 ± 0.071 seconds. The post induction response time of the diabetic group showed an increased hypersensitivity to the heat of the Hargreaves method, compared to the non-diabetic group (p < 0.001), thus confirming the development of neuropathy in the rats. There were nine weeks where the ANOVA analysis had significantly different results between the diabetic and non-diabetic rats, including weeks (p-value): 14 (p < 0.0001), 15 (p = 0.001), 16 (p < 0.0001), 17 (0.0006), 19 (p < 0.0001), 20 (p = 0.0003), 22 (p=0.0049), 25 (p = 0.0003), 29 (p = 0.0029). See Supplementary Material for full ANOVA results.
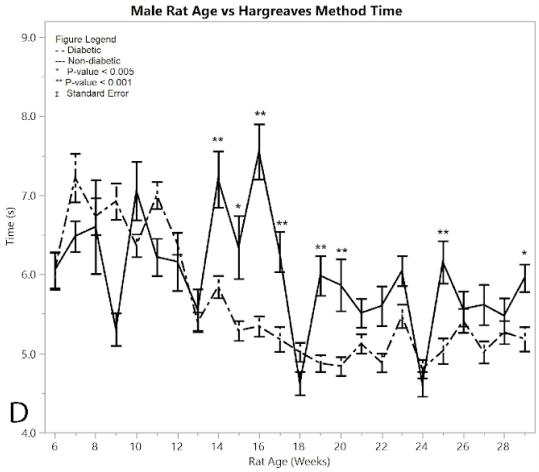
Figure 2:D) average reaction times to the Hargeaves method
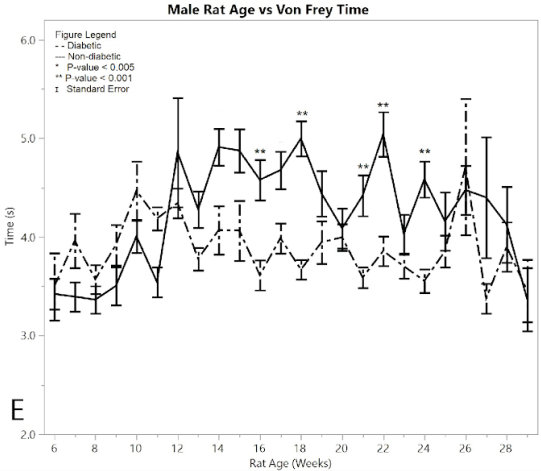
Figure 2:E) average reaction times to the Von Frey apparatus
In a similar fashion, non-diabetic rats and pre-induction male diabetic rats exhibited similar Von Frey times to applied force over time, with the measured response time indicating the point when the foot was withdrawn from the Von-Frey filament (Figure 2E). Non-diabetic rats became less responsive to pressure over time, while diabetic post-induction rats withdrew their foot at a constant time, indicating hypersensitivity in the diabetic group relative to the non-diabetic control group (p < 0.001). This significant difference became evident after 16 weeks of age. The average Von Frey time of the post-induction male diabetic rats was 3.891 ± 0.050 seconds, and the average Von Frey time of the non-diabetic male rats was 4.582 ± 0.087 seconds, giving a mean difference of 0.691 ± 0.100 seconds. There were five weeks where the ANOVA analysis indicated statistically significant differences between the diabetic and non-diabetic rats, with no weeks excluded due to the pseudo Bonferroni correction method. These included weeks (p-value): 16 (p = 0.0003), 18 (p = 0.0001), 21 (p = 0.0002), 22 (p = 0.0003), 24 (p = 0.0002).
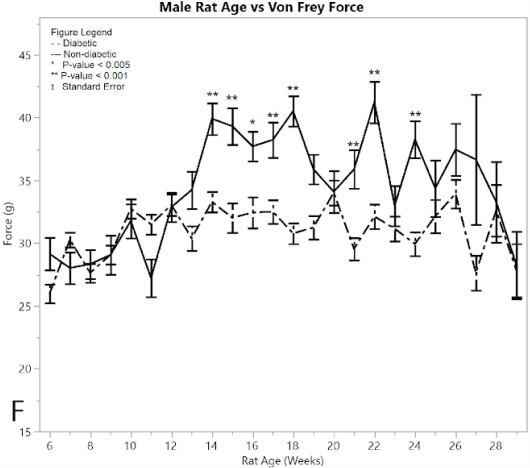
Figure 2:F) average reaction forces to the Von Frey apparatus
Both non-diabetic and pre-induction diabetic male rats showed a similar response to applied pressure with the Von-Frey apparatus, withdrawing their foot after sensing pain (Figure 2F). Control non-diabetic rats became less responsive to pressure over time, while diabetic post-induction rats withdrew their foot at a constant applied force, indicating hypersensitivity in the male diabetic group relative to the male non-diabetic control group (p < 0.001). This significant difference became evident after week 16. The average force for the post-induction male diabetic rats was 31.697 ± 0.248 g, and the average force recorded for the male non-diabetic control was 36.515 ± 0.388 g, giving a difference of 4.817 ± 0.461 g. There were nine weeks that the ANOVA analysis showed as significantly different between diabetic and non-diabetic rats, including weeks (p-value): 14 (p < 0.0001), 15 (p = 0.0002), 16 (p = 0.0026), 17 (p = 0.0008), 18 (p < 0.0001), 19 (p=0.0049), 21 (p = 0.0004), 22 (p < 0.0001), 24 (p = 0.0002).
Recorded data of measured digit spread lengths showed no significant difference between the pre/post induced groups and the non-diabetic group in males (Figure 2G), reinforced by the pseudo Bonferroni method. The two-sample t-test between diabetic and non-diabetic showed that the diabetic rats had a larger toe-spread than non-diabetic rats (p < 0.001). The average toe-spread ratio for male diabetics was 2.250 ± 0.010, while the non-diabetic rats were 2.194 ± 0.013, meaning the difference between the two was 0.057 ± 0.016 (an incredibly small difference). However, this t-test was rendered invalid since there was only one week that the ANOVA analysis showed significant differences between diabetic and non-diabetic rats, and that week was excluded by the Bonferroni correction method. This suggested that the diabetic rats obtained no sciatic nerve damage by means of induction of diabetes (Varejão et al., 2001).
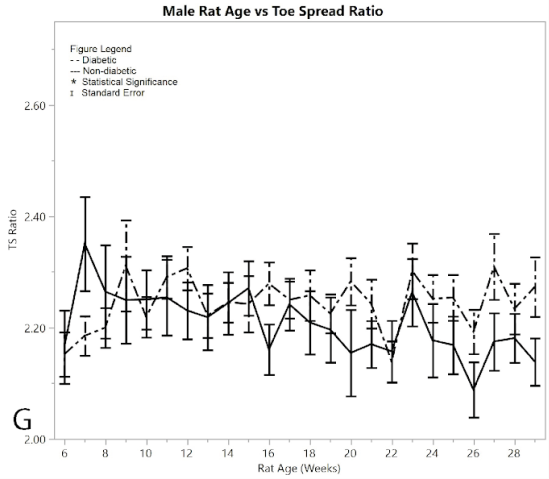
Figure 2:G) average toe spread ratios
With all six tests, toe spread tests excluded, the ANOVA analysis identified time points showing diabetic rat behavioral test results that were significantly different from the non-diabetic rats, thus demonstrating that there was a significant difference between STZ-induced diabetic rats treated with insulin and non-diabetic rats.
Discussion
The mechanism by which STZ induces diabetes in animal models has been widely studied. Much research has been done to show how a single intraperitoneal injection of STZ causes a number of physiological changes in the subject. The most significant change is the alkylation of DNA within pancreatic beta cells [12, 13]. The damage of the DNA leads to altered replication and transcription mechanisms, and eventually cell death. Other proposed mechanisms by which STZ effectively damages pancreatic beta cells include the production of reactive oxygen radicals and reactive NO groups [14-17]. Many factors that mediate the effects of STZ induction, thereby preventing the development of diabetes, have also been researched. These include the presence of intracellular anti-oxidizing agents, NO scavengers, and reduced gene-expression of GLUT2, the glucose transporter by which STZ is brought up into the pancreatic beta cells [18, 19].
A possible limitation of the STZ-induced type one diabetes model that has been described is the severity of symptoms that accompany the natural progression of the disease following induction. A possible result of the cytotoxic effects of STZ, moderate to extreme cachexia, manifested in symptoms such as polyuria, diabetic cataracts, and diarrhea, has been reported as a factor that confounds the elucidation of symptoms of DPN [20-23]. Other studies have shown that consistent insulin therapy will also prevent the onset of indices of painful diabetic neuropathy [24-26]. However, the results of the present study show how insulin may be administered while still allowing for the development of hyperglycemia and subsequent DPN. For example, it was generally observed that when left untreated, rats experienced a drastic increase in polyuria. In a single 24-hour period, two untreated rats living in a shoe box style cage, as described and approved in the IACUC protocol, produced enough urine to completely saturate their bedding within the cage. However, rats that were continuously treated with insulin were never observed to experience polyuria to anywhere near the same severity.
While still allowing for the development of peripheral neuropathy, this study has shown that the administration of insulin allows the quality of life of diabetic animals to remain similar to control animals. Additionally, this study has shown that the correct dosage of insulin therapy is able to maintain the general health of animals while still allowing for the development of hyperglycemia and DPN, corroborating evidence published in other studies [21]. The animals in our study were assessed daily according to the health assessment scale described above. Of the 66 animals included in data analysis, only 4 ever totaled a score equal to 3. Only one totaled a score above 3, which placed that rat into the category of ‘some evidence of pain or discomfort’. Admittedly, an alleged issue with pain and distress scoring as described above is the potential for subjectivity bias. Therefore, future studies may find it beneficial to explore more concrete measures of animal wellbeing such as indices of liver and kidney toxicity as more objective measures of animal health.
It has been noted that other studies may contain end points for studying DPN including motor and sensory neuron nerve conduction velocities and intra-epidermal nerve fiber density in the skin. Future studies may wish to include these for additional assessment of the neuropathic state. However, the development of neuropathy can be tracked using alternate methods as described in this study, and also shown by other Wild et al [27].
Unexpectedly, the non-diabetic rats also showed an increase in hypersensitivity over time, as evidenced by decreased response time to both Hargreaves method and reaction force. A possible explanation for this unexpected development of hyperalgesia could be due to the high and frequent stimuli of these tests. Although this study made no attempt to pursue this topic, other studies have noted that repeated and intense noxious stimuli can result in a lowering of the activation threshold causing the response to later stimuli to be amplified [28, 29].
A well reported trend in algesia for STZ induced rats is that around 4 weeks post STZ induction rats develop neuropathy in the form of hyperalgesia. This hyperalgesia is reported to eventually transition to hypoalgesia around 8 weeks post induction [30]. With the exception of the results found by the Hargreaves method on female rats, this pattern was not present in the diabetic group. After 20 weeks of being diabetic, the rats in our study showed no signs of hyperalgesia transitioning to hypoalgesia. This is relatable to another study also reporting inconsistencies to this otherwise well-established pattern of algesia transition [31].
Conclusion
The use of STZ to induce diabetes in experimental animals is widespread and effective. However, due to a number of factors, its application in studying DPN has been underused. This study showed the effective and significant development of DPN in STZ rats being treated with insulin. Three of four nerve tests showed statistically significant differences between the post-induction diabetic rat groups and non-diabetic rat groups. We conclude that the post-induced diabetic rats had statistically greater values in Hargreaves method and Von Frey force and time than in the non-diabetic groups, for both the male and female rats. These data serve as strong evidence that diabetic neuropathy can be successfully developed in an STZ-induced diabetic rat model with regular insulin therapy.
Acknowledgements
This research was sponsored by the Office of Research and Creative Activities (ORCA) at Brigham Young University. Adam Millett, David Walton, Harper Christensen, Parker Cressman, Jonathan Trout, Alyssa Northrup, Yukimo Strong, Connor Sugrue, Daniel Lathen, Sarah Coffin, Samuel Biggs, Zachary Diamond, Joseph Wright, Dawn Castillo, Kyle LeFevre, Steele Ayers, Hanna Peters, Nathan Lloyd, Kyle Kuykendall, Logan Nielsen, Ray Norton, Michael Stephens, Caleb Dixon, Calvin Panah, Cole Martin, Sara Werner, Joey Wright, Kody Hasebi, Tyler Reed, Jeffrey Ward, Enoch Councill, Cameron Green, Nina Giannuzzi, Joseph Young, Talan Gunnell, Mikaela De Coster, Jeffery Young, Michael Lange, Cody Hansen, Rebekah Hans, Garen Anderson, Matt Mitchell, Trent Johnson, Mercede Erickson, Christopher Cutler, Arthur Silva, Josh Clason, Kody Crook, Ty Bodily, Sam Gish, and Adam Babcock provided assistance in animal care, project support, and data analysis.
Declarations of financial interest
None
Article Info
Article Type
Research ArticlePublication history
Received: Mon 16, Jul 2018Accepted: Mon 30, Jul 2018
Published: Mon 20, Aug 2018
Copyright
© 2023 Alonzo D. Cook. This is an open-access article distributed under the terms of the Creative Commons Attribution License, which permits unrestricted use, distribution, and reproduction in any medium, provided the original author and source are credited. Hosting by Science Repository.DOI: 10.31487/j.RGM.2018.02.006
Author Info
Corresponding Author
Alonzo D. CookNeuroscience Center, Brigham Young University, Provo, UT 84602, USA
Figures & Tables
Table 1: Insulin Therapy Guide
|
Rat Weight |
100-174g |
175-249g |
250-349g |
350-424g |
425-499g |
500-574g |
575g+ |
|
Insulin |
0.5U |
1U |
1.5U |
2U |
2.5U |
3U |
3.5U |
Table 2: Pain & Distress Scoring
|
Body Weight 0 Normal 1 < 10% weight loss 2 10 - 15 % weight loss, eating 3 > 20% weight loss, not eating |
|
Appearance 0 Normal 1 Lack of grooming 2 Coat rough, possible nasal or ocular discharge 3 Coat very rough, abnormal posture, eyes sunken and glazed |
|
Clinical Signs 0 Normal 1 Diarrhea, constipation 2 Respiratory rates altered, respiratory depth altered, skin tents 3 Cyanotic extremities, labored breathing |
|
Unprovoked Behavior 0 Normal 1 Minor changes 2 Abnormal behavior, less mobile, less alert, inactive when activity expected 3 Paralysis, inability to remain upright, shivering, convulsion |
Table 3: Timeline
|
Nerve assays began |
21 days |
|
Diabetes was induced |
90 days |
|
Insulin treatment began |
91 days |
|
Nerve assays ended |
203 days |
References
1. National diabetes statistics report: estimates of diabetes and its burden in the United States. Centers for Disease Control and Prevention (2014).
2. Diseases Diabetic Neuropathy. https://www.niddk.nih.gov/health-information/diabetes/overview/preventing-problems/nerve-damage-diabetic-neuropathies accessed May 24, 2018.
3. Vidal Y, Brock, C., Gooch, C.L. (2013) Medical Treatments for Painful Diabetic Neuropathy. Painful Diabetic Polyneuropathy. 2013: 49-59. [Crossref]
4. Stevens MJ, Obrosova I, Cao X, Van Huysen C, Greene DA (2000) Effects of DL-alpha-lipoic acid on peripheral nerve conduction, blood flow, energy metabolism, and oxidative stress in experimental diabetic neuropathy. Diabetes 49: 1006-1015. [Crossref]
5. Goss JR, Goins WF, Lacomis D, Mata M, Glorioso JC, et al. (2002) Herpes simplex-mediated gene transfer of nerve growth factor protects against peripheral neuropathy in streptozotocin-induced diabetes in the mouse. Diabetes 51: 2227-2232. [Crossref]
6. Council NR (2011) Guide for the care and use of laboratory animals eight edition. The National Academies Press. 2011. [Crossref]
7. Yu Cheng, Jing Shen, Weizheng Ren, Haojie Hao, Zongyan Xie, et al. (2017) Mild hyperglycemia triggered islet function recovery in streptozotocin-induced insulin-deficient diabetic rats. J Diabetes Investig 8: 44-55. [Crossref]
8. Malcangio MT, David R (1998) A pharmacologic analysis of mechanical hyperalgesia in streptozotocin/diabetic rats. Pain 76: 151-157. [Crossref]
9. Hargreaves K, Dubner R, Brown F, Flores C, Joris J (1988) A new and sensitive method for measuring thermal nociception in cutaneous hyperalgesia. Pain 32: 77-88. [Crossref]
10. Jubran M, Widenfalk, J. (2003) Repair of peripheral nerve transections with fibrin sealant containing neurotrophic factors. Exp Neurol 184: 204-212. [Crossref]
11. Flecknell PA (1994) Refinement of Animal Use-Assessment and Alleviation of Pain and Distress. Lab Anim 38: 222-231. [Crossref]
12. Delaney CA, Dunger A, Di Matteo M, Cunningham JM, Green MH, et al. (1995) Comparison of inhibition of glucose-stimulated insulin secretion in rat islets of Langerhans by streptozotocin and methyl and ethyl nitrosoureas and methanesulphonates. Lack of correlation with nitric oxide-releasing or O6-alkylating ability. Biochem Pharmacol 50: 2015-2020. [Crossref]
13. Elsner M1, Guldbakke B, Tiedge M, Munday R, Lenzen S (2000) Relative importance of transport and alkylation for pancreatic beta-cell toxicity of streptozotocin. Diabetologia 43: 1528-1533. [Crossref]
14. Bedoya FJ, Solano F, Lucas M (1996) N-monomethyl-arginine and nicotinamide prevent streptozotocin-induced double strand DNA break formation in pancreatic rat islets. Experientia 52: 344-347. [Crossref]
15. Takasu N, Komiya I, Asawa T, Nagasawa Y, Yamada T (1991) Streptozocin- and alloxan-induced H2O2 generation and DNA fragmentation in pancreatic islets. H2O2 as mediator for DNA fragmentation. Diabetes 40: 1141-1145. [Crossref]
16. Kröncke KD, Fehsel K, Sommer A, Rodriguez ML, Kolb-Bachofen V (1995) Nitric oxide generation during cellular metabolization of the diabetogenic N-methyl-N-nitroso-urea streptozotozin contributes to islet cell DNA damage. Biol Chem Hoppe Seyler 376: 179-185. [Crossref]
17. Turk J, Corbett JA, Ramanadham S, Bohrer A, McDaniel ML (1993) Biochemical evidence for nitric oxide formation from streptozotocin in isolated pancreatic islets. Biochem Biophys Res Commun 197: 1458-1464. [Crossref]
18. Schnedl WJ, Ferber S, Johnson JH, Newgard CB (1994) STZ transport and cytotoxicity. Specific enhancement in GLUT2-expressing cells. Diabetes 43: 1326-1333. [Crossref]
19. Thulesen J, Orskov C, Holst JJ, Poulsen SS (1997) Short-term insulin treatment prevents the diabetogenic action of streptozotocin in rats. Endocrinology 138: 62-68. [Crossref]
20. Wang YJ, Xie XS, Feng SG, Long QX, Ai N (2014) [Causes of death in STZ-induced rat models of diabetes mellitus]. Sichuan Da Xue Xue Bao Yi Xue Ban 45: 691-695. [Crossref]
21. Calcutt NA, Jorge MC, Yaksh TL, Chaplan SR (1996). Tactile allodynia and formalin hyperalgesia in streptozotocin-diabetic rats: effects of insulin, aldose reductase inhibition and lidocaine. Pain 68: 293-299. [Crossref]
22. Calcutt NA, Fernyhough, P (2016) An Introduction to the History and Controversies of Animal Models of Diabetic NeuropathY. Int Rev Neurobiol 127: 45-52. [Crossref]
23. Fox A, Eastwood C, Gentry C, Manning D, Urban L (1999) Critical evaluation of the streptozotocin model of painful diabetic neuropathy in the rat. Pain 81: 307-316. [Crossref]
24. de Morais H, de Souza CP, da Silva LM, Ferreira DM, Werner MF, et al. (2014) Increased oxidative stress in prefrontal cortex and hippocampus is related to depressive-like behavior in streptozotocin-diabetic rats. Behav Brain Res 258: 52-64. [Crossref]
25. King MR, Anderson NJ, Liu C, Law E, Cundiff M, et al. (2015) Activation of the insulin-signaling pathway in sciatic nerve and hippocampus of type 1 diabetic rats. Neuroscience 303: 220-228. [Crossref]
26 Salvioni L, Fiandra L, Del Curto MD, Mazzucchelli S, Allevi R (2016) Oral delivery of insulin via polyethylene imine-based nanoparticles for colonic release allows glycemic control in diabetic rats. Pharmacol Res 110: 122-130. [Crossref]
27. Wild KD, Bian D, Zhu D, Davis J, Bannon AW, et al. (2007) Antibodies to nerve growth factor reverse established tactile allodynia in rodent models of neuropathic pain without tolerance. J Pharmacol Exp Ther 322: 282-287. [Crossref]
28. Latremoliere A, Woolf CJ (2009). Central Sensitization: A Generator of Pain Hypersensitivity by Central Neural Plasticity. The journal of pain : official journal of the American Pain Society 10: 895-926. [Crossref]
29. Woolf CJ, Walters ET (1991) Common patterns of plasticity contributing to nociceptive sensitization in mammals and Aplysia. Trends Neurosci. 14: 74-78. [Crossref]
30. Calcutt NA FJ, Mizisin AP (2004) Prevention of sensory disorders in diabetic Sprague-Dawley rats by aldose reductase inhibition or treatment with ciliary neurotrophic factor. Diabetologia 47: 718-724. [Crossref]
31. Reddy M Pabbidi, Shuang-Quan Yu, Siying Peng, Romesh Khardori, Mary E Pauza, et al. (2008) Influence of TRPV1 on diabetes-induced alterations in thermal pain sensitivity. Mol pain 4: 9. [Crossref]