Journals
Radiosensitizing performance of uncoated and citrate-coated SPIONs in cancerous and non-cancerous cells
A B S T R A C T
Superparamagnetic iron oxide nanoparticles were shown to exhibit a high performance as X-ray dosage enhancer in tumor cells. The radio-enhancing potential of uncoated and citrate-coated SPIONs was comprehensively studied for tumor and healthy cells. Pristine and citrate-coated SPIONs drastically differ in their water dispersibility and adsorption affinity for proteins. The activities of antioxidant enzymes in the healthy cells were shown to be significantly distinct from those in the tumor cells as containing a much higher H2O2 concentration. Pristine SPIONs catalyzed the Fenton reaction of hydrogen peroxide to the highly reactive hydroxyl radical in all cell types. In contrast, intracellular citrate-stabilized SPIONs were shown t
o be non-toxic and to do not affect the formation of reactive oxygen species. X-ray irradiation of citrate-stabilized SPIONs, when internalized by tumor cells, significantly boost the formation of hydroxyl radicals, whereas the healthy cells preserved their initial levels of reactive oxygen species.
Keywords
Superparamagnetic iron oxide nanoparticles,radiation therapy,cellular uptake,enzyme activity,intracellular hydrogen peroxide
Background
Reactive oxygen species (ROS) in cells, as comprising the superoxide anion (O2.-), hydrogen peroxsside (H2O2), and hydroxyl radical (HO.), emerge from endogenous and exogenous sources due to partial reduction of oxygen [1, 2]. Exogeneous sources are, for instance, pollutants, transition metals or radiation, whereas endogenous ROS are mostly generated during oxygen-consuming metabolic reactions taking place in peroxisomes, mitochondria and the endoplasmic reticulum. In particular, O2.- is formed in mitochondria by single-electron reduction of O2 which occurs through the cooperative action of the multi-protein complexes I, II and III [3-5]. H2O2 emerges from the dismutation of O2.- which may take place either in a spontaneous fashion or via catalysis by superoxide dismutase. The reaction between H2O2 and O2.- follows the Haber-Weiss mechanism and results into the formation of highly reactive HO. as irreversibly destroying most cytoplasmic macromolecules, being DNA, carbohydrates, protein, and phospholipids. Nevertheless, the essential enzymatic sources for ROS generation are NAD(P)H oxidases and xanthine oxidase [6, 7]. At low concentrations ROS act as second messengers in signal transduction pathways which finally regulate the gene expression and post-translational modification of critical proteins. Moderately increased concentrations of ROS may even stimulate the cell proliferation and differentiation [2, 3, 5-8]. But ROS at excessive intracellular levels damage proteins, nucleic acids, lipids, membranes and organelles, which introduce apoptosis. Cancer is associated with oxidative stress resulting from higher levels of intracellular ROS and simultaneous suppression of the antioxidant system, which consists of enzymatic and non-enzymatic antioxidants [9-11]. Glutathione, as an example of endogeneous, non-enzymatic antioxidants, plays a major role for the regulation of the intracellular redox state by providing a ubiquitous source of reducing equivalents [1, 8, 12, 13]. Endogenous enzymatic defenses employ superoxide dismutase (SOD), glutathione peroxidase (GPx) and catalase (CAT). SOD catalyzes the dismutation of O2.- to H2O2, which is degraded to water and oxygen by catalase. Glutathione peroxidase reduces lipid peroxides as well as H2O2 to water and lipid alcohols, while it oxidizes glutathione to glutathione disulfide [2, 8, 13, 14]. As being in a permanent pro-oxidative state cancer cells are more sensitive to further elevated ROS levels, which are intentionally achieved in course of the radiation therapy using X- or γ-rays to destroy cancer tissue. In radiation therapy the highly reactive HO. is generated by X-ray induced radiolysis of cytoplasmic water [15-17]. Unfortunately, radiation therapy causes damages to the surrounding healthy tissue in the treatment volume and moreover, promotes the development of radioresistence [18].
In order to enhance the applied X-ray radiation dose in tumor cells molecular or nanomaterial radiosensitizers have been developed in recent past.18,19 Nanoparticles composed of high atomic number materials (e.g. gold) exhibit a large photoelectric absorption cross section for low kilovoltage X-rays and subsequently to irradiation, release photoelectrons, Auger electrons, and characteristic X-rays in direct proximity [19]. On the other hand, passivated superparamagnetic iron oxide nanoparticles (SPIONs), under X-radiation exposure, attain catalytically active surfaces as containing Fe2+ cations. Thus X-ray-activated SPION surfaces catalyze the Fenton reaction of cytoplasmic H2O2 to HO. [20-22]. Since uncoated (pristine) SPIONs (pSPIONs) exhibit hydrophobic surfaces and a large surface-to-bulk ratio, they form in aqueous solutions, such as in cell media, micron-sized aggregates because of hydrophobic–hydrophilic, and magnetic dipole-dipole interactions [23]. Hence, any kind of medical application necessitates the coating of the SPION surfaces with biocompatible, hydrophilic polymers, carbon acids, or proteins [24]. Furthermore, the surface architecture of nanoparticles was shown to control the formation and composition of the protein corona around nanoparticles which is a key determinant for the cellular uptake mechanism and intracellular fate of nanoparticles [25-27].
In this contribution, we could show that pSPIONs and citrate-coated SPIONs (caSPIONs) significantly differ in their hydrodynamic sizes, zeta potential, cellular uptake mechanism and cytotoxicity. This is explained with their distinct surface chemistry that rules the formation of the protein corona in cell culture media. In order to elucidate the diverging cellular uptake efficiency of tumor and healthy cells, the internalization of SPIONs by breast cancer cells (MCF-7), lung cancer cells (A549), endothelial umbilical vein cells (HUVEC) and breast epithelial cells (MCF-10 A) was studied. The respective response of the diverse tumor and healthy cells on SPIONs was found to arise from their distinct enzyme activities of the anti-oxidative defense system (i.e. superoxide dismutase (SOD), catalase (CAT), glutathione peroxidase (GPx)) and their different intracellular H2O2 concentrations. The surfaces of pSPIONs contain Fe2+ cations which generated high intracellular concentrations of HO. before and after X-ray irradiation. In contrast, caSPIONs did not alter the ROS production in non-irradiated cells, but considerably increase the HO. formation in tumor cells under X-ray exposure, even at a single dose of 1 Gy.
Methods
All used chemicals and devices are listed in the supporting information (SI).
Synthesis of pSPIONs and caSPION: The SPIONs were synthesized by co-precipitation of ferric and ferrous chloride at 0°C under argon atmosphere following Massart´s method [28]. The SPIONs were left uncoated or subsequently coated with citric acid. All SPIONs were stored under oxygen-free conditions.
Determination of the concentration of the SPION-adsorbed proteins: 2.5 mL of the SPION solution (2 mg/mL), 2 mL of ultrapure water and 0.5 mL of either FCS or BSA (10 mg/mL) were mixed. The mixture was gently shaken in a water bath at 37°C overnight. The SPION solution was centrifuged (7000 rpm, 10 min), and the supernatant was separated for the protein-content measurement. The precipitated SPIONs were redispersed in ultrapure water and used for zeta potential and DLS determination. The protein concentration of the initial BSA or FCS solution (ci) as well as that of the supernatants (cf) was measured using the BCA protein assay. The concentration of the SPION-adsorbed proteins was determined employing a calibration curve obtained from defined BSA concentrations. The molality of the SPION-adsorbed proteins (Mads.proteins) was calculated using the equation as follows: Mads.proteins= (ci-cf)V/m(SPIONs) (1) where V is the total volume of the solution, and m(SPIONs) is the mass of the SPIONs [29].
Cell culture and cell treatment: The composition of the cell culture media was described in the SI. For the different cell experiments 3104 cells/ well were seeded into 96 well plates (superoxide, hydrogen peroxide, hydroxyl radical, and cell viability assay) and 3105 cells/well into 6 well plates. After 1 day of incubation the cells were exposed to 10 μg/mL of the SPIONs dispersed in cell culture medium for 24 h. Then the cells were X-ray irradiated, and the assays were performed as described below.
ROS detection assays: The SPION solutions were aspirated off. According to the assay protocols (see SI), the respective dye solution was added. Half of the plates were exposed to a single X-ray dosis of 1 Gy. In addition to the ROS detection assays the MTT assays were performed for all plates [22-24].
Determination of the H2O2 concentration per cell: Half of a 96 well plate was studied with the PFBS-F assay, and the other half was examined using the neutral red assay (SI). Two calibration curves were produced: one to compare the neutral red absorption with the cell number and one to correlate the PFBS-F fluorescence intensity with the concentration of H2O2. For the first calibration curve exact numbers of cells (10000 - 200000 cells per well) were seeded in a 96-well plate. After 6 h of cell attachment the neutral red assay was performed. For the second calibration curve selected concentrations of PFBS-F ranging between 110-4 and 110-8 mol/L were per-hydrolyzed with H2O2 and quantified by fluorescence measurements. The H2O2 concentration per cell [pmol/cell] was calculated by dividing the molar amount of H2O2 by the cell number.
Cell TEM images: MCF-7 cells were incubated overnight in cell culture medium with 10 μg/mL SPIONs. Afterwards half of the cells were washed with ice-cold PBS and the other half with PBS containing Na2EDTA. The cells were fixed with 2.5% glutaraldehyde overnight at 4°C and were post-fixed in 1% osmium tetroxide and 3% potassium ferricyanide at RT. The cells were dehydrated in alcohol and embedded in Epon. Sections of 60–70 nm were cut using an ultramicrotome and were mounted on Epon blocks. TEM images of the non-contrasted silver-grey ultrathin sections were recorded.
Determination of the intracellular SPION content by measuring the Fe concentration per cell: After 24 h the cell medium was removed and the cells were washed thrice with PBS buffer containing Na2EDTA, to remove SPIONs from the cell surface. Afterwards, the cells were detached in a trypsin/EDTA solution, and the cell number was determined with a hemocytometer. The cell suspension was centrifuged at 200 g for 5 min. The cell pellet was dissolved in 37 % HCl and heated at 60°C for 1 h. The iron concentration of the samples was measured using ICP-AES. The iron concentration was determined per cell by division by the number of cells.
Preparation of the cell extract: In addition to the cell medium containing SPIONs, a negative (cell medium without SPIONs) and a positive control (0.15 mM H2O2) were performed. Half of the 6-well plates were X-ray irradiated with a single dose of 1 Gy. 4-6 h after X-ray irradiation the cell medium was aspirated off, and the cells were lysed in cell lysis buffer (20 mM Tris-HCl (pH 7.5), 150 mM NaCl and 1 % Triton-X 100, for the measurement of the GSH level 0.6 % sulfosalicylic acid was added). The cell lysate was homogenized on ice by sonication. After centrifugation (15000 g, 10 min, 4°C) the cell extract (supernatant) was maintained on ice.
Determination of the protein concentration: Protein concentrations were measured employing the BCA Protein Assay Kit. The calibration curve was obtained using defined concentrations of BSA.
Superoxide-dismutase (SOD) activity assay:The SOD activity was determined using the method proposed by Marklund and Marklund [30].
Catalase (CAT) activity assay: The CAT assay was performed by measuring the decomposition of H2O2 at 25°C. 50 µL of the cell extract was added to 950 µL 0.1 M PBS containing 0.033 % H2O2. The OD at 240 nm was recorded every 30 sec. for 3 min. The activity was calculated using the extinction coefficient (ε240 = 43.6 mM-1 cm-1). The final results were normalized to the protein content of the sample (µmol/min/mg prot.)
Glutathione-peroxidase (GPx) activity assay. The GPx activity was indirectly measured via a coupled reaction with glutathione reductase (GR). The assay mixture contained 100 μL reaction cocktail (50 mM phosphate-Puffer (pH 7.0), 1 mM EDTA, 1 mM GSH, 250U/mL GR and 0.1 mg/mL NADPH), and 20 μL of enzyme sample or cell extract. The reaction was initiated through the addition of 10 μL 0.021% hydrogen peroxide solution. The absorption at 340 nm is measured every 30 s for 5 min at 25°C. The data were normalized by determining the protein concentration.
Concentration of glutathione (GSH): This assay was performed according to Rahman et al. [31].
Clonogenic cell survival assay: The cell culture experiment was based on a method described in detail by Franken et al. [32]. After X-ray irradiation between 0 and 3 Gy, the cells were detached, seeded and grown in 6-well plates for 2 weeks to form colonies. The colonies were fixed and stained with a mixture of 0.5 % (w/v) crystal violet in 50/50 methanol/water for 30 min. The number of colonies containing > 50 cells was used for the calculation of the surviving fraction (SF). The survival curves were fitted to a linear quadratic function (ln SF = -(αD+βD2)). To quantify the X-ray enhancing effect the dose modifying factor (DMF) was calculated from the X-radiation survival curves by determining the ratio of radiation doses at the 50 % survival level (radiation dose of the cells containing the SPIONs divided by the radiation dose of the control cells). The DMF values < 1 indicate a X-ray enhancing effect.
Statistical Analysis: Data are presented as arithmetic mean values ± standard error (SE). The statistical analysis was performed using the analysis of variance (ANOVA) with post hoc Bonferroni correction for multiple comparisons.
`Table 1. Zeta potential values and hydrodynamic diameter of uncoated SPIONs (A) and citrate coated SPIONS (B) in water and after adding either bovine serum albumin (BSA) or fetal calf serum (FCS).
(A)
|
Uncoated SPIONs |
water |
Water + BSA (1 mg/mL) |
Water + 10 % FCS |
|
Molality of the proteins adsorbed on SPIONs [μg/mg SPIONs] |
------- |
161.53 ± 6.71 |
184.31 ± 9.06 |
|
hydrodynamic diameter [nm] |
164.2 ± 45 |
1484 ± 30 |
1281 ± 154 |
|
zeta potential [mV] |
+ 14 ± 1.82 |
+ 1.21 ± 0.499 |
-1,19 ± 0.203 |
(B)
|
Citrate coated SPIONs |
water |
Water + BSA (1 mg/mL) |
Water + 10 % FCS |
|
Molality of the proteins adsorbed on SPIONs [μg/mg SPIONs] |
--------- |
71.25 ± 6.69 |
35.14 ± 4.98 |
|
hydrodynamic diameter [nm] |
28 ± 4 |
255 ± 29 |
32 ± 6 |
|
zeta potential [mV] |
- 23.4 ± 0.611 |
-3.89 ± 0.544 |
-20.7 ± 0.720 |
Results
The SPIONs were synthesized through alkaline co-precipitation in aqueous solution at 0°C under oxygen-free conditions. The surface chemistry and hydrodynamic diameters of pSPIONS and caSPIONs in ultrapure water and aqueous solutions containing BSA at 1 mg/mL or 10 % FCS were examined by performing DLS and zeta potential measurements. In contrast to pSPIONs the caSPIONs exhibited excellent water dispersibility. The mean hydrodynamic diameter of the caSPIONs was 28 nm, whereas that one of the pSPIONs reached a value of 164.2 nm due to the formation of aggregates (table 1). These results are corroborated by the rather narrow and, in contrast, strikingly broad hydrodynamic diameter distribution curves of the caSPIONs and pSPIONs in water, respectively (SI Figure 1). The zeta-potential values in table 1 indicate that pSPIONs were positively charged (+14 ± 1.82 mV), and caSPIONs carried negative surface charges (-23.4 ± 0.611 mV). In order to elucidate the surface-chemistry directed formation of a protein corona, the SPIONs were dispersed in solutions containing BSA at a concentration of 1 mg/mL or 10 wt.% FCS. The significant increases of the hydrodynamic diameters up to 910 % as well as the distinct alteration of the respective surface charges of both kinds of SPIONs imply efficient adsorption of proteins (Table 1). BSA and other proteins are negatively charged at pH 7.4, and thus, are expected to strongly interact with the positively charged pSPIONs which is reflected by the large values of the mean hydrodynamic diameter with 1484 nm (BSA) and 1281 nm (FCS) (Table 1(A), SI Figure 2(a)). However, these rather large mean values and broad distributions of the hydrodynamic diameter nicely correlate with those of pSPIONs and thus, indicate the formation of even larger agglomerations. On the other hand, negatively charged caSPIONs are also expected to interact with proteins, but the interaction mechanisms proposed up to now are still under debate.33 The rather broad hydrodynamic size distribution of BSA-covered SPIONs is centered at 255 nm. The protein adsorption in FCS resulted into a very small increase of the mean hydrodynamic diameter of the caSPIONs by 14 %, whereas the hydrodynamic diameter distribution remained nearly unchanged (Table 1(B), SI Figure 2(b)). Consistently, the BSA adsorption to pSPIONs and caSPIONs as well as the FCS protein adsorption to pSPIONs generated significant changes of the surface charges. The respective zeta potential values are +1.21 ± 0.5 mV (pSPIONs), -3.89 ± 0.5 mV (caSPIONs) and -1.19 ± 0.2 mV (table 1). In contrast, the interaction forces between FCS proteins and caSPIONs are obviously less strong as being obvious from the only slightly elevated zeta potential value with -20.7 ± 0.7 mV (Table 1 B).
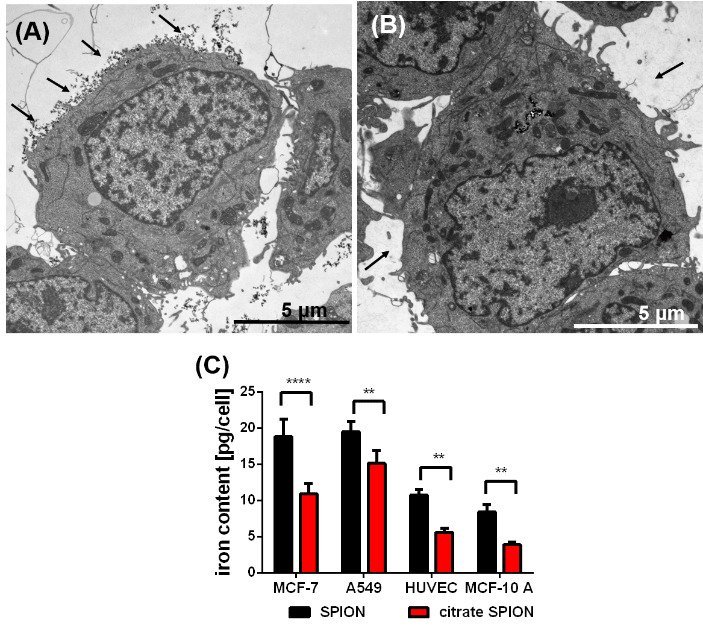
Figure 1: TEM image of a SPION-loaded MCF-7 cells before washing (A) and after washing with PBS (B); SPIONs attached to cell surface marked by black arrows (A); washed with PBS containing Na2EDTA (B): all attached SPIONs are removed (black arrows (B)), difference in the cellular uptake of the uncoated and citrate-coated SPIONs (C) into the various humane cell lines determined by the iron content per cell, n = 3, ** p˂0.01, *** p˂ 0.001
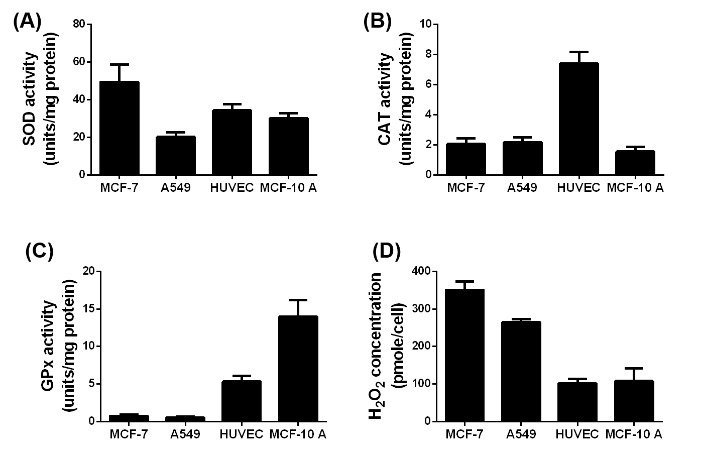
Figure 2: Difference in the SOD (A), CAT (B) and GPx (C) activity and H2O2 (D) concentration in the four used cell lines without exposure to NPs or irradiation, n= 6.
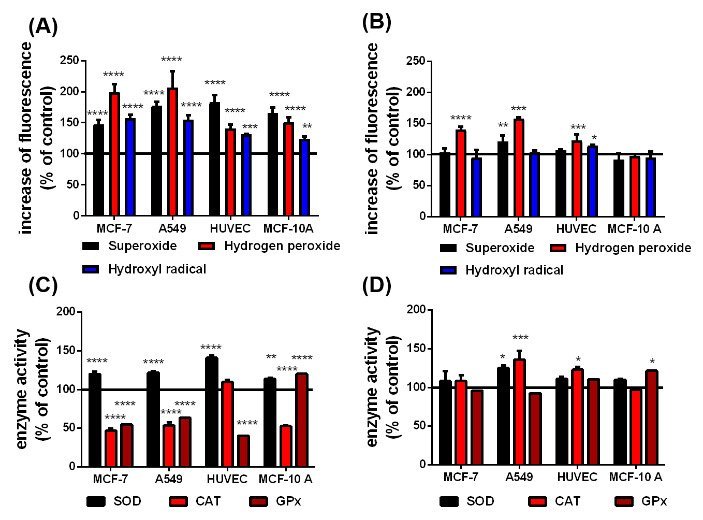
Figure 3: According to the Haber-Weiss and Fenton reactions, qualitative changes in superoxide, H2O2 and hydroxyl radical level in presence of the uncoated (A) and citrate-coated (B) SPIONs and the difference in the SOD, CAT and GPx activity in cells with uncoated (C) and citrate-coated (D) SPIONs before irradiation. The black line at 100 % represents the cells in cell culture medium without any SPIONs as a reference, n=6, *p<0.05, **p<0.01, ***p>0.001, ****p<0.0001.
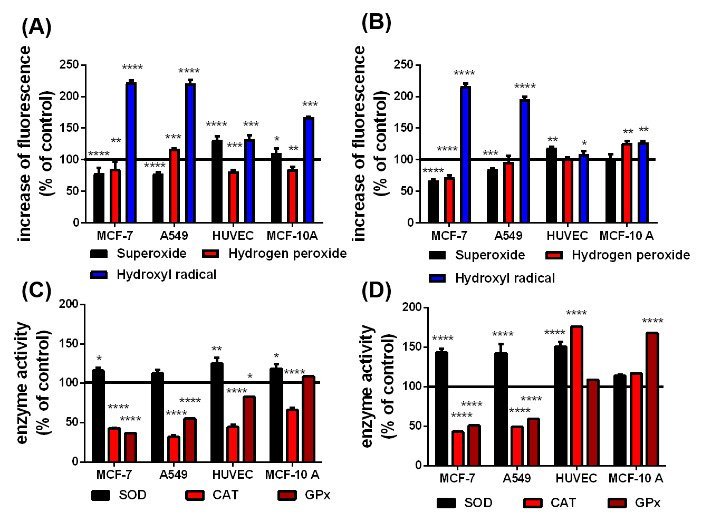
Figure 4: According to the Haber-Weiss and Fenton reactions, qualitative changes in superoxide, hydrogen peroxide and hydroxyl radical level in presence of the uncoated (A) and citrate-coated (B) SPIONs and the difference in the SOD, CAT and GPx activity in cells with uncoated (C) and citrate-coated (D) SPIONs after irradiation. The black line at 100 % represents the cells in cell culture medium without any SPIONs as a reference n=6, *p<0.05, **p<0.01, ***p>0.001,****p<0.0001.
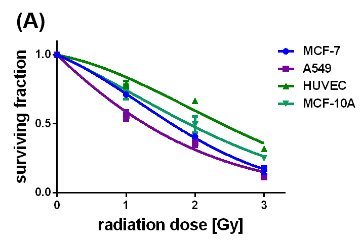
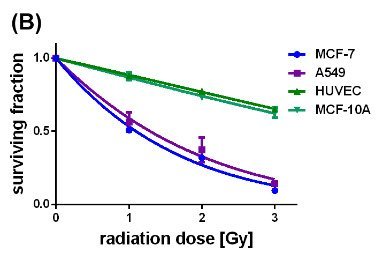
Figure 5: Survival curves of the different cell lines either loaded with uncoated (A) or citrate-coated (B) SPIONs, irradiated with single dose of 0-3 Gy, n=6.
The amount of pSPIONs and caSPIONs in tumor cells (MCF-7, A549) and non-cancerous cells (MCF-10 A, HUVEC) scales with the respective intracellular iron content. The TEM image of a SPION-loaded MCF-7 cell in (Figure 1A) demonstrates that SPIONs did not only intrude into the cell but resided on the cell surface (black arrows). Therefore, the SPIONs had to be removed from the cell surface by thorough, threefold washing with PBS buffer containing Na2EDTA (Figure 1B). Afterwards the intracellular iron content was determined by performing ICP-AES measurements (Figure 1C). The values of the iron content per cell (in pg per cell) verify that the tumor cells ingested a considerably larger amount of SPIONs than the healthy cells did. Despite their significantly larger mean hydrodynamic diameter pSPIONs entered all cells to a higher extent than the caSPIONs, which may be explained with their positive surface charges. The cell-viability studies on SPION-loaded tumor and healthy cells indicate the higher cytotoxicity of the pSPIONs in comparison with the caSPIONs (SI Figure 3). pSPIONs in HUVECs and MCF-10 A cells decreased the viability of the cells by ca. 50 % and that of the MCF-7 and A549 cells by ca. 30 %. In contrast, the caSPIONs were biocompatible for the non-cancerous cells, but they reduced the viability of the tumor cells by 20 – 25 %.
The performance of SPIONs as X-ray dose enhancing agents crucially depends on the activities of the ROS degrading enzymes SOD, CAT and GPx (figures 2(A), (B) and (C)). Since CAT and GPx degrade intracellular H2O2, the respective H2O2 level represents a gauge for these enzyme activities (figure 2(D)). The non-cancerous HUVECs and MCF-10 A cells exhibited almost similar SOD activities (30 – 35 %) and H2O2 levels (100 – 105 %) but respectively contrarily increased CAT and GPx activities. As expected, the H2O2 levels in the MCF-7 and A549 cells are 3.5 and 2 6fold larger than those in the healthy cells. This result is consistent with the rather small GPx and CAT activities of the MCF-7 and A549 cells. One obvious reason for the high H2O2 level in MCF-7 cells is the significantly increased SOD activity which correlates with the relatively smaller SOD activity and thereupon the smaller H2O2 level in A549 cells. In order to elucidate the impact of the SPIONs on the ROS formation and associated enzymatic activities, the different cell lines were incubated over 24 h with 10 μg/mL pSPIONs and caSPIONs. The pSPIONs enhanced the O2.-, H2O2 and HO. formation in all cell types by 50 – 80 %, 40 – 110 % and 20 – 60 %, respectively (Figure 3A). In case of the tumor cells (MCF-7 and A549), when containing the caSPIONs, only the O2.- and HO. concentrations were increased to 120 % and 140 – 160 %, respectively. These results match the associated enzyme activities in all SPION-loaded cell lines. The SOD activity of the tumor and healthy cells, containing pSPIONs or caSPIONs, was elevated to values of 110 – 145 % in comparison with the respective unstained cells (Figures 3A and 3B). On the other hand, the tumor cells, when loaded with pSPIONs exhibited drastically lowered values of the CAT and GPx activities (45 - 55 % and 60 – 70 %), which is consistent with the correspondingly slightly altered H2O2 level in these cells (Figures 3A and 3C). pSPIONs acted on the CAT and GPx activities in the healthy cells in an opposite fashion: the CAT activity in HUVECs was increased to 110 % but decreased to 50 % in MCF-10 A cells, whereas the GPx activity in HUVECs is lowered to 40 % and in MCF-10 A cells elevated to 120 % (Figure 3C). In a nutshell, the pSPIONs boosted the ROS production and reduced the activities of the H2O2 degrading enzymes in all cell lines under study. These results comply with the considerably diminished viability values of all cells loaded with pSPIONs (SI Figure 3). In contrast, caSPIONs altered neither the CAT activity in the MCF-10 A cells nor the GPx activities in the MCF-7 and A549 cells (Figure 3D). The CAT activities in MCF-7, A549 cells and HUVECs, loaded with caSPIONs, were increased by 10 to 40 %, whereas the GPx activities of the healthy cells reached values of 110 and 120 % (Figure 3D). These results demonstrate the rather low impact of caSPIONs on the cell viability, the ROS formation and activity of the ROS-degrading enzymes.
Interactions between X-rays and intracellular pSPIONs and caSPIONs were examined by exposing the SPION-loaded MCF-7, A549, MCF-10 A cells and HUVECs to single X-ray doses of 1 Gy which was followed by ROS detection and enzyme activity assays. The X-ray induced changes of the ROS formation and ROS-degrading enzyme activities in SPION-loaded cells are presented in figure 4. Particularly striking are the largely increased HO. levels in the cancerous MCF-7 (225 %) and A549 (224 %) cells when containing pristine SPIONs (figure 4(A)). The relative HO. concentration in the HUVECs and MCF-10 A cells were moderately elevated by 35 and 65 %, respectively (figure 4(A)). The citrate-coated SPIONs similarly elevated the HO. formation in X-ray irradiated MCF-7 and A549 cells, but they altered the HO. level in the healthy cells to a less extent (Figure 4B). The O2.- production in the X-ray treated cancer cells was significantly reduced in the presence of pristine and citrate-coated SPIONs (70 - 80%), which is ascribed to the enhanced SOD activities (120 - 150 %) (Figure 4C). SOD catalyzes the reaction of O2.- to H2O2. However, the relative H2O2 concentration was only slightly enhanced in A549 cells loaded with pristine SPIONs (by 20%) and in MCF-10 A cells containing citrate-coated coated SPIONs (by 25 %). On the other hand, the pristine SPIONs in the non-cancerous HUVECs and MCF-10 A cells increased the O2.- production (by 15 - 30%), and the O2.- level in citrate-coated SPION loaded HUVECs was raised to 120 %. The activities of the H2O2 degrading enzymes (CAT and GPx) in the cancer cells were observed to be significantly reduced by 40 to 70 % (Figure 4D). This is in contrast to the impact of the citrate-coated SPIONs on non-irradiated cells (Figure 3D). The decrease of the CAT and GPx activities is somewhat smaller in the HUVECs and MCF-10 A cells loaded with pristine SPION, whereas citrate-coated SPIONs boosted the CAT activity in HUVECs by 75 % and the GPx activity in MCF-10 A cells by 70 % (Figure 4D).
Concerted effectiveness of X-radiation and the SPIONs on the survival and proliferation of the cancerous and non-cancerous cell lines were investigated by performing clonogenic cell survival assays on X-ray treated cells without and with internalized SPIONs (Si figure 4, figures 5(A) and (B)). Figure 4 (SI) represents the survival curves of the MCF-7, A549, MCF-10 A cells and HUVECs which were exposed to X-radiation with single doses of 1, 2, and 3 Gy. Apparently, the non-cancerous cells exhibited slightly slower decaying survival curves than the cancer cells. The surviving fraction at 3 Gy reached its largest value for the HUVECs (0.78), and its smallest value for the cancerous A549 cells (0.6). In comparison, the impact of pristine SPIONs on X-ray irradiated cells provided significantly steeper decays of all survival curves with values of the survival fraction at 3 Gy smaller than 0.3 (Figure 5A). On the other hand, citrate-coated SPIONs selectively enhanced the X-ray-induced destruction of the cancer cells which is reflected by the fast decays of the survival curves down to 0.3 at 3 Gy. The survival curves of the non-cancerous MCF-10 A cells and HUVECs, although containing also citrate-coated SPIONs, display nearly the same slow-decaying behavior as the respective unstained cells did (SI Figure 4). These results convincingly demonstrate that citrate-coated SPIONs enhanced the destructive impact of the X-rays on the tumor cells while saving the healthy cells. The dose modifying factor (DMF) was calculated from the survival curves by means of the ratio of the SPION-induced radiation dose divided by the control radiation dose at the 50 % surviving fraction. The DMF values obtained for the cells containing pristine SPIONs range between 0.345 (A549 cells) and 0.522 ((HUVECs) (Table 2). The DMF value of 0.266 for the MCF-7 cells was even smaller than that of the A549 cells.
Table 2. The dose modifying factors (DMF) calculated from the survival curves of the MCF-7, A549, HUVEC and MCF-10 A cells containing uncoated and citrate-coated SPIONs
|
DMF values |
MCF-7 |
A549 |
HUVEC |
MCF-10 A |
|
Uncoated SPIONs |
0.401 |
0.345 |
0.522 |
0.455 |
|
Citrate-coated SPIONs |
0.266 |
0.351 |
0.972 |
0.901 |
Discussion
In order to maintain the initial magnetite (Fe3O4) composition and thereupon, to achieve catalytically active surfaces, the pristine SPIONs were stored under nitrogen atmosphere. Citrate-coating was shown to do not only passivate and stabilize the SPION surface, but also provides good water dispersibility. These particular surface properties were ascertained from DLS and zeta potential measurements. The positively charged pristine SPIONs formed large agglomerates in water, whereas the negatively charged citrate-coated SPIONs exhibited a mean hydrodynamic diameter of 28 nm and excellent water dispersibility. The binding affinity of the pristine and citrate-coated SPIONs to proteins in biological media was investigated by exposing the SPIONs to aqueous solution containing BSA at a concentration of 1 mg/mL or 10 % FCS. The results obtained from DLS and zeta-potential measurements demonstrate that adsorption of BSA and FCS proteins to pristine SPIONs results into drastically increased mean hydrodynamic diameters, with 1484 nm (for BSA) and 1281 nm (FCS)). The initially positively charged, pristine SPIONs remained positively charged, but to a much lesser extent. At pH=7 BSA and the FCS proteins are negatively charged. Thus, the proteins are expected to bind through electrostatic interaction forces to the positively charged pristine SPIONs and their agglomerates and thereupon, should mediate the formation of even larger agglomerates. On the other hand, BSA was also observed to form a protein corona around the negatively charged, citrate-coated SPIONs as being suggested by the largely increased values of the mean hydrodynamic diameter and zeta potential being 255 nm and -3.9 mV (Table 1B). The adsorption mechanism for negatively charged proteins on negatively charged, citrate-coated nanoparticle surfaces is rather complex and involves at least the unfolding of the tertiary and even secondary structure of the protein during simultaneous displacement of the citrate ligands [33, 34]. Furthermore, BSA as possessing 60 surface lysine groups may electrostatically interact with the negatively citrate ligands of the SPIONs. The protein unfolding promotes the formation of multilayers of proteins interacting through hydrophobic groups, which explains the large mean hydrodynamic diameter of the BSA-SPION complex. In contrast, the mean hydrodynamic diameter of the citrate-coated SPIONs after being incubated with FCS increased to 32 nm, only, and the change of the zeta-potential value is also very small (-20.7 mV). These results indicate less efficient protein adsorption on the surfaces of citrate-coated SPIONs. The protein corona defines the biological identity of nanoparticles as directly interacting with cell membrane receptors and thereupon, activating the cells uptake machinery. The positively charged pristine SPIONs were ingested by the cancerous (MCF-7 and A549) and non-cancerous (MCF-10 A and HUVEC) cells to a considerably higher extent than the citrate-coated SPIONs. These results correlate well the findings reported by Safi et al [27]. who verified the preferential cellular intake of agglomerated protein-nanoparticles complexes in comparison with well dispersed nanoparticles without protein corona. These results are in line with the cell-viability studies on the SPION-loaded tumor and healthy cells which demonstrate that citrate-coated SPIONs are biocompatible, whereas the pristine SPIONs degraded the viability of the HUVECs and MCF-10 A cells by ca. 50 % and that of the MCF-7 and A549 cells by ca. 30 %. Another reason for the cytotoxicity of the pristine SPIONs arises from their reactive surfaces which catalyze the formation of the highly toxic HO. via the Fenton reaction: Fe2+ + H2O2 → Fe3+ + HO. + OH- . (2) In addition, the Fe3+ cations in the SPION surface undergo with O2.- the Haber-Weiss reaction: Fe3+ + O2.- → Fe2+ + O2
which regenerates the Fe2+ cations in the surface. The X-ray enhancing impact of the pristine and citrate-coated SPIONs on tumor and healthy cells was surveyed by quantifying the SPION-induced changes of the ROS production and activities of the O2.- and H2O2 degrading enzymes (SOD, CAT and GPx). Therefor the cells were either exposed to X-radiation with a single dose of 1 Gy or were left non-irradiated. For the sake of comparison, the H2O2 level and relevant enzymatic activities in the unstained, non-irradiated cells were examined. As being characteristic for cancer cells, the MCF-7 and A549 cells exhibited a high H2O2 level and relatively small CAT and even less GPx activities [35-37]. In contrast, the H2O2 concentration in the non-cancerous cells is much smaller (by 170 to 250 %) than that in the cancer cells which matches the significantly enhanced CAT (in HUVECs) and GPx activity (in MCF-10 A). The pristine SPIONs were observed to increase the formation of the HO., O2.- and H2O2 in non-irradiated cancerous and non-cancerous cells, whereas the citrate-coated SPIONs considerably elevated the H2O2 level in MCF-7 and A549 cells, only. The respective SPION-triggered decreases of the CAT and GPx activities in all cell lines nicely correlate with the rise of the production of H2O2 and HO.. In contrast, both, the SOD activity and the O2.- formation were boosted. These results are explained with the positive surface charges of the pristine SPIONs which abet the formation of electrostatic binding to the negatively charged membranes of cell organelles. The SPIONs, on being adsorbed to the mitochondria, may cause depolarization of the membrane potential which induces electron release from the respiratory chain and thereupon, provides the formation of O2.-. The overproduction of O2.- is obviously responsible for the increased SOD activity in cells loaded with pristine SPIONs. The SOD catalyzed degradation of O2.- to H2O2 made a substantial contribution to the observed elevated H2O2 levels in all cell lines. Since the H2O2 degrading enzymes (CAT and GPx) exhibited relatively low activities in the tumor cells, the SPION surfaces catalyzed the reaction of excess H2O2 to the powerful oxidant HO. (eq.(2)). In contrast, the higher activities of CAT in HUVECs and GPx in MCF-10 A cells are responsible for the H2O2 degradation. On the other hand, citrate coating of the SPIONs did not only provide negative surface charges but also passivated the surface. Citrate-coated SPIONs only considerably increased the H2O2 production in the MCF-7 and A549 cells. The O2.- level was just moderately elevated in the A549 cells, and the HO. formation was slightly altered in all cell lines. Only the A549 cells exhibited significant increases of the CAT and SOD activities. The relatively small changes in the formation of the ROS as including the highly reactive HO. refer to the inactivity and biocompatibility of the citrate-coated SPIONs. These results corroborate those obtained from the cell viability studies.
The X-ray enhancing performance of the pristine and citrate-coated SPIONs in cancer cells was elucidated by quantifying the respective SPION-induced increases of the HO., O2.- and H2O2 concentrations in the MCF-7, A549, MCF-10 A cells and HUVECs which were exposed before to a single X-ray dose of 1 Gy. The interaction between the X-radiation and pristine SPIONs boosted the HO. formation in MCF-7 and A549 cells by 120-130 %. The HO. and O2.- levels in the HUVECs and MCF-10 A cells were elevated by 40 – 65 % and 15 – 30 %, respectively. These results establish that X-ray irradiation of the SPION-loaded cells, even at a single dose of 1 Gy, caused further activation of the initially reactive surfaces of the pristine SPIONs. On the other hand, the citrate-coated SPIONs selectively enhanced the concentration of the powerful oxidant HO. in the cancer cells. For the citrate-coated SPIONs the impact of the X-rays consists in the activation of the SPION surfaces by ablating the passivation layer and thereupon, creating freely accessible Fe2+ cations which catalyze the Fenton reaction of H2O2 to HO. (eq. (2)). The largely increased SOD activities in the X-ray irradiated MCF-7 and A549 cells are associated with the dismutation of the O2.- to H2O2 which is consistent with the decreased O2.- level. There are two obvious reasons for the small increases of the SPION-induced HO. formation in the healthy cells, HUVECs and MCF-10 A cells. The concentrations of the citrate-coated SPIONs internalized by HUVECs and MCF-10 A cells are 25 – 50 % of those in the cancer cells. In addition, the HUVECs exhibited a significantly enhanced CAT activity, and the GPx activity of the MCF-10 A cells showed a similar rise. Both, CAT and GPx efficiently catalyze the decomposition of H2O2 and thereupon, impeded the SPION surface catalyzed reaction of H2O2 to HO.. The cooperative effect of X-rays and the SPIONs on the survival and proliferation of the MCF-7, A549, MCF-10 A cells and HUVECs was quantified by performing clonogenic cell survival assays at single X-ray doses of 1, 2, and 3 Gy. The impact of pristine SPIONs on X-ray irradiated cells led to steeply sloping survival curves. The fast-decaying survival curves recorded for the MCF-7 and A549 cells containing the citrate-coated SPIONs equally demonstrate the SPION-triggered enhancement of the X-ray-induced elimination of the cancer cells. In contrast, the healthy MCF-10 A cells and HUVECs, although loaded with citrate-coated SPIONs, display a slow-decaying behavior. These results convincingly demonstrate that citrate-coated SPIONs enhance the destructive impact of the X-rays on the tumor cells while sparing the healthy cells. The DMF values obtained for the cells containing pristine SPIONs range between 0.345 (A549 cells) and 0.522 (HUVECs). By comparison, the destructive effect of the citrate-coated SPIONs on X-ray irradiated MCF-7 cells is even larger as being reflected by the smaller DMF value with 0.266. The DMF value for the A549 cells is 0.351, whereas in case of the healthy HUVECs and MCF-10 A cells the DMF values were 0.972 and 0.901, respectively. In contrast to the pristine SPIONs the citrated coated ones selectively boost the X-ray-induced eradication of cancer cells, while sparing the healthy cells. All these results corroborate the eligibility and performance of the citrate-coated SPIONs as outstanding X-radiation dose enhancing agents for radiocancer therapy.
Acknowledgements
We thank Andrea Hilpert for the TEM studies (Department of Anatomy, Chair of Anatomy I, University of Erlangen). Furthermore, we are grateful to Tobias Weißenberger for conducting so diligently the ICP-AES experiments on our samples (Prof. Dr. Peter Wasserscheid, Institute of Chemical Reaction Technique, University of Erlangen). This research did not receive any specific grant for funding agencies in the public, commercial or not-for-profit sectors.
Funding
None.
Conflicts of interest
The authors declare that no conflicts of interest are present
Abbreviations
ROS (reactive oxygen species), SPION (superparamagnetic iron oxide nanoparticle), pSPION (uncoated SPION), caSPION (citrate-coated SPION), SOD (superoxide dismutase), CAT (catalase), GPx (glutathione peroxidase), BSA (bovine serum albumin), FCS (fetal calf serum).
Article Info
Article Type
Research ArticlePublication history
Received: Fri 22, Mar 2019Accepted: Mon 08, Apr 2019
Published: Mon 22, Jul 2019
Copyright
© 2023 Carola Kryschi. This is an open-access article distributed under the terms of the Creative Commons Attribution License, which permits unrestricted use, distribution, and reproduction in any medium, provided the original author and source are credited. Hosting by Science Repository.DOI: 10.31487/j.RDI.2019.02.03
Author Info
Corresponding Author
Carola KryschiDepartment Chemistry and Pharmacy, Physical Chemistry I and ICMM, Friedrich-Alexander University of Erlangen, Egerlandstr.3, 91058 Erlangen, Germany
Figures & Tables
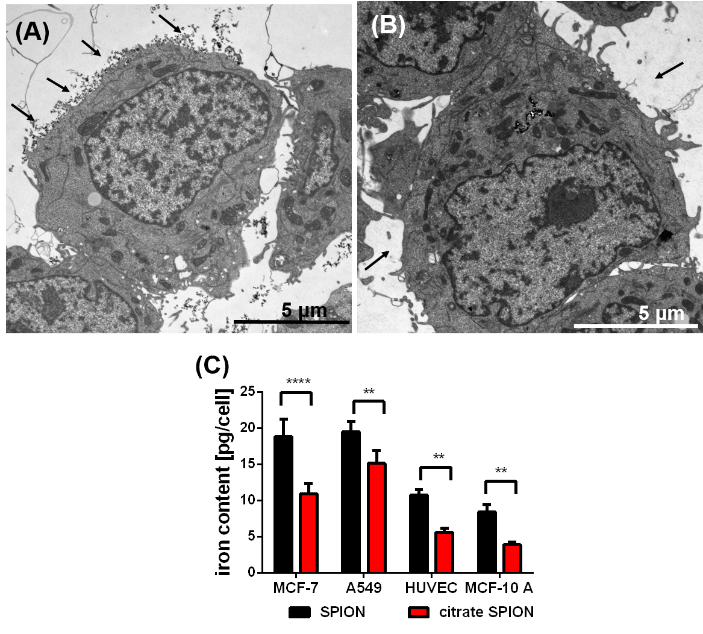
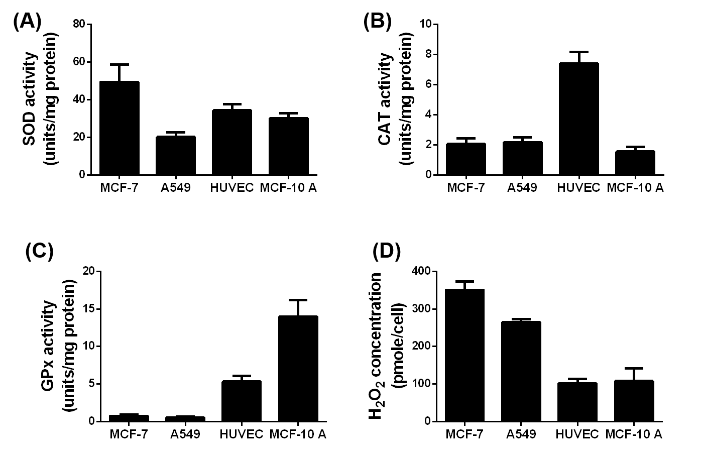
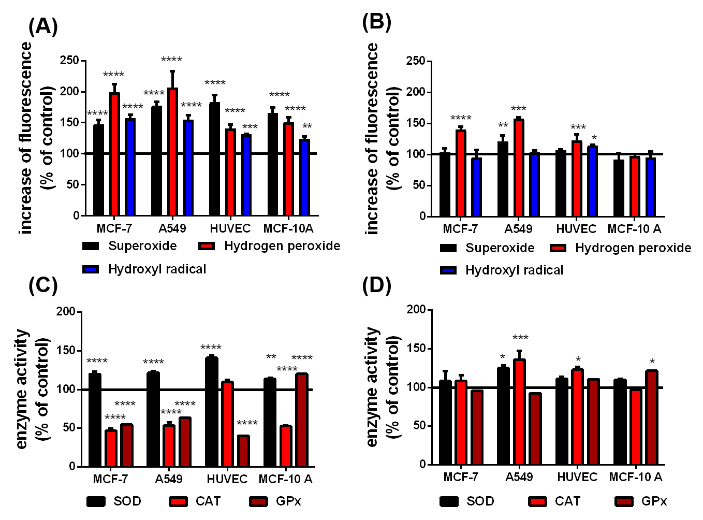
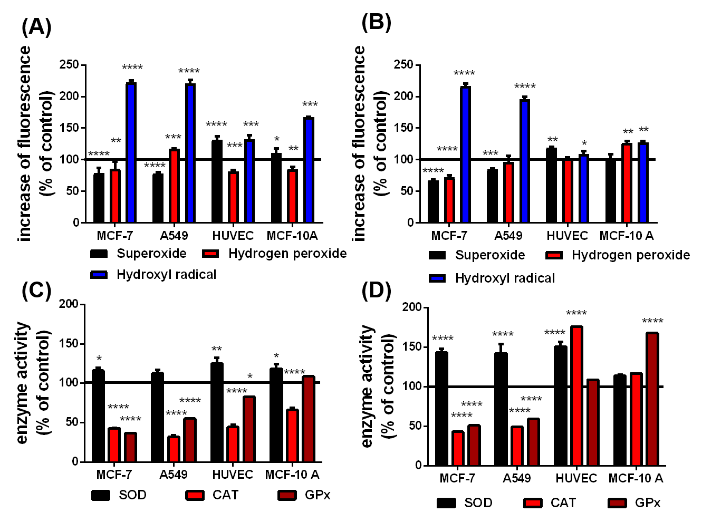
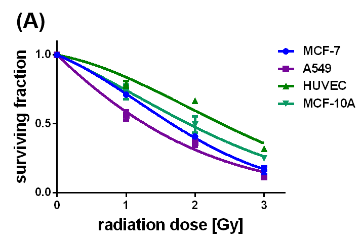
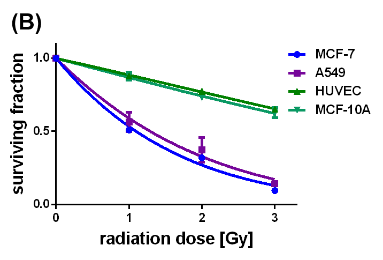
Table 1. Zeta potential values and hydrodynamic diameter of uncoated SPIONs (A) and citrate coated SPIONS (B) in water and after adding either bovine serum albumin (BSA) or fetal calf serum (FCS).
(A)
|
Uncoated SPIONs |
water |
Water + BSA (1 mg/mL) |
Water + 10 % FCS |
|
Molality of the proteins adsorbed on SPIONs [μg/mg SPIONs] |
------- |
161.53 ± 6.71 |
184.31 ± 9.06 |
|
hydrodynamic diameter [nm] |
164.2 ± 45 |
1484 ± 30 |
1281 ± 154 |
|
zeta potential [mV] |
+ 14 ± 1.82 |
+ 1.21 ± 0.499 |
-1,19 ± 0.203 |
(B)
|
Citrate coated SPIONs |
water |
Water + BSA (1 mg/mL) |
Water + 10 % FCS |
|
Molality of the proteins adsorbed on SPIONs [μg/mg SPIONs] |
--------- |
71.25 ± 6.69 |
35.14 ± 4.98 |
|
hydrodynamic diameter [nm] |
28 ± 4 |
255 ± 29 |
32 ± 6 |
|
zeta potential [mV] |
- 23.4 ± 0.611 |
-3.89 ± 0.544 |
-20.7 ± 0.720 |
Table 2. The dose modifying factors (DMF) calculated from the survival curves of the MCF-7, A549, HUVEC and MCF-10 A cells containing uncoated and citrate-coated SPIONs
|
DMF values |
MCF-7 |
A549 |
HUVEC |
MCF-10 A |
|
Uncoated SPIONs |
0.401 |
0.345 |
0.522 |
0.455 |
|
Citrate-coated SPIONs |
0.266 |
0.351 |
0.972 |
0.901 |
References
- Dhawan V (2014) Reactive Oxygen and Nitrogen Species: General Considerations: In: Saha GK, Jindal SK, Biswal S, Barnes PJ, editors. Studies of Respiratory Disorders 1st ed. New York, Humana Press, Springer Science+Business Media p. 27-47.
- Trachootham D, Alexandre J, Huang P (2009) Targeting cancer cells by ROS-mediated mechanisms: a radical therapeutic approach? Nat Rev Drug Discov 8: 579-591. [Crossref]
- Nishikawa M (2008) Reactive oxygen species in tumor metastasis. Cancer Lett 266: 53-59. [Crossref]
- Weidinger A, Kozlov AV (2015) Biological Activities of Reactive Oxygen and Nitrogen Species: Oxidative Stress versus Signal Transduction. Biomolecules 5: 472-484. [Crossref]
- Ivanova D, Bakalova R, Lazarova D, Gadjeva V, Zhelev Z (2013) The Impact of Reactive Oxygen Species on Anticancer Therapeutic Strategies. Adv Clin Exp Med 22: 899-908. [Crossref]
- Babior BM (2004) NADPH oxidase. Curr Opin Immunol 16: 42-47. [Crossref]
- Pritsos AC (2000) Cellular distribution, metabolism and regulation of the xanthine oxidoreductase enzyme system. Chem-Biol Interact 129: 195-208. [Crossref]
- Oberley TD, Oberley LW (1997) Antioxidant enzyme levels in cancer. Histol Histopathol 12: 525-535. [Crossref]
- Gibellini L, Pinti M, Nasi M, De Biasi S, Roat E et al. (2010) Interfering with ROS Metabolism in Cancer Cells: The Potential Role of Quercetin. Cancers 2: 1288-1311. [Crossref]
- Schumacker PT (2006) Reactive oxygen species in cancer cells: Live by the sword, die by the sword. Cancer Cell 10: 175-176. [Crossref]
- Benhar M, Engelberg D, Levitzki A (2002) ROS, stress-activated kinases and stress signaling in cancer. EMBO Rep 3: 420-425. [Crossref]
- Mates JM (2000) Effects of antioxidant enzymes in the molecular control of reactive oxygen species toxicology. Toxicology 153: 83-104. [Crossref]
- Miran Jang, Sung soo Kim, Jinhwa Lee (2013) Cancer cell metabolism: implications for therapeutic targets. Exp Mol Med 45: e45. [Crossref]
- Kaynar H, Meral M, Turhan H, Keles M, Celik G et al. (2005) Glutathione peroxidase, glutathione-S-transferase, catalase, xanthine oxidase, Cu-Zn superoxide dismutase activities, total glutathione, nitric oxide, and malondialdehyde levels in erythrocytes of patients with small cell and non-small cell lung cancer. Cancer Lett 227: 133-139. [Crossref]
- Riley PA (1994) Free radicals in biology: oxidative stress and the effects of ionizing radiation. Int J Radiat Biol 65: 27-33. [Crossref]
- Hubenak JR, Zhang Q, Branch CD, Kronowitz SJ (2014) Mechanisms of injury to normal tissue after radiotherapy: a review. Plast Reconstr Surg 133: 49e-56e. [Crossref]
- Agrawal A, Choudhary D, Upreti M, Rath PC, Kale RK (2001) Radiation induced oxidative stress: I Studies in Ehrlich solid tumor in mice. Mol Cell Biochem 223: 71-80. [Crossref]
- Kwatra D, Venugopal A, Anant S (2013) Nanoparticles in radiation therapy: a summary of various approaches to enhance radiosensitization. Transl Cancer Res 2: 330-342.
- Paul Retif, Sophie Pinel, Magali Toussaint, Celine Frochot, Rima Chouikrat et al. (2015) Nanoparticles for Radiation Therapy Enhancement: the key parameters. Theranostics 5: 1030-1044. [Crossref]
- Klein S, Sommer A, Distel LV, Neuhuber W, Kryschi C, Superparamagnetic iron oxide nanoparticles as radiosensitizer via enhanced reactive oxygen opecies formation. Biochem Biophys Res Commun 61: 393-397. [Crossref]
- Klein S, Sommer A, Distel LV, Hazemann JL, Kröner W et al. (2014) Superparamagnetic iron oxide nanoparticles as novel X-ray enhancer for low-dose radiation therapy. J Phys Chem B 118: 6159-6166. [Crossref]
- Klein S, Kizaloğlu M, Portilla L, Park H, Rejek T, Hümmer J et al. (2018) Enhanced in Vitro Biocompatibility and Water Dispersibility of Magnetite and Cobalt Ferrite Nanoparticles Employed as ROS Formation Enhancer in Radiation Cancer Therapy. Small 14: e1704111. [Crossref]
- Mahmoudi M, Sant S, Wang B, Laurent S, Sen T (2011) Superparamagnetic iron oxide nanoparticles (SPIONs): development, surface modification and applications in chemotherapy. Adv Drug Deliv Rev 63: 24-46. [Crossref]
- Reddy LH, Arias JL, Nicolas J, Couvreur P (2012) Magnetic nanoparticles: design and characterization, toxicity and biocompatibility, pharmaceutical and biomedical applications. Chem Rev 112: 5818-5878. [Crossref]
- Shang L, Nienhaus K, Nienhaus GU (2014) Engineered nanoparticles interacting with cells: size matters. J Nanobiotechnology 12: 5. [Crossref]
- Treuel L, Nienhaus GU (2012) Toward a molecular understanding of nanoparticle-protein interactions. Biophys Rev 4: 137-147. [Crossref]
- Safi M, Courtois J, Seigneuret M, Conjeaud H, Berret JF (2011) The effects of aggregation and protein corona on the cellular internalization of iron oxide nanoparticles. Biomaterials 32: 9353-9363. [Crossref]
- Massart R (1981) Preparation of aqueous magnetic liquids in alkaline and acidic media. IEEE Trans Magn 17: 1247-1248.
- Patil S, Sandberg A, Heckert E, Self W, Seal S (2007) Protein adsorption and cellular uptake of cerium oxide nanoparticles as a function of zeta potential. Biomaterials 28: 4600-4607. [Crossref]
- Marklund S, Marklund G (1974) Involvement of the superoxide anion radical in the autoxidation of pyrogallol and a convenient assay for superoxide dismutase. Eur J Biochem 47: 469-474. [Crossref]
- Rahman I, Kode A, Biswas KS (2006) Assay for quantitative determination of glutathione and glutathione disulfide levels using enzymatic recycling method. Nat Protoc 1: 3159-3165. [Crossref]
- Fanken NA, Rodermond HM, Stap J, Haveman J, van Bree C (2006) Clonogenic assay of cells in vitro. Nat Protoc 5: 2315-2319. [Crossref]
- Brewer SH, Glomm WR, Johnson MC, MaKnag MK, Franzen S (2005) Probing BSA binding to citrate-coated gold nanoparticles and surfaces. Langmuir 21: 9303-9307. [Crossref]
- Saptarshi SR, Duschl A, Lopata AL (2013) Interaction of nanoparticles with proteins: relation to bio-reactivity of the nanoparticle. J Nanobiotechnol 11: 26. [Crossref]
- Ray G, Batra S, Shukla NK, Deo S, Raina V (2000) Lipid peroxidation, free radical production and antioxidant status in breast cancer. Breast Cancer Res Treat 59: 163-170. [Crossref]
- Skrzydlewska E, Stankiewicz A, Sulkowska M, Sulkowski S, Kasacka I (2001) Antioxidant status and lipid peroxidation in colorectal cancer. J Toxicol Environ Health A 64: 213-222. [Crossref]
- Oltra AM, Carbonell F, Tormos C, Iradi A, Sáez GT (2001) Antioxidant enzyme activities and the production of MDA and 8-oxo-dG in chronic lymphocytic leukemia. Free Radic Biol Med 30: 1286-1292. [Crossref]