Quantitative Assessment of Iodine Intensity of Different Types of Lesions in the Low-Energy (LE) Images of Contrast-Enhanced Spectral Mammography (CESM)
A B S T R A C T
Purpose: To assess the iodine enhancement intensity of breast lesions in low energy (LE) images obtained in contrast-enhanced spectral mammography (CESM) with different tissue compositions.
Materials and Methods: A 50 mm dedicated phantom with different lesion insert and iodine insert were used to assess the enhancement intensity quantitatively. The target slab of the phantom consists of three lesions + iodine inserts together and 100% adipose equivalent,100% glandular equivalent inserts alone to mimic the adipose and glandular lesion without contrast-enhancement. Each iodine inserts having a concentration of 0.5 mgI/cm3, 1.0 mgI/cm3, 2.0 mgI/cm3. The phantom was exposed under semiautomated function at 28 kV, 30 kV, and 32 kV with Mo/Rh target/filter combination. Iodine intensity was estimated for three types of lesions at three breast equivalent compositions.
Results: Lesions with fatty tissue had high intensity while lesions with glandular tissues had the minimum intensity. Among fatty lesions, highest mean intensity value (0.972±0.003) observed with minimum iodine concentration (F + 0.5 mgI/cm3). The highest mean intensity value (0.882±0.001) was found related to the glandular lesion with maximum iodine concentration (G + 2.0 mgI/cm3). The one-way ANOVA statistical test confirmed that mean intensity values were significantly varied among different lesions (P < 0.05).
Conclusion: LE images obtained in CESM can be used to identify the different types of lesions without performing the full field digital mammography (FFDM) as an additional examination prior to the CESM procedure.
Keywords
Contrast-enhanced spectral mammography, low energy image, iodine intensity
Introduction
Contrast-enhancement spectral mammography (CESM) is a recently developed advanced technology in mammography to improve the identification of breast cancers [1-3]. Prior administration of intravenous contrast agent is required to obtain a pair of low-energy (LE) and high energy (HE) images [4]. Then, LE and HE images are combined to produce the final image which clearly demonstrates the lesion enhancement by eliminating the overlapping breast tissues in the background [5-7]. LE images provide the morphological information of the breast lesion as similar to the full-field digital mammography (FFDM) [7, 8]. HE images are only used for post-processing since they contain only iodine enhancement information [9]. CESM is more important in the diagnosis of breast cancers in dense breasts [10]. According to the previously published research, contrast-enhancement intensity is a reliable factor for differentiating benign and malignant lesions in the breast. And their results have concluded that contrast-enhancement intensity was usually stronger in malignant lesions than that of benign lesions [11-13].
Moreover, Luczynska et al. have proved that invasive carcinomas showed strong enhancement than non-invasive carcinomas and benign lesions [13]. Yakoumakis et al. concluded that LE imaging mainly contributes to the average glandular dose received from complete CESM procedure [14]. LE images are equivalent to the FFDM images [8]. Therefore, lesion morphology can be assessed by performing LE image instead of additional FFDM when patients with suspicious breast mass [15]. Hence additional radiation dose from standard FFDM can be minimized. Therefore, it is important to assess the contrast-enhancement intensity of different lesions in LE images. The aim of this study was to compare the degree of intensity according to different lesion types with different iodine concentrations in LE images and to establish the lesion type which can identify with high intensity in LE images.
Materials and Methods
The present study used a 50 mm dedicated phantom and MGU-1000D MAMMOREX pe.ru.ru digital mammography machine. The target slab of the phantom consists of three lesions + iodine inserts together and 100% adipose equivalent, 100% glandular equivalent inserts alone to mimic the adipose and glandular lesion without contrast-enhancement. Each iodine inserts having a concentration of 0.5 mgI/cm3 ,1.0 mgI/cm3,2.0 mgI/cm3. The phantom was exposed under semiautomated function at 28 kV, 30 kV, and 32 kV with Mo/Rh target/filter combination. Three phantom designs were created by using different lesion composition inserts per one tissue composition of the phantom (Table 1) and exposed at each selected peak tube voltages. Iodine intensity was estimated for three types of lesions in three breast equivalent compositions and all the exposure conditions. The intensity of the lesion of acquired images was obtained by using the tools available with the Fiji image J software platform. Lesion inserts of 10 mm in diameter have been selected as the region of interest (ROI) to assess the intensity. Intensity values obtained from each lesion type were normalized to background intensity. Mean glandular dose (MGD) was calculated using a Dance method to assess whether the MGD is varied according to different types of lesions [16].
Table 1: Details of patterns of the
phantom used for exposure.
|
Phantom composition |
Lesion pattern in the phantom |
||
|
100% adipose |
F + 0.5 mgI/cm3 |
G + 0.5 mgI/cm3 |
FG + 0.5 mgI/cm3 |
|
F + 1.0 mgI/cm3 |
G + 1.0 mgI/cm3 |
FG + 1.0 mgI/cm3 |
|
|
F + 2.0 mgI/cm3 |
G + 2.0 mgI/cm3 |
FG + 2.0 mgI/cm3 |
|
|
50% adipose- 50% fibroglandular |
F + 0.5 mgI/cm3 |
G + 0.5 mgI/cm3 |
FG + 0.5 mgI/cm3 |
|
F + 1.0 mgI/cm3 |
G + 1.0 mgI/cm3 |
FG + 1.0 mgI/cm3 |
|
|
F + 2.0 mgI/cm3 |
G + 2.0 mgI/cm3 |
FG + 2.0 mgI/cm3 |
|
|
100% fibroglandular |
F + 0.5 mgI/cm3 |
G + 0.5 mgI/cm3 |
FG + 0.5 mgI/cm3 |
|
F + 1.0 mgI/cm3 |
G + 1.0 mgI/cm3 |
FG + 1.0 mgI/cm3 |
|
|
F + 2.0 mgI/cm3 |
G + 2.0 mgI/cm3 |
FG + 2.0 mgI/cm3 |
|
**F: Fatty tissue lesion; G: Glandular tissue
lesion; FG: Fatty tissue + Glandular tissue lesion.
Results
I Quantitative Analysis of the Intensity of the Iodine in Different Lesion
The intensity of the lesion was calculated according to the below equation. Total mean intensity values for different types of lesions and mean intensity values according to breast equivalent compositions are summarized in (Tables 2 & 3).
\[Lesion\ intensity = \frac{Mean\ pixel\ value\ of\ the\ lesion\ (I)}{Mean\ pixel\ value\ of\ the\ back\ ground\ (B)}\]
Table 2: Total mean intensity values of the iodine in
different lesions.
|
Mean intensity |
|
|
F + 0.5 mgI/cm3 |
0.972 (±0.003) |
|
F + 1.0 mgI/cm3 |
0.963 (±0.006) |
|
F + 2.0 mgI/cm3 |
0.959 (±0.004) |
|
G + 0.5 mgI/cm3 |
0.895 (±0.009) |
|
G + 1.0 mgI/cm3 |
0.890 (±0.011) |
|
G + 2.0 mgI/cm3 |
0.882 (±0.001) |
|
FG + 0.5 mgI/cm3 |
0.939 (±0.006) |
|
FG + 1.0 mgI/cm3 |
0.933 (±0.009) |
|
FG + 2.0 mgI/cm3 |
0.926 (±0.007) |
Table 3 Mean intensity values of the
iodine in different lesions in three different breast equivalent phantom.
|
Lesion pattern in the phantom |
Tissue composition of the phantom |
||
|
100% adipose |
50%adipose-50%glandular |
100% glandular |
|
|
F + 0.5 mgI/cm3 |
0.970(±0.002) |
0.972(±0.005) |
0.974(±0.003) |
|
F + 1.0 mgI/cm3 |
0.958(±0.003) |
0.962(±0.002) |
0.973(±0.007) |
|
F + 2.0 mgI/cm3 |
0.956(±0.003) |
0.958(±0.004) |
0.964(±0.004) |
|
G + 0.5 mgI/cm3 |
0.889(±0.007) |
0.894(±0.007) |
0.905(±0.006) |
|
G + 1.0 mgI/cm3 |
0.882(±0.007) |
0.887(±0.007) |
0.906(±0.006) |
|
G + 2.0 mgI/cm3 |
0.877(±0.008) |
0.881(±0.009) |
0.895(±0.006) |
|
FG + 0.5 mgI/cm3 |
0.934(±0.004) |
0.939(±0.005) |
0.944(±0.004) |
|
FG + 1.0 mgI/cm3 |
0.928(±0.004) |
0.930(±0.004) |
0.946(±0.003) |
|
FG + 2.0 mgI/cm3 |
0.921(±0.005) |
0.925(±0.006) |
0.933(±0.004) |
II Statistical Analysis
The one-way ANOVA statistical test was performed to determine whether there are significant differences between the mean intensity values of iodine in different lesions and to determine that mean intensity values of iodine in the same lesion have significant differences among different breast tissue equivalent composition of the phantom. Results confirmed the significant difference among the mean intensity values of iodine in different lesions (P<0.05) (Figure 1). And it has not been changed with the varying iodine concentration in the lesion. The mean iodine intensity of F + 1.0 mgI/cm3, G + 1.0 mgI/cm3 and FG + 1.0 mgI/cm3 lesions has shown a significant difference between 100% adipose and 100% glandular equivalent phantom and 50% adipose-50% glandular and 100% glandular equivalent phantom (P<0.05) while not significant between the 100% adipose and 50% adipose -50% glandular equivalent phantom (Figure 2). The mean intensity of iodine concentration of 0.5 mgI/cm3 and 2.0 mgI/cm3 in different mass compositions not significantly varied according to the different tissue compositions of the phantom.
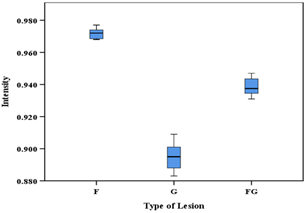
Figure 1: Box-whisker plot of iodine intensity values of different types of lesions by tissue composition. Boxes are not overlapping; hence intensity values are significantly varied among three lesion groups. The graph has been plotted for lesions with minimum iodine concentration (0.5 mgI/cm3).

Figure 2: Box-whisker plot of iodine intensity values of different types of lesions in the varying composition of breast equivalent phantom. The intensity of all types of lesions was highest in the 100% glandular phantom. The graph has plotted for lesions with 1.0 mgI/cm3 iodine concentration.
III Assessment of Mean Glandular Dose (MGD)
MGD values were not significantly changed according to lesion patterns. It was varied only with the amount of glandularity of the phantom. Mean MGD values are summarized in (Table 4).
Table 4: Summary of the mean MGD values
of the phantom with different composition.
|
Composition of the phantom |
Mean MGD (mGy) |
|
100% adipose |
1.35 ± 0.17 |
|
50% adipose - 50% fibroglandular |
1.53 ± 0.19 |
|
100% glandular |
1.75 ± 0.21 |
Discussion
CESM is a superior imaging tool to non-contrast conventional mammography in the detection of breast lesions [17]. Since LE image of CESM can avoid the performing of FFDM prior to the start of the CESM procedure, it can be used to provide diagnostic information regarding the lesion. Therefore, the present study quantitatively assessed the intensity of iodine in lesions with different tissue compositions in order to determine the enhancement variation according to iodine concentration in different types of lesions. According to Li, et al., mammographic texture analysis is a well-founded technique for distinguishing between benign and malignant breast tumors [18]. Therefore, pixel value or intensity is one of the reliable features for differential diagnosis of benign and malignant tumors. The present study, therefore, compared the effect of the intensity of iodine in the differentiation of lesions according to its composition. The study found that iodine in the fatty tissue mass has the highest intensity than the glandular and fatty tissue + glandular tissue lesions. The minimum mean intensity value of iodine was observed with glandular lesions (Table 2, Figure 3).

Figure 3: Intensity of iodine in different lesions versus iodine concentration.
Therefore, contrast-enhanced fatty tissue lesions are well visualized in LE images. LE images acquire by using low-energy X-rays just below the k-edge of iodine (Approximately 33 keV) [19]. Since LE imaging is less X-ray absorbed, LE images are not mainly used to visualize the contrast-enhancement information. Hence the visual appearance of the iodine is dependent on the X-ray absorption properties in two acquisitions, and it is identical to two acquisitions. According to (Figure 3) intensity of iodine decreases with increased concentration of iodine for three types of lesions. When the amount of glandular tissues within the lesion increased mean intensity value further decreased. It could be due to decreasing of X-ray absorption by the high concentration of iodine and glandular tissues at low energies. The present study confirmed that a low concentration of iodine in lesions provides better visualization in LE images. Although there were no previously published similar results to compare with the present study, few studies are investigated the clinical images to assess the contrast-enhancement intensity and pattern in the differential diagnosis of breast lesions in dual-energy contrast-enhanced spectral mammography [20, 21].
Published results concluded that contrast-enhancement intensity and pattern allow more accurate evaluation of breast lesions in CESM. This conclusion is comparable with the present study findings that lesion intensity values were significantly different according to the tissue composition of the lesion. Rudniki et al. also compare the mean intensity value of the lesion quantitatively to differentiate the lesions as the present study [11]. Moreover, the present study results confirmed that the contrast intensity of different lesions do not significantly change with the composition of the breast except at an iodine concentration of 1.0 mgI/cm3 (Figure 2). Lesions that are having 1.0 mgI/cm3 iodine demonstrate a significant difference in mean intensity value among 100% adipose and 100% fibroglandular tissue equivalent phantom and 50% adipose-50% glandular - 100% glandular phantom (Figure 2). The calculated MGD values were almost consistent with the varying lesions and iodine contrast. But it was significantly changed with the percentage of glandularity in the phantom for the same thickness (Table 4). This present study recommended that the evaluation of enhancement intensity of the recombine image parallel to LE image intensity evaluation to confirm the optimum iodine concentration required to produce adequate intensity in recombining image and this will be considered in the future research study.
Conclusion
Contrast-enhancement intensity on LE images has relevance to the tissue composition of the lesion, and it is good at identifying different lesions without performing additional FFDM examination prior to the CESM procedure. Hence it will lead to reduce the additional radiation dose to the patient already referred to as suspicious of breast mass. Furthermore, present study found that less iodine concentration is required to make a considerable difference of intensity among different types of lesions in LE images.
Conflicts of Interest
None.
Abbreviation
LE: Low Energy
CESM: Contrast-Enhanced Spectral Mammography
FFDM: Full Field Digital Mammography
Article Info
Article Type
Research ArticlePublication history
Received: Thu 18, Nov 2021Accepted: Sat 04, Dec 2021
Published: Tue 21, Dec 2021
Copyright
© 2023 Sachila Niroshani. This is an open-access article distributed under the terms of the Creative Commons Attribution License, which permits unrestricted use, distribution, and reproduction in any medium, provided the original author and source are credited. Hosting by Science Repository.DOI: 10.31487/j.RDI.2021.02.01
Figures & Tables
Table 1: Details of patterns of the
phantom used for exposure.
|
Phantom composition |
Lesion pattern in the phantom |
||
|
100% adipose |
F + 0.5 mgI/cm3 |
G + 0.5 mgI/cm3 |
FG + 0.5 mgI/cm3 |
|
F + 1.0 mgI/cm3 |
G + 1.0 mgI/cm3 |
FG + 1.0 mgI/cm3 |
|
|
F + 2.0 mgI/cm3 |
G + 2.0 mgI/cm3 |
FG + 2.0 mgI/cm3 |
|
|
50% adipose- 50% fibroglandular |
F + 0.5 mgI/cm3 |
G + 0.5 mgI/cm3 |
FG + 0.5 mgI/cm3 |
|
F + 1.0 mgI/cm3 |
G + 1.0 mgI/cm3 |
FG + 1.0 mgI/cm3 |
|
|
F + 2.0 mgI/cm3 |
G + 2.0 mgI/cm3 |
FG + 2.0 mgI/cm3 |
|
|
100% fibroglandular |
F + 0.5 mgI/cm3 |
G + 0.5 mgI/cm3 |
FG + 0.5 mgI/cm3 |
|
F + 1.0 mgI/cm3 |
G + 1.0 mgI/cm3 |
FG + 1.0 mgI/cm3 |
|
|
F + 2.0 mgI/cm3 |
G + 2.0 mgI/cm3 |
FG + 2.0 mgI/cm3 |
|
**F: Fatty tissue lesion; G: Glandular tissue
lesion; FG: Fatty tissue + Glandular tissue lesion.
Table 2: Total mean intensity values of the iodine in
different lesions.
|
Mean intensity |
|
|
F + 0.5 mgI/cm3 |
0.972 (±0.003) |
|
F + 1.0 mgI/cm3 |
0.963 (±0.006) |
|
F + 2.0 mgI/cm3 |
0.959 (±0.004) |
|
G + 0.5 mgI/cm3 |
0.895 (±0.009) |
|
G + 1.0 mgI/cm3 |
0.890 (±0.011) |
|
G + 2.0 mgI/cm3 |
0.882 (±0.001) |
|
FG + 0.5 mgI/cm3 |
0.939 (±0.006) |
|
FG + 1.0 mgI/cm3 |
0.933 (±0.009) |
|
FG + 2.0 mgI/cm3 |
0.926 (±0.007) |
Table 3 Mean intensity values of the
iodine in different lesions in three different breast equivalent phantom.
|
Lesion pattern in the phantom |
Tissue composition of the phantom |
||
|
100% adipose |
50%adipose-50%glandular |
100% glandular |
|
|
F + 0.5 mgI/cm3 |
0.970(±0.002) |
0.972(±0.005) |
0.974(±0.003) |
|
F + 1.0 mgI/cm3 |
0.958(±0.003) |
0.962(±0.002) |
0.973(±0.007) |
|
F + 2.0 mgI/cm3 |
0.956(±0.003) |
0.958(±0.004) |
0.964(±0.004) |
|
G + 0.5 mgI/cm3 |
0.889(±0.007) |
0.894(±0.007) |
0.905(±0.006) |
|
G + 1.0 mgI/cm3 |
0.882(±0.007) |
0.887(±0.007) |
0.906(±0.006) |
|
G + 2.0 mgI/cm3 |
0.877(±0.008) |
0.881(±0.009) |
0.895(±0.006) |
|
FG + 0.5 mgI/cm3 |
0.934(±0.004) |
0.939(±0.005) |
0.944(±0.004) |
|
FG + 1.0 mgI/cm3 |
0.928(±0.004) |
0.930(±0.004) |
0.946(±0.003) |
|
FG + 2.0 mgI/cm3 |
0.921(±0.005) |
0.925(±0.006) |
0.933(±0.004) |
Table 4: Summary of the mean MGD values
of the phantom with different composition.
|
Composition of the phantom |
Mean MGD (mGy) |
|
100% adipose |
1.35 ± 0.17 |
|
50% adipose - 50% fibroglandular |
1.53 ± 0.19 |
|
100% glandular |
1.75 ± 0.21 |
References
1.
Diekmann F, Freyer M,
Diekmann S, Fallenberg EM, Fischer T et al. (2011) Evaluation of
contrast-enhanced digital mammography. Eur J Radiol 78: 112-121. [Crossref]
2.
Dromain C, Thibault F,
Muller S, Rimareix F, Delaloge S et al. (2011) Dual-energy contrast-enhanced
digital mammography: initial clinical results. Eur Radiol 21: 565-574. [Crossref]
3.
Luczyńska E, Heinze
Paluchowska S, Dyczek S, Blecharz P, Rys J et al. (2014) Contrast-enhanced
spectral mammography: comparison with conventional mammography and
histopathology in 152 women. Korean J Radiol 15: 689-696. [Crossref]
4.
Puong
S, Bouchevreau X, Patoureaux F, Iordache R, Muller S (2007) Dual-energy
contrast enhanced digital mammography using a new approach for breast tissue canceling.
Phys Med Imag 65102.
5.
Dromain C, Balleyguier
C, Muller S, Mathieu MC, Rochard F et al. (2006) Evaluation of tumor
angiogenesis of breast carcinoma using contrast-enhanced digital mammography. AJR
Am J Roentgenol 187: W528-W537. [Crossref]
6.
Lewin
JM, Isaacs PK, Vance V, Larke FJ (2003) Dual-energy contrast-enhanced digital
subtraction mammography: feasibility. Radiology 229: 261-268. [Crossref]
7.
Dromain
C, Canale S, Saab Puong S, Carton AK, Muller S et al. (2014) Optimization of
contrast-enhanced spectral mammography depending on clinical indication. J
Med Imaging (Bellingham) 1: 033506. [Crossref]
8.
Francescone MA,
Jochelson MS, Dershaw DD, Sung JS, Hughes MC et al. (2014) Low energy mammogram
obtained in contrast-enhanced digital mammography (CEDM) is comparable to
routine full-field digital mammography (FFDM). Eur J Radiol 83:
1350-1355. [Crossref]
9.
Dromain C, Balleyguier
C, Adler G, Garbay JR, Delaloge S (2009) Contrast-enhanced digital mammography. Eur J Radiol 69: 34-42.
[Crossref]
10.
Sorin V, Yagil Y,
Yosepovich A, Shalmon A, Gotlieb M et al. (2018) Contrast-Enhanced Spectral
Mammography in Women With Intermediate Breast Cancer Risk and Dense Breasts. AJR
Am J Roentgenol 211: W267-W274. [Crossref]
11.
Rudnicki W, Heinze S,
Niemiec J, Kojs Z, Sas Korczynska B et al. (2019) Correlation between
quantitative assessment of contrast enhancement in contrast-enhanced spectral mammography
(CESM) and histopathology-preliminary results. Eur Radiol 29: 6220-6226. [Crossref]
12.
Deng CY, Juan YH, Cheung
YC, Lin YC, Lo YF et al. (2018) Quantitative analysis of enhanced malignant and
benign lesions on contrast-enhanced spectral mammography. Br J Radiol
91: 20170605.
[Crossref]
13.
Łuczyńska E, Niemiec J,
Hendrick E, Heinze S, Jaszczyński J et al. (2016) Degree of Enhancement on Contrast
Enhanced Spectral Mammography (CESM) and Lesion Type on Mammography (MG):
Comparison Based on Histological Results. Med Sci Monit 22: 3886-3893. [Crossref]
14.
Yakoumakis E, Tzamicha E, Dimitriadis A,
Georgiou E, Tsapaki V et al. (2015)
Dual-energy contrast-enhanced digital mammography: patient radiation dose
estimation using a Monte Carlo code. Radiat Prot Dosimetry 165: 369-372.
[Crossref]
15.
Nori
J, Kaur M (2018) Contrast-Enhanced Digital Mammography (CEDM). Spri Inter
Publi.
16.
Dance
DR, Skinner CL, Young KC, Beckett JR, Kotre CJ (2000) Additional factors for
the estimation of mean glandular breast dose using the UK mammography dosimetry
protocol. Phys Med Biol 45: 3225-3240. [Crossref]
17.
Fallenberg EM,
Schmitzberger FF, Amer H, Ingold Heppner B, Balleyguier C et al. (2017)
Contrast-enhanced spectral mammography vs. mammography and MRI - clinical
performance in a multi-reader evaluation. Eur Radiol 27: 2752-2764. [Crossref]
18.
Li Z, Yu L, Wan X, Yu H,
Gao Y et al. (2018) Diagnostic Performance of Mammographic Texture Analysis in
the Differential Diagnosis of Benign and Malignant Breast Tumors. Clin
Breast Cancer 18: e621-e627. [Crossref]
19.
Lalji
U, Lobbes M (2014) Contrast-enhanced dual-energy mammography: a promising new
imaging tool in breast cancer detection. Womens Health (Lond) 10:
289-298. [Crossref]
20. Chi X, Zhang L, Xing D, Gong P, Chen Q et al. (2020) Diagnostic value of the enhancement intensity and enhancement pattern of CESM to benign and malignant breast lesions. Medicine (Baltimore) 99: e22097. [Crossref]
21. Chernaya AV, Ulyanova RH, Krivorotko PV, Novikov SN, Kanaev SV et al. (2021) Differential Diagnosis of Breast Lesions in Dual-Energy Contrast-Enhanced Spectral Mammography. Radi Med Diagn Imag 1: 1-6.