Proteomics Approach (iTRAQ) to Test Subchronic and Chronic Toxicity Effects of Mice Exposed to Drinking Water Source from Yangtze River Delta
A B S T R A C T
Objective: To investigate the combined effects of the pollutants in source of drinking water for local populations, mice models were used to test the subchronic toxicity for three months and chronic toxicity for six months.
Methods and Results: By using proteomics approach (iTRAQ), we had identified 29 differentially expressed proteins, which were related to amino acids metabolism, cell skeleton reorganization, apoptosis and cancer genesis. Moreover, 12 out of these 29 identified proteins are located in mitochondria, indicating drinking water source from Yangtze River Delta may exert oxidative damage stress to liver cells. All these cellular processes had been verified by hepatic histopathology, real time-PCR, flow cytometry test and our previous metabolic profile results.
Conclusion: All these tests indicated that drinking water source from Yangtze River Delta could accelerate aging, enhance apoptosis and carcinogenesis risk.
Keywords
Proteomics, iTRAQ, subchronic and chronic toxicity, oxidative damage, drinking water source
Introduction
The proteomics approach is increasingly relied on for identifying the critical cellular process and biomarkers relevant to health risk assessment and early disease detection, as well as for the monitoring of disease progression and molecular classification [1]. The current advances in the field of proteomics provide the opportunity to study the expression changes in global proteome level of cells and tissues at any given time point. Especially, the iTRAQ isobaric tags, one of the isotopic labeling approaches, allows to identify the relative and absolute abundance of proteins among up to eight samples simultaneously in one liquid chromatography-mass spectrometry run (LC-MS) [2].
The Yangtze River is the main source of drinking water for cities located in southeast of China. Many pollutants at low concentrations have been found in this river, such as organochlorine pesticides (OCPs), phthalates (PAEs), polycyclic aromatic hydrocarbons (PAHs), and heavy metals (especially cadmium and arsenic) [3-6]. Not all these possible carcinogens are efficiently removed during the process of treatment of drinking water sources. And the treatments also introduce disinfection by-products and emerging contaminants in source of drinking water, which correlate with carcinogenesis [7]. In our previous work, we had found that pollutants and disinfection by-products in drinking water source from Yangtze River Delta may pose potential carcinogenic risk to local populations. And this conclusion had also been proved by other tests. Long-term exposure to drinking water source from Yangtze River Delta may lead to DNA damage and oncogenesis disorders in mouse models [3-6].
There are two important pictures which are still missing. Firstly, besides all the progresses we made in transcriptomic and metabolic profiles, the proteomic data is still unknown. Secondly, all the previous work we made is based on the fact that the mice exposed to drinking water source from Yangtze River Delta for three months, and we have no idea about the subchronic toxicity effects of the mice exposed for six months or even longer. To address these research gaps, we present proteomics test by comparing the mice fed with distilled water, drinking water source from Yangtze River Delta for three months and for six months.
Materials and Methods
I Water Sample
To investigate the temporal variations of pollutants in drinking water source from Yangtze River Delta. Water samples were tested in April, June and August 2017. The semi-volatile organic pollutants in samples were extracted by liquid-liquid method (EMC 2006) and DSQ II Single Quadrupole GC/MS (ThermoQuest, San Jose, CA, USA). Details about the chemical analysis were described in our previous work [6]. Recoveries of the detected organic pollutants were above 76.4%.
II Animal Test
Sixty three-week-old male mice (C57) were got from the Experimental Animal Center, Academy of Military Medical Science (Beijing, China). After acclimation for seven days at the Nanjing General Hospital of Nanjing Military Command, all mice were randomly divided into three groups. Twenty mice each group, housed in two polypropylene cages, standard animal house conditions (22±2°C, 12 h light/dark cycle, and humidity of 50±5%). The test group mice were fed with drinking water source from Yangtze River Delta for three months (Sub chronic toxicity), six months (chronic toxicity) and the control group was fed with distilled water. The water for mice was monitored daily.
III Hepatic Histopathology
After the mice were sacrificed, liver samples were harvested. Liver tissues were washed in normal saline, and then fixed in 10% formalin for more than 12 h, and sectioned at 5-μm thickness, then mounted onto slides. Tissue slides were stained with hematoxylin and eosin (H&E), and then observed with optical microscope [6]. And tissue slides were also stained with phalloidin and DAPI, and observed under the laser confocal microscopy.
IV Protein Extraction and Digestion
To eliminate individual variations, ten random selected frozen livers from each group were ground in liquid nitrogen in a prechilled mortar with pestle. The fine powder was split into two equal parts and transferred to a 2 ml Eppendorf tube and lysis buffer (50 mM Tris 8.0, 1% SDS, 5 mM EDTA) supplemented with 1 mM PMSF was added. The samples were sonicated for 15min (2s-on, 4s-off, 200 w) on ice using a high intensity ultrasonic processor. The remaining debris and unbroken cells were removed by centrifugation at 30000 g at 4°C for 15 min. The supernatant was transferred to a new tube, reduced with 10 mM DTT for 1 h at 56°C and alkylated with 55 mM iodoacetamide for 45 min at room temperature in the dark. The protein was precipitated with 4 volumes of prechilled acetone for 30 min at -20°C. After centrifugation, the pellet was then dissolved in 0.5 M TEAB and then sonicated for 5min. Repeat the centrifugation step and collect the supernatant. The centrifugation step was repeated and the supernatant was collected. Protein content was determined with Bradford (Biorad, Hercules, CA, USA) using bovine serum albumin as the standard (Sigma, St. Louis, MO, USA). Approximately 100 ug protein for each sample was digested with trypsin (Promega, Madison, WI, USA) overnight at 37°C in a 1:20 trypsin-to-protein mass ratio.
V iTRAQ Labeling
After trypsin digestion, peptide was dried by vacuum centrifugation. Peptides was reconstituted in 0.5 M TEAB and processed according to the manufacturer’s protocol for 8-plex iTRAQ (AB Sciex, Concord, Canada). Briefly, one unit of iTRAQ reagent (defined as the amount of reagent required to label 100 μg peptides) was thawed and reconstituted in 70 μL isopropanol. As mentioned above, two aliquots from each subgroup (three months, six months and control) were labeled with different iTRAQ tags respectively by incubation at room temperature for 2 h according to the design. The peptide mixtures were then pooled and dried by vacuum centrifugation. The peptide labeling efficiency was tested by Ultrafle Xtreme MALDI-TOF\TOF (Bruker Daltonics, Bremen GmbH). The pooled mixtures of iTRAQ-labeled peptides were fractionated by SCX chromatography.
VI Fractionation by Strong Cationic Exchange (SCX)
For SCX chromatography using the LC-20AB HPLC Pump system (Shimadzu Co., Kyoto, Japan), the iTRAQ-labeled peptide mixture was reconstituted with 4 mL buffer A (25 mM NaH2PO4 in 25% ACN, pH 3.0) and loaded into a 4.6×250 mm Ultremex SCX column containing 5-μm particles (Phenomenex, Torrance, CA, USA). The peptides were eluted at a flow rate of 1 mL/min with a gradient of buffer A for 10 min, 5-35% buffer B (25mM NaH2PO4, 1M KCl in 25% ACN, pH 3.0) for 11 min, 35-80% buffer B for 1 min. The system was then maintained in 80% buffer B for 3 min before equilibrating with buffer A for 10 min prior to the next injection. Elution was monitored by measuring absorbance at 214 nm, and fractions were collected every 1 min. The eluted peptides were pooled as 10 fractions, desalted by Strataxc 18 column (Phenomenex, Torrance, CA, USA) and vacuum-dried.
VII LC-ESI-MS/MS Analysis by LTQ-Orbitrap HCD
Each fraction was resuspended in certain volume of buffer A (5% ACN, 0.1% FA) and centrifuged at 20000 g for 10 min. In each fraction, the final concentration of peptide was about 0.25 ug/ul on average. 16 ul supernatant was loaded on an Shimadzu LC-20AD nano-HPLC by the autosampler onto a 2 cm C18 trap column (inner diameter 200 μm) and the peptides were eluted onto a resolving 10 cm analytical C18 column (inner diameter 75 μm) made in-house. The samples were loaded at 40 μL/min for 4min, then the 44min gradient was run at 400 nL/min starting from 2 to 35% B (95%ACN, 0.1%FA), followed by 2 min linear gradient to 80%, and maintenance at 80% B for 4 min, and finally return to 2% in 1 min.
The peptides were subjected to nanoelectrospray ionization followed by tandem mass spectrometry (MS/MS) in an LTQ Orbitrap Velos (Thermo Fisher Scientific, Waltham, MA, USA) coupled online to the HPLC. The mass spectrometer was operated in the data-dependent mode and switched automatically between MS (max of 1×10⁶ ions) and MS/MS (target value of 50,000). Intact peptides were detected in the Orbitrap at a resolution of 60 000. Peptides were selected for MS/MS using high energy collision dissociation (HCD) operating mode with a normalized collision energy setting of 45%; ion fragments were detected in the Orbitrap at a resolution of 7500. A data-dependent procedure that alternated between one MS scan followed by a maximum of eight MS/MS scans was applied for the eight most abundant precursor ions above a threshold ion count of 5000 in the MS survey scan. Parent ions with a charge state from z=1 and unassigned charge states were excluded for fragmentation. Dynamic Exclusion settings were as follows: repeat counts, 2; repeat duration, 30 s; and exclusion duration, 120 s. Ion source parameters were as follows: spray voltage 1.5 kV; no sheath and auxiliary gas flow; ion-transfer capillary temperature 200°C. For MS scans, the m/z scan range was 350 to 2000 Da.
VIII Data Analysis and Interpretation
The instrument data file (raw) for each fraction was merged and transformed to a mgf file by Proteome Discoverer (ver. 1.2.0.208; Thermo Fisher Scientific, Waltham, MA, USA). Peptide and protein identifications were performed using the Mascot search engine (ver. 2.3.0; Matrix Science, London, United Kingdom). Database searching was restricted to tryptic peptides of mouse (IPI_mouse_v3.87). Carbamidomethyl (C), iTRAQ8plex (N-term), iTRAQ8plex (K) were selected as fixed, iTRAQ8plex (Y), Deamidated (NQ), Oxidation (M) as variable modifications, one missed cleavage allowed and precursor error tolerance at 20 ppm, fragment tolerance at 0.1 Da. Proteins were identified on the basis of having at least one peptide whose individual e-value wasn’t more than 0.05 and also identified as the top-ranked matching sequence for that spectrum. We further restricted the number of identifications made by imposing spectrum and peptide-level nonredundancy such that any given peptide and any given MS/MS spectrum were linked to only one protein. The complete list of identified peptides was then housed in an Excel (Microsoft, Redmond, WA, USA) database for calculation of ratios and coefficient of variation.
The meaningful cutoff of proteins for upregulated ≥1.5 fold and downregulated ≤0.67 fold was selected as the differential expressed proteins (DEPs). We also used CV value between technical replicates to estimate the quantitation confidence.
IX Real time-PCR for Genes Transcriptions Quantification
Total RNA was extracted from liver by TRIzol Reagent (Invitrogen, Carlsbad, CA) and reverse-transcribed by RT Kit (Fermentas, Lithuania). cDNA was quantified by Taq DNA Polymerase(Fermentas, Lithuania) and Realtime PCR Master Mix(SYBR Green) (Toyobo, Japan). β-actin was used as an internal normalizing gene. The primer sequences used were as follows.
X Liver Mononuclear Cell Preparation and Flow Cytometry Test
Mononuclear cells were prepared by using a 200-gauge stainless-steel mesh, and cells were stained by DCFH-DA (2',7'-Dichlorofluorescin diacetate, Sigma, St. Louis, MO) to test the Cellular oxidative damage [8]. We arranged four groups: negative control, three months group, six months group, positive group (negative control +10% H2O2).
Result
I Organic pollutants in Drinking Water Source from Yangtze River Delta
There were 23 organic pollutants detected in drinking water source. It was found that PAEs and PAHs contributed more than 95% to the total concentration of the 23 detected organic pollutants (Table 2).
Table 1: The primer sequences of gene.
|
Primer |
Forward 5’-3’ |
Reverse 5’-3’ |
|
Fah |
AGGCTTCTGCGACAATGC |
TGCTGCCGAGAAGAGTAGAAG |
|
UK114 |
TTGGCACTGTCAATGAGATCTATAA |
GCAGCGACTTGGTAAGCAG |
|
USO1 |
GACTCCAGACGGAGAACTGC |
CCTTCTACAGGAACTGATTTTGC |
|
Pcbd1 |
TCTACCCTGACTCTTATTTGCTTG |
TGGTTCCCTTCCTAGGTTCC |
|
GOT1 |
GCTGTGCTTCTCGCCTAGTT |
AAGACTGCACCCCTCCAAC |
|
ABAT |
TTCCGGAAGCTGAGAGACA |
GCACCTCGTCCACCAAGA |
|
ANXA2 |
GGAAATATGGCAAGTCCCTGT |
TCTGGTAGTCACCCTTGGTGT |
|
Dstn |
CACAGACTTTGCCGTCAGG |
CTTCATCCGCAACCTGAACT |
|
Adssl1 |
AGGCAGAGAAGAACGAGAAGAA |
CTGGTGGAAGTCGAACACAA |
|
Hint2 |
GAAGATGGCTGCTGCTGTG |
TTCACTCCCGTCGGACAC |
|
Eif4g1 |
TATCCAGGTGCAAGCCCTAC |
ACACCTTGGGCTGGGTAATA |
|
Ctsb |
GTGTCTGCTGAAGACCTGCTT |
GGGATAGCCACCATTACAGC |
|
Cyp3a13 |
AATTCCGCCCTGAAAGGT |
AAAGGGCAGGTACATGTAAGGA |
|
Lonp2 |
CAATTATTCGAACAAGCAACAAA |
TGGTCATCTTGAACCGATCC |
Table 2: Concentrations of organic pollutants in drinking water source from Yangtze River Delta (ng/L), Concentration data = means ± Standard deviations.
|
Organic pollutants |
Concentration |
Organic pollutants |
Concentration |
|
isophorone |
14±6 |
indeno(1,2,3-cd)pyrene |
14±7 |
|
pentachlorophenol |
17±9 |
phenanthrene |
37±3 |
|
acenaphthylene |
6±2 |
pyrene |
8±4 |
|
anthracene |
63±26 |
butyl benzy phthalate |
7±3 |
|
benzo(a)anthracene |
14±6 |
bis(2-ethylhexyl)adipate |
372±234 |
|
benzo(b)fluoranthene |
87±34 |
bis(2-ethylhexyl)phthalate |
1914±653 |
|
benzo(k)fluoranthene |
22 ±9 |
dibutyl phthalate |
4932±1043 |
|
benzo(a)pyrene |
7±6 |
diethyl phthalate |
29±7 |
|
chrysene |
16±10 |
2,4-dinitrotoluene |
36±19 |
|
dibenz(a,h)anthracene |
40±14 |
2,6-dinitrotoluene |
300±18 |
|
fluorene |
107±33 |
hexachlorocyclopentadiene |
15±3 |
|
hexachlorobenzene |
11±4 |
dimethyl phthalate |
107±7 |
|
TOC(wet process) |
1.860-2.656mg (RSD<1%) |
||
II iTRAQ Test
1245 proteins had been identified and 1237 proteins were confirmed after filtering. 15 proteins were differentially expressed after exposed to drinking water source from Yangtze River Delta for three months, and 33 proteins for six months compared to the control group. Considering the expression behaviour of these proteins, 29 proteins had been selected to evaluate the toxicity effects of drinking water source from Yangtze River Delta.
Among all the 29 proteins, 22 were related to signaling pathways, and 14 of the 22 proteins are located in the metabolic pathways; several proteins were related to apoptosis and cytoskeleton; 26 of the differentially expressed proteins were associated with cancer, 7 proteins among 26 indicate liver cancer directly. Another important detail was that 12 of 29 proteins were located in mitochondrial. All details were shown in (Table 3).
Table 3: The 29 differentially expressed proteins profiles in mouse livers.
|
Ref. |
Full Name |
Symbol |
Fold |
Disease |
local |
Gene Ontology |
Pathway |
||
|
3 m |
6 m |
Function |
Process |
||||||
|
[9] |
Fumarylacetoacetase |
Fah |
0.94 |
2.2 |
Live cancer; hepatic necrosis; implanted secondary tumor |
Nu |
fumarylacetoacetase activity |
L-phenylalanine,tyrosine,phenylalanine, arginine catabolic process; metal ion binding; hydrolase |
Metabolism of amino acids |
|
[10] |
Ribonuclease UK114 |
Uk114 |
1.3 |
2.1 |
Cancer |
Mito |
endonuclease activity |
inhibition of the translation by cleaving mRNA; endonuclease; tyrosine catabolic process; regulation of translational termination; |
|
|
[11] |
Betaine-homocysteine S-methyltransferase 1 |
Bhmt |
0.99 |
2 |
Prostate cancer |
Cyto |
homocysteine S-methyltransferase activity |
protein methylation; regulationhomocysteinemetabolicprocess; S-methyltransferase activity; Amino-acid biosynthesis |
Metabolism of amino acids |
|
[12] |
Isoform 4 of General vesicular transport factor p115 |
Uso1 |
1.1 |
2 |
Liver cancer; Prostate cancer |
Cyto |
protein transporter activity |
intracellular protein transport; apoptosis; actin and microtubules; |
|
|
[13] |
Sulfite oxidase |
Suox |
1.4 |
1.8 |
Prostate cancer |
Mito |
Sulfite-oxidaseactivity; electron carrier activity |
oxidation-reduction process; response to nutrient |
Metabolism of sulfur |
|
[14] |
Aspartate aminotransferase |
Got1 |
1.4 |
1.8 |
Liver cancer |
Mito |
L-aspartate:2-oxoglutarate aminotransferaseactivity; phosphatidylserine decarboxylase activity |
amino acid metabolism; the urea and tricarboxylic acid (TCA) cycles |
Metabolism of amino acids |
|
[15] |
Pterin-4a-carbinolamine dehydratase |
Pcbd1 |
1.3 |
1.8 |
dysplasia; early stages of cancer; malignant transformation; |
Cyto |
phenylalanine 4-monooxygenase activity |
L-phenylalanine catabolic process; positive regulation of transcription; tetrahydrobiopterin biosynthetic process; |
Metabolism of amino acids |
|
[16] |
Annexin A2 |
Anxa2 |
1.2 |
1.7 |
Liver cancer; |
Cyto |
calcium-dependent phospholipid binding |
cytoskeletal protein binding; Rab-GTPasebinding; phosphatidylinositol-4,5-bisphosphate binding |
Prostaglandin Synthesis and Regulation |
|
[17] |
4-aminobutyrate aminotransferase |
Abat |
1.2 |
1.7 |
Liver cancer |
Mito |
4-aminobutyrate transaminase activity |
transaminase activity; gamma-aminobutyric acid catabolic; DNA-damaging product formation; |
Metabolism of amino acids |
|
[18] |
4-hydroxy-2-oxoglutarate aldolase |
Hoga1 |
1.2 |
1.6 |
engineered invasive esophageal squamous cell carcinoma |
Mito |
catalytic activity |
metabolic pathway of hydroxyproline |
Metabolism of hydroxyproline |
|
[19] |
Serine hydroxymethyl transferase 2 |
Shmt2 |
1.3 |
1.6 |
Prostate cancer |
Mito |
transferase activity |
Regulation of metabolism; Serine+tetrahydrofolate=glycine+5,10-methylene tetrahydrofolate |
Metabolism of cyanoamino acid |
|
[20] |
Microtubule-associated protein RP/EB family member 1 |
Mapre1 |
1.2 |
1.5 |
Gastric cancer |
Cyto |
microtubule plus-end binding |
Cytoskeleton; mitosis; microtubule organizing center |
Cell Cycle G2/M Transition |
|
[21] |
Coiled-coil-helix-coiled -coil-helix domain-containing protein 3 |
Chchd3 |
1.4 |
1.5 |
Anaplastic Cancer |
Mito |
phosphatase binding |
mitochondrial fusion |
|
|
[22] |
Destrin |
Dstn |
1.4 |
1.5 |
Prostate cancer |
Cyto |
actin binding |
actin cytoskeleton; positive regulation of actin filament depolymerization; actin filament severing; |
|
|
[23] |
Isoform 1 of Phosphotriesterase-related protein |
Pter |
0.95 |
1.5 |
Colon cancer; Leukemia; Prostate cancer |
Cyto |
hydrolase activity; zinc ion binding |
catabolic process |
|
|
[15] |
Phosphoglycerate kinase 1 |
Pgk1 |
0.97 |
0.67 |
|
Cyto |
Phosphoglycerate kinase activity |
glycolysis; ATP binding; phosphoglycerate kinase activity; transferase activity; |
Gluconeogenesis |
|
[24] |
Legumain |
Lgmn |
0.93 |
0.66 |
Leukemia; colorectal cancer |
Cyto |
peptidase activity |
serine/threonine kinase activity; cysteine-type endopeptidase; negative regulation of growth |
Lysosome |
|
[25] |
Isoform 1 of Core histone macro-H2A.1 |
H2afy |
0.99 |
0.64 |
Colon cancer; leukemia |
Nu
|
chromatin binding |
nucleosome assembly; chromatin modification |
Systemic lupus erythematosus |
|
[26] |
Succinatedehydrogenase [ubiquinone] iron-sulfur subunit, |
Sdhb |
0.98 |
0.61 |
|
Mito |
protein binding |
glycerol-3-phosphate dehydrogenase complex; glycerophosphate shuttle; oxidoreductase |
TCA Cycle |
|
[27] |
Isoform 1 of Eukaryotic translation initiation factor 4 gamma 1 |
Eif4g1 |
0.84 |
0.59 |
Sorcoma; Leukemia; mitochondrial disorder; Hepatitis; Colorectal cancer |
Cyto |
translation initiation factor activity |
regulation of translation |
Metabolism of mRNA; translation; PI3K Cascade; eIF4F complex; mTOR signalling pathways |
|
[28] |
Histidinetriad nucleotide-binding protein 2 |
Hint2 |
0.77 |
0.59 |
Prostate cance; Colon caner; leukemia |
Mito |
catalytic activity |
Apoptosis; steroid biosynthetic; hydrolase |
|
|
[29] |
Cytochrome P450 2F2 |
Cyp2f2 |
0.87 |
0.58 |
Growth supperssion; insulin resistant; |
ER |
Monooxygenase; electron carrier; oxidoreductase activity |
response to toxin; naphthalene metabolic process |
Metabolism of xenobiotics by cytochrome P450 |
|
[30] |
Cathepsin B |
Ctsb |
0.98 |
0.58 |
mitochondrial disorder; hepatitis; leukemia; prostate cancer |
Mito Cyto |
cysteine-type endopeptidase activity |
response to wounding; endopeptidase; response to stress; negative regulation of apoptosis |
Lysosome |
|
[31] |
Isoform 1 of Lon protease homolog 2 |
Lonp2 |
0.95 |
0.54 |
Liver cancer; leukemia |
Pero |
protein binding |
signal peptide processing; ATPase; serine-type endopeptidase |
Metabolism of proteins |
|
[32] |
ATP synthase subunit f |
Atp5j2 |
1 |
0.51 |
hepatitis; leukemia; carcinoma in situ lesion |
Mito |
ATPase activity |
transmembrane transporter; ATPase; mitochondrial proton-transporting ATP synthase complex |
Oxidative phosphorylation; Electron Transport Chain |
|
[33] |
Majoy urinary protein 20 |
Mup20 |
0.62 |
0.37 |
|
|
pheromone binding |
olfactory learning |
|
|
[34] |
Isoform 1 of Adenylosuccinate synthetase isozyme 1 |
Adssl1 |
0.89 |
0.63 |
Liver cancer; colorectal cancer; obesity; leukemia |
Cyto
|
adenylosuccinate synthase activity |
purine nucleotide biosynthetic; adenylosuccinate synthase; AMP biosynthetic |
Metabolism of amino acids
|
|
[35] |
Cytochrome P450 3A13 |
Cyp3a13 |
0.67 |
0.57 |
insulin resistant; liver cancer |
ER |
Monooxygenase; electron carrier; aromatase; iron ion binding |
Metabolism of xenobiotics by cytochrome P451 |
Monooxygenase; electron carrier; aromatase; iron ion binding |
|
[36] |
Long-chain specific acyl-CoA dehydrogenase |
Acadl
|
1.6 |
1.5 |
sarcoma |
Mito Cyto |
|
lipid catabolic; negative regulation of fatty acid oxidation; long-chain-acyl-CoA dehydrogenase |
TCA Cycle |
Nu: Nuclear; ER: Endoplasmic Reticulum; Cyto: Cytoplasm; Mito: Mitochondrial; Pero: Peroxisome.
III Realtime PCR
Overall pattern of mRNA expression is similar to that of protein expression in mammalian systems, and integrated analyses of mRNA and protein expression data by concurrent measurement was observed strong correlation in mammalian cells [37-38]. In order to complement the proteomics results, the real-time quantitative PCR was performed on 14 genes encoding differentiated proteins. The fold change of mRNA is in line with the proteins and indicates the high confidence of our proteomics result. Details were referred to (Table 4).
Table 4: Analysis by RT-qPCR of the expression of 14 oncogenes.
|
Gene Symbol |
3 mon |
6 mon |
Gene Symbol |
3 mon |
6 mon |
|
Fah |
1.4 |
3.1 |
Adssl1 |
0.78 |
0.72 |
|
Ukk114 |
1.2 |
2.8 |
Hint2 |
0.49 |
0.47 |
|
Uso1 |
1.4 |
3.3 |
Eif4g1 |
0.84 |
0.59 |
|
Pcbd1 |
1.3 |
3.1 |
Ctsb |
0.93 |
0.62 |
|
Got1 |
1.3 |
2.7 |
Cyp3a13 |
0.67 |
0.49 |
|
Abat |
2.1 |
2.8 |
Dstn |
3 |
3.2 |
|
Anxa2 |
2.1 |
2.8 |
Lonp2 |
0.89 |
0.47 |
IV Hepatic Histopathology
The first line of the photos were control group (1-c, 2-c, 3-c), the second line were mice exposed to drinking water source from Yangtze River Delta for 3 months (1-3, 2-3, 3-3), and the third line were mice exposed for six months (1-6, 2-6, 3-6). The tissue pathologic phenomenon was emerged in 3 months group and exacerbated in 6 months (Figure 1). All the pathology results indicate the tissue were in disorder under the stress and exacerbated with longer time.
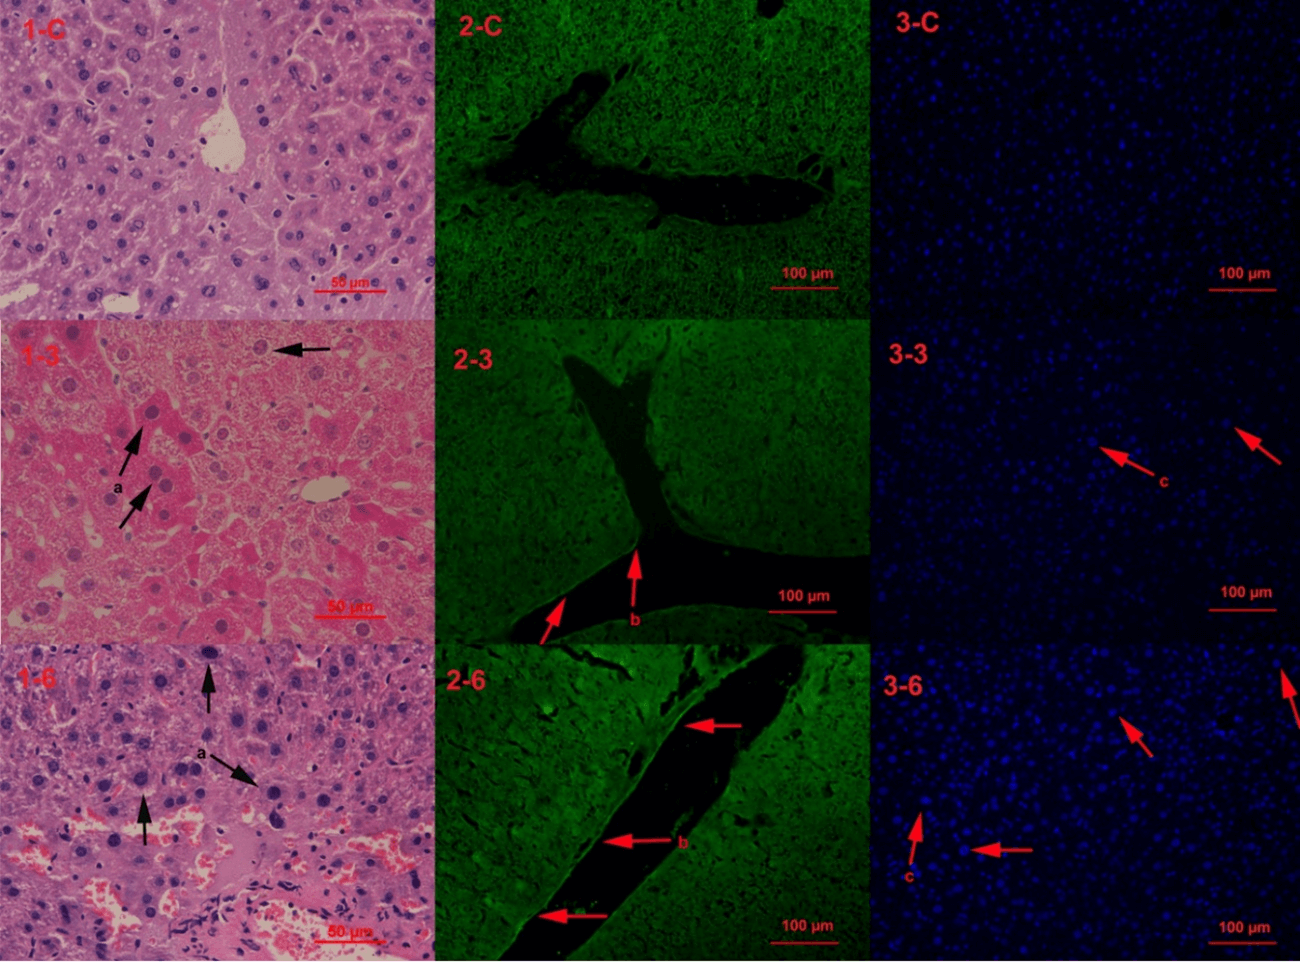
Figure 1: Hepatic Histopathology. Note: a-nuclear bulging and chromosome condensing, key characteristic of aging (H&E staining); b-cytoskelecton reorganization in vascular endothelial cell (phalloidin staining); c-nuclear bulging (DAPI staining).
V Oxidative Damage
The oxidative damage has been found in hepatic cells. Oxidative damage in six months group is twice more than in three months group, and both of these two groups are less than in the positive group. The peak in left region means healthy cells, and the right regions represent oxidative damage cells. Details refer to (Figure 2).
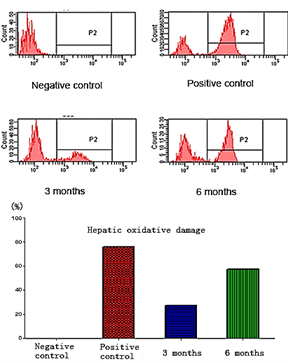
Figure 2: DCF (2',7'-Dichlorofluorescin diacetate) test the oxidative damage (P2 region).
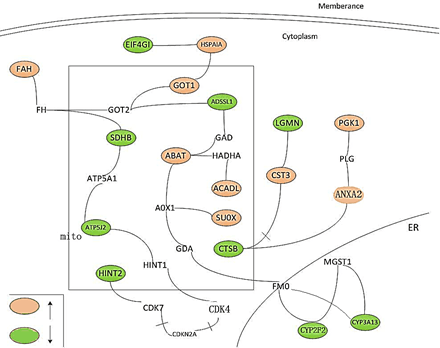
Figure 3: The interactions between the differently expressed proteins (proteins colored orange or green).
Discussion
In an attempt to better understanding toxicity mechanisms and disease progression of drinking water source, we classified the cellular process and function into four sections: amino acids metabolism; cell skeleton (actins and microtubules) reorganization; apoptosis and cancer. But in the hepatic histopathology, we found the phenomenon that aging existed in liver tissue and actins organization in vascular endothelial cell. Aging is a bridge that adjoins oxidative stress, mitochondrial disorder to apoptosis and cancer [39, 40].
Amino acids catabolic process indicates the liver injury, which may cause rapid hepatocyte death [9, 10]. The actin and microtubules decide the direction of apoptotic cells [12, 16]. However, stress-induced failure of cell death programmes may lead to an accumulation of damaged cells and therefore enhance the risk of carcinogenesis [9, 22]. On the other hand, the aging can enhance the apoptosis risk; and as a defense mechanism, dealing with the oncogenes disorder, aging is an effective way to inhibit the carcinogenesis [39, 41].
It is found that the differential expression of mRNA and proteins was enlarged with longer time. The vascular endothelial cell injury was more serious and number of aging cells was also increased in six months group compared to three months. And the closely related differentially expressed proteins were presented in (Figure 3).
I Metabolism of Amino Acids
In our previous work, the NMR-based metabolic profile of mice exposed to drinking water source for 90 days had shown that several amino acids had disorder in serum [6, 42]. And in our proteomic profile, we found that FAH, BHMT, UK114, GOT1, PCBD1, ADSSL1 were related to amino acid catabolic process.
II Cellular Stress Responses
The flow cytometry test has showed the oxidative damage of liver. In the proteomic profile, we had found that 12 proteins located in the mitochondrial, 13 proteins in the cytoplasm, 2 in the endoplasmic reticulum (ER), 2 in the nuclear, and 1 in peroxisomal. The chemical stress may cause the disorder of mitochondrial, ER, peroxisomal, and inter-organelle crosstalk during cellular stress, like mitochondrial–nuclear crosstalk [43, 44]. ER Stress responses have been found playing important roles in maintaining cellular functions. Creld2 is a novel mediator in regulating the progression of various ER stress-associated diseases and CYP2F2 response to wounding [45].
Several proteins located in the mitochondrial are related to cellular stress response. One of them is CTSB, which is an important indicator of autophagy, apoptosis and response to stress. ACADL, SDHB, GOT1 are in the tricarboxylic acid (TCA) cycle, which is determined in the energy and biomolecules carbon skeleton in cell. SUOX is related to electron transfer, while ABAT may indicate the DNA damaging in mitochondrial. All the disorder of these proteins in mitochondrial may causes oxidative damage to cells, and leads to aging and apoptosis [40, 46-48].
III Cytoskeleton Reorganization
On the other side of this text, it has been found that USO1, ANXA2, MAPRE1, DSTN were related to cell skeleton. The disorders of USO1 (p115), ANXA2 (P36) and DSTN which are associated with actin and microtubules decide the direction of apoptotic cells [12, 16]. After the containing in source of drinking water transferring into blood and exerting stress to the vascular, it had been observed that the cytoskeleton reorganization in vascular wall cells and reflected cells injury under stress [49].
IV Aging, Apoptosis and Cancer
In the hepatic histopathology, we found the number of aging cells was increased in six months group comparing to three months group and control group. It also verified the accumulations of oxidative damage. The mitochondria disorder directly caused cell aging and raised up the apoptosis risk. While facing with the oncogenes disorders, aging is an effective way to restrict the carcinogenesis. However, the accumulation of cells damaging can also enhance the risk for cancer [9, 22, 50].
Conclusion
The drinking water source from Yangtze River Delta may exert oxidative damage stress to hepatic cells and also causes the amino acids metabolism disorder, cell skeleton reorganization, oncogene differentially expression. All these cellular processes directly lead to cell aging. Comparing with the subchronic and chronic toxicity effects, we found that the water could accelerate aging, enhance apoptosis and increase carcinogenesis risk.
Acknowledgments
We gratefully acknowledge generous support provided by Programme for Changjiang Scholars Innovative Research Team in University and NSFC (50938004, 50825802, and 51178215) and Jangsu Nature Science Fund for Distinguished Scientists (BK2010006 and BK2011032) P.R. China.
Article Info
Article Type
Research ArticlePublication history
Received: Sat 19, Dec 2020Accepted: Sat 09, Jan 2021
Published: Mon 18, Jan 2021
Copyright
© 2023 Jie Sun. This is an open-access article distributed under the terms of the Creative Commons Attribution License, which permits unrestricted use, distribution, and reproduction in any medium, provided the original author and source are credited. Hosting by Science Repository.DOI: 10.31487/j.JSO.2021.01.01
Figures & Tables
Table 1: The primer sequences of gene.
|
Primer |
Forward 5’-3’ |
Reverse 5’-3’ |
|
Fah |
AGGCTTCTGCGACAATGC |
TGCTGCCGAGAAGAGTAGAAG |
|
UK114 |
TTGGCACTGTCAATGAGATCTATAA |
GCAGCGACTTGGTAAGCAG |
|
USO1 |
GACTCCAGACGGAGAACTGC |
CCTTCTACAGGAACTGATTTTGC |
|
Pcbd1 |
TCTACCCTGACTCTTATTTGCTTG |
TGGTTCCCTTCCTAGGTTCC |
|
GOT1 |
GCTGTGCTTCTCGCCTAGTT |
AAGACTGCACCCCTCCAAC |
|
ABAT |
TTCCGGAAGCTGAGAGACA |
GCACCTCGTCCACCAAGA |
|
ANXA2 |
GGAAATATGGCAAGTCCCTGT |
TCTGGTAGTCACCCTTGGTGT |
|
Dstn |
CACAGACTTTGCCGTCAGG |
CTTCATCCGCAACCTGAACT |
|
Adssl1 |
AGGCAGAGAAGAACGAGAAGAA |
CTGGTGGAAGTCGAACACAA |
|
Hint2 |
GAAGATGGCTGCTGCTGTG |
TTCACTCCCGTCGGACAC |
|
Eif4g1 |
TATCCAGGTGCAAGCCCTAC |
ACACCTTGGGCTGGGTAATA |
|
Ctsb |
GTGTCTGCTGAAGACCTGCTT |
GGGATAGCCACCATTACAGC |
|
Cyp3a13 |
AATTCCGCCCTGAAAGGT |
AAAGGGCAGGTACATGTAAGGA |
|
Lonp2 |
CAATTATTCGAACAAGCAACAAA |
TGGTCATCTTGAACCGATCC |
Table 2: Concentrations of organic pollutants in drinking water source from Yangtze River Delta (ng/L), Concentration data = means ± Standard deviations.
|
Organic pollutants |
Concentration |
Organic pollutants |
Concentration |
|
isophorone |
14±6 |
indeno(1,2,3-cd)pyrene |
14±7 |
|
pentachlorophenol |
17±9 |
phenanthrene |
37±3 |
|
acenaphthylene |
6±2 |
pyrene |
8±4 |
|
anthracene |
63±26 |
butyl benzy phthalate |
7±3 |
|
benzo(a)anthracene |
14±6 |
bis(2-ethylhexyl)adipate |
372±234 |
|
benzo(b)fluoranthene |
87±34 |
bis(2-ethylhexyl)phthalate |
1914±653 |
|
benzo(k)fluoranthene |
22 ±9 |
dibutyl phthalate |
4932±1043 |
|
benzo(a)pyrene |
7±6 |
diethyl phthalate |
29±7 |
|
chrysene |
16±10 |
2,4-dinitrotoluene |
36±19 |
|
dibenz(a,h)anthracene |
40±14 |
2,6-dinitrotoluene |
300±18 |
|
fluorene |
107±33 |
hexachlorocyclopentadiene |
15±3 |
|
hexachlorobenzene |
11±4 |
dimethyl phthalate |
107±7 |
|
TOC(wet process) |
1.860-2.656mg (RSD<1%) |
||
Table 3: The 29 differentially expressed proteins profiles in mouse livers.
|
Ref. |
Full Name |
Symbol |
Fold |
Disease |
local |
Gene Ontology |
Pathway |
||
|
3 m |
6 m |
Function |
Process |
||||||
|
[9] |
Fumarylacetoacetase |
Fah |
0.94 |
2.2 |
Live cancer; hepatic necrosis; implanted secondary tumor |
Nu |
fumarylacetoacetase activity |
L-phenylalanine,tyrosine,phenylalanine, arginine catabolic process; metal ion binding; hydrolase |
Metabolism of amino acids |
|
[10] |
Ribonuclease UK114 |
Uk114 |
1.3 |
2.1 |
Cancer |
Mito |
endonuclease activity |
inhibition of the translation by cleaving mRNA; endonuclease; tyrosine catabolic process; regulation of translational termination; |
|
|
[11] |
Betaine-homocysteine S-methyltransferase 1 |
Bhmt |
0.99 |
2 |
Prostate cancer |
Cyto |
homocysteine S-methyltransferase activity |
protein methylation; regulationhomocysteinemetabolicprocess; S-methyltransferase activity; Amino-acid biosynthesis |
Metabolism of amino acids |
|
[12] |
Isoform 4 of General vesicular transport factor p115 |
Uso1 |
1.1 |
2 |
Liver cancer; Prostate cancer |
Cyto |
protein transporter activity |
intracellular protein transport; apoptosis; actin and microtubules; |
|
|
[13] |
Sulfite oxidase |
Suox |
1.4 |
1.8 |
Prostate cancer |
Mito |
Sulfite-oxidaseactivity; electron carrier activity |
oxidation-reduction process; response to nutrient |
Metabolism of sulfur |
|
[14] |
Aspartate aminotransferase |
Got1 |
1.4 |
1.8 |
Liver cancer |
Mito |
L-aspartate:2-oxoglutarate aminotransferaseactivity; phosphatidylserine decarboxylase activity |
amino acid metabolism; the urea and tricarboxylic acid (TCA) cycles |
Metabolism of amino acids |
|
[15] |
Pterin-4a-carbinolamine dehydratase |
Pcbd1 |
1.3 |
1.8 |
dysplasia; early stages of cancer; malignant transformation; |
Cyto |
phenylalanine 4-monooxygenase activity |
L-phenylalanine catabolic process; positive regulation of transcription; tetrahydrobiopterin biosynthetic process; |
Metabolism of amino acids |
|
[16] |
Annexin A2 |
Anxa2 |
1.2 |
1.7 |
Liver cancer; |
Cyto |
calcium-dependent phospholipid binding |
cytoskeletal protein binding; Rab-GTPasebinding; phosphatidylinositol-4,5-bisphosphate binding |
Prostaglandin Synthesis and Regulation |
|
[17] |
4-aminobutyrate aminotransferase |
Abat |
1.2 |
1.7 |
Liver cancer |
Mito |
4-aminobutyrate transaminase activity |
transaminase activity; gamma-aminobutyric acid catabolic; DNA-damaging product formation; |
Metabolism of amino acids |
|
[18] |
4-hydroxy-2-oxoglutarate aldolase |
Hoga1 |
1.2 |
1.6 |
engineered invasive esophageal squamous cell carcinoma |
Mito |
catalytic activity |
metabolic pathway of hydroxyproline |
Metabolism of hydroxyproline |
|
[19] |
Serine hydroxymethyl transferase 2 |
Shmt2 |
1.3 |
1.6 |
Prostate cancer |
Mito |
transferase activity |
Regulation of metabolism; Serine+tetrahydrofolate=glycine+5,10-methylene tetrahydrofolate |
Metabolism of cyanoamino acid |
|
[20] |
Microtubule-associated protein RP/EB family member 1 |
Mapre1 |
1.2 |
1.5 |
Gastric cancer |
Cyto |
microtubule plus-end binding |
Cytoskeleton; mitosis; microtubule organizing center |
Cell Cycle G2/M Transition |
|
[21] |
Coiled-coil-helix-coiled -coil-helix domain-containing protein 3 |
Chchd3 |
1.4 |
1.5 |
Anaplastic Cancer |
Mito |
phosphatase binding |
mitochondrial fusion |
|
|
[22] |
Destrin |
Dstn |
1.4 |
1.5 |
Prostate cancer |
Cyto |
actin binding |
actin cytoskeleton; positive regulation of actin filament depolymerization; actin filament severing; |
|
|
[23] |
Isoform 1 of Phosphotriesterase-related protein |
Pter |
0.95 |
1.5 |
Colon cancer; Leukemia; Prostate cancer |
Cyto |
hydrolase activity; zinc ion binding |
catabolic process |
|
|
[15] |
Phosphoglycerate kinase 1 |
Pgk1 |
0.97 |
0.67 |
|
Cyto |
Phosphoglycerate kinase activity |
glycolysis; ATP binding; phosphoglycerate kinase activity; transferase activity; |
Gluconeogenesis |
|
[24] |
Legumain |
Lgmn |
0.93 |
0.66 |
Leukemia; colorectal cancer |
Cyto |
peptidase activity |
serine/threonine kinase activity; cysteine-type endopeptidase; negative regulation of growth |
Lysosome |
|
[25] |
Isoform 1 of Core histone macro-H2A.1 |
H2afy |
0.99 |
0.64 |
Colon cancer; leukemia |
Nu
|
chromatin binding |
nucleosome assembly; chromatin modification |
Systemic lupus erythematosus |
|
[26] |
Succinatedehydrogenase [ubiquinone] iron-sulfur subunit, |
Sdhb |
0.98 |
0.61 |
|
Mito |
protein binding |
glycerol-3-phosphate dehydrogenase complex; glycerophosphate shuttle; oxidoreductase |
TCA Cycle |
|
[27] |
Isoform 1 of Eukaryotic translation initiation factor 4 gamma 1 |
Eif4g1 |
0.84 |
0.59 |
Sorcoma; Leukemia; mitochondrial disorder; Hepatitis; Colorectal cancer |
Cyto |
translation initiation factor activity |
regulation of translation |
Metabolism of mRNA; translation; PI3K Cascade; eIF4F complex; mTOR signalling pathways |
|
[28] |
Histidinetriad nucleotide-binding protein 2 |
Hint2 |
0.77 |
0.59 |
Prostate cance; Colon caner; leukemia |
Mito |
catalytic activity |
Apoptosis; steroid biosynthetic; hydrolase |
|
|
[29] |
Cytochrome P450 2F2 |
Cyp2f2 |
0.87 |
0.58 |
Growth supperssion; insulin resistant; |
ER |
Monooxygenase; electron carrier; oxidoreductase activity |
response to toxin; naphthalene metabolic process |
Metabolism of xenobiotics by cytochrome P450 |
|
[30] |
Cathepsin B |
Ctsb |
0.98 |
0.58 |
mitochondrial disorder; hepatitis; leukemia; prostate cancer |
Mito Cyto |
cysteine-type endopeptidase activity |
response to wounding; endopeptidase; response to stress; negative regulation of apoptosis |
Lysosome |
|
[31] |
Isoform 1 of Lon protease homolog 2 |
Lonp2 |
0.95 |
0.54 |
Liver cancer; leukemia |
Pero |
protein binding |
signal peptide processing; ATPase; serine-type endopeptidase |
Metabolism of proteins |
|
[32] |
ATP synthase subunit f |
Atp5j2 |
1 |
0.51 |
hepatitis; leukemia; carcinoma in situ lesion |
Mito |
ATPase activity |
transmembrane transporter; ATPase; mitochondrial proton-transporting ATP synthase complex |
Oxidative phosphorylation; Electron Transport Chain |
|
[33] |
Majoy urinary protein 20 |
Mup20 |
0.62 |
0.37 |
|
|
pheromone binding |
olfactory learning |
|
|
[34] |
Isoform 1 of Adenylosuccinate synthetase isozyme 1 |
Adssl1 |
0.89 |
0.63 |
Liver cancer; colorectal cancer; obesity; leukemia |
Cyto
|
adenylosuccinate synthase activity |
purine nucleotide biosynthetic; adenylosuccinate synthase; AMP biosynthetic |
Metabolism of amino acids
|
|
[35] |
Cytochrome P450 3A13 |
Cyp3a13 |
0.67 |
0.57 |
insulin resistant; liver cancer |
ER |
Monooxygenase; electron carrier; aromatase; iron ion binding |
Metabolism of xenobiotics by cytochrome P451 |
Monooxygenase; electron carrier; aromatase; iron ion binding |
|
[36] |
Long-chain specific acyl-CoA dehydrogenase |
Acadl
|
1.6 |
1.5 |
sarcoma |
Mito Cyto |
|
lipid catabolic; negative regulation of fatty acid oxidation; long-chain-acyl-CoA dehydrogenase |
TCA Cycle |
Nu: Nuclear; ER: Endoplasmic Reticulum; Cyto: Cytoplasm; Mito: Mitochondrial; Pero: Peroxisome.
Table 4: Analysis by RT-qPCR of the expression of 14 oncogenes.
|
Gene Symbol |
3 mon |
6 mon |
Gene Symbol |
3 mon |
6 mon |
|
Fah |
1.4 |
3.1 |
Adssl1 |
0.78 |
0.72 |
|
Ukk114 |
1.2 |
2.8 |
Hint2 |
0.49 |
0.47 |
|
Uso1 |
1.4 |
3.3 |
Eif4g1 |
0.84 |
0.59 |
|
Pcbd1 |
1.3 |
3.1 |
Ctsb |
0.93 |
0.62 |
|
Got1 |
1.3 |
2.7 |
Cyp3a13 |
0.67 |
0.49 |
|
Abat |
2.1 |
2.8 |
Dstn |
3 |
3.2 |
|
Anxa2 |
2.1 |
2.8 |
Lonp2 |
0.89 |
0.47 |
References
- Hanash SM, Pitteri SJ, Faca VM (2008) Mining the plasma proteome for cancer biomarkers. Nature 452: 571-579. [Crossref]
- Ghosh D, Yu H, Tan XF, Lim TK, Zubaidah RM et al. (2011) Identification of Key Players for Colorectal Cancer Metastasis by iTRAQ Quantitative Proteomics Profiling of Isogenic SW480 and SW620 Cell Lines. J Proteome Res 10: 4373-4387. [Crossref]
- Zhang R, Cheng SP, Li AM, Sun J, Zhang Y et al. (2011) Genome-wide screening of indicator genes for assessing the potential carcinogenic risk of Nanjing city source of drinking water. Ecotoxicology 20: 1033-1040. [Crossref]
- Wu B, Zhang Y, Zhang XX, Cheng SP (2010) Health Risk from Exposure of Organic Pollutants Through Source of drinking water Consumption in Nanjing, China. Bull Environ Contam Toxicol 84: 46-50. [Crossref]
- Li YQ, Wu YL, Chen YG, Kong ZM (2006) Genotoxicity evaluation and a primary risk assessment of organic pollutants in the source of drinking water sources of Nanjing, China. J Environ Sci (China) 18: 983-988. [Crossref]
- Zhang Y, Zhang X, Wu B, Cheng S (2011) Evaluating the Transcriptomic and Metabolic Profile of Mice Exposed to Source Source of drinking water. Environ Sci Technol 46: 78-83. [Crossref]
- Richardson SD (2003) Disinfection by-products and other emerging contaminants in source of drinking water. Trac-Trends Analyt Chemist 22: 666-684.
- Zhao N, Hao J, Ni Y, Luo W, Liang R et al. (2011) Vγ4 γδ T cell-derived IL-17A negatively regulates NKT cell function in Con A-induced fulminant hepatitis. J Immunol 187: 5007-5014. [Crossref]
- Vogel A, van Den Berg IE, Al Dhalimy M, Groopman J, Ou CN et al. (2004) Chronic liver disease in murine hereditary tyrosinemia type 1 induces resistance to cell death. Hepatology 39: 433-443. [Crossref]
- Colombo I, Ceciliani F, Ronchi S, Bartorelli A, Berra B (1998) cDNA cloning and Escherichia coli expression of UK114 tumor antigen. Biochim Biophys Acta 1442: 49-59. [Crossref]
- Hsu FC, Sides EG, Mychaleckyj JC, Worrall BB, Elias GA et al. (2011) Transcobalamin 2 variant associated with poststroke homocysteine modifies recurrent stroke risk. Neurology 77: 1543-1550. [Crossref]
- Slattum G, McGee KM, Rosenblatt J (2009) P115 RhoGEF and microtubules decide the direction apoptotic cells extrude from an epithelium. J Cell Biol 186: 693-702. [Crossref]
- Constantin D, Bini A, Meletti E, Moldeus P, Monti D et al. (1996) Age-related differences in the metabolism of sulphite to sulphate and in the identification of sulphur trioxide radical in human polymorphonuclear leukocytes. Mech Ageing Dev 88: 95-109. [Crossref]
- Zhu AX, Stuart K, Blaszkowsky LS, Muzikansky A, Reitberg DP (2007) Phase 2 study of cetuximab in patients with advanced hepatocellular carcinoma. Cancer 110: 581-589. [Crossref]
- Reinders J, Zahedi RP, Pfanner N, Meisinger C, Sickmann A (2006) Toward the complete yeast mitochondrial proteome: multidimensional separation techniques for mitochondrial proteomics. J Proteome Res 5: 1543-1554. [Crossref]
- Massey Harroche D, Mayran N, Maroux S (1998) Polarized localizations of annexins I, II, VI and XIII in epithelial cells of intestinal, hepatic and pancreatic tissues. J Cell Sci 111: 3007-3015. [Crossref]
- Stevens GJ, Burkey JL, McQueen CA (2000) Toxicity of the heterocyclic amine batracylin: investigation of rodent N-acetyltransferase activity and potential contribution of cytochrome P450 3A. Cell Biology Toxicol 16: 31-39. [Crossref]
- Monico CG, Rossetti S, Belostotsky R, Cogal AG, Herges RM et al. (2011) Primary Hyperoxaluria Type III Gene HOGA1 (Formerly DHDPSL) as a Possible Risk Factor for Idiopathic Calcium Oxalate Urolithiasis. Clin J Am Soc Nephrol 6: 2289-2295. [Crossref]
- Anderson DD, Stover PJ (2009) SHMT1 and SHMT2 Are Functionally Redundant in Nuclear De novo Thymidylate Biosynthesis. Plos One 4: e5839. [Crossref]
- Kim K, Lee HC, Park JL, Kim M, Kim SY et al. (2011) Epigenetic regulation of microRNA-10b and targeting of oncogenic MAPRE1 in gastric cancer. Epigenetics 6: 740-751. [Crossref]
- Darshi M, Mendiola VL, Mackey MR, Murphy AN, Koller A et al. (2011) ChChd3, an Inner Mitochondrial Membrane Protein, Is Essential for Maintaining Crista Integrity and Mitochondrial Function. J Biol Chem 286: 2918-2932. [Crossref]
- Scott RW, Olson MF (2007) LIM kinases: function, regulation and association with human disease. J Mol Med (Berl) 85: 555-568. [Crossref]
- Hermsen M, Postma C, Baak J, Weiss M, Rapallo A et al. (2002) Colorectal adenoma to carcinoma progression follows multiple pathways of chromosomal instability. Gastroenterology 123: 1109-1119. [Crossref]
- Murthy RV, Arbman G, Gao JF, Roodman GD, Sun XF (2005) Legumain expression in relation to clinicopathologic and biological variables in colorectal cancer. Clin Cancer Res 11: 2293-2299. [Crossref]
- Wu CH, Sahoo D, Arvanitis C, Bradon N, Dill DL et al. (2008) Combined Analysis of Murine and Human Microarrays and ChIP Analysis Reveals Genes Associated with the Ability of MYC To Maintain Tumorigenesis. PLoS Genet 4: e1000090. [Crossref]
- Gimenez Roqueplo AP, Favier J, Rustin P, Rieubland C, Crespin M et al. (2003) Mutations in the SDHB gene are associated with extra-adrenal and/or malignant phaeochromocytomas. Cancer Res 63: 5615-5621. [Crossref]
- Berset C, Zurbriggen A, Djafarzadeh S, Altmann M, Trachsel H (2003) RNA-binding activity of translation initiation factor eIF4G1 from Saccharomyces cerevisiae. RNA 9: 871-880. [Crossref]
- Martin J, Magnino F, Schmidt K, Piguet AC, Lee JS et al. (2006) Hint2, a mitochondrial apoptotic sensitizer down-regulated in hepatocellular carcinoma. Gastroenterology 130: 2179-2188. [Crossref]
- Ye XQ, Lu LM, Gill SS (1997) Suppression of cytochrome P450 Cyp2f2 mRNA levels in mice by the peroxisome proliferator diethylhexylphthalate. Biochem Biophys Res Commun 239: 660-665. [Crossref]
- Plis Finarov A, Hudson H, Roe B, Ron M, Seroussi E (2004) Mapping of the GATA4, NEIL2, FDFT1 genes and CTSB-associated microsatellites to the centromeric region of BTA8. Anim Genet 35: 154-155. [Crossref]
- Ohashi J, Naka I, Tsuchiya N (2011) The Impact of Natural Selection on an ABCC11 SNP Determining Earwax Type. Mol Biol Evolution 28: 849-857. [Crossref]
- Borsch M, Diez M, Zimmermann B, Reuter R, Graber P (2002) Stepwise rotation of the gamma-subunit of EF0F1-ATP synthase observed by intramolecular single-molecule fluorescence resonance energy transfer. FEBS Lett 527: 147-152. [Crossref]
- Flower DR (1996) The lipocalin protein family: Structure and function. Biochem J 318: 1-14. [Crossref]
- Sun H, Li N, Wang X, Chen T, Shi L et al. (2005) Molecular cloning and characterization of a novel muscle adenylosuccinate synthetase, AdSSL1, from human bone marrow stromal cells. Mol Cell Biochem 269: 85-94. [Crossref]
- Down MJ, Arkle S, Mills JJ (2007) Regulation and induction of CYP3A11, CYP3A13 and CYP3A25 in C57BL/6J mouse liver. Arch Biochem Biophys 457: 105-110. [Crossref]
- Indo Y, Yang Feng T, Glassberg R, Tanaka K (1991) Molecular-Cloning and Nucleotide-Sequence of Cdnas Encoding Human Long-Chain Acyl-Coa Dehydrogenase and Assignment of the Location of Its Gene (Acadl) to Chromosome-2. Genomics 11: 609-620. [Crossref]
- Tian Q, Stepaniants SB, Mao M, Weng L, Feetham MC et al. (2004) Integrated genomic and proteomic analyses of gene expression in Mammalian cells. Mol Cell Proteomics 3: 960-969. [Crossref]
- Ideker T, Thorsson V, Ranish JA, Christmas R, Buhler J et al. (2001) Integrated genomic and proteomic analyses of a systematically perturbed metabolic network. Science 292: 929-934. [Crossref]
- Wallace DC (2005) A mitochondrial paradigm of metabolic and degenerative diseases, aging, and cancer: A dawn for evolutionary medicine. Ann Rev Genetics 39: 359-407. [Crossref]
- Bokov A, Chaudhuri A, Richardson A (2004) The role of oxidative damage and stress in aging. Mech Ageing Dev 125: 811-826. [Crossref]
- Vogelstein B, Kinzler KW (1993) The Multistep Nature of Cancer. Trends Genet 9: 138-141. [Crossref]
- Zhang Y, Wu B, Zhang X, Li A, Cheng S (2011) Metabolic profiles in serum of mouse after chronic exposure to source of drinking water. Hum Exp Toxicol 30: 1088-1095. [Crossref]
- Biswas G, Adebanjo OA, Freedman BD, Anandatheerthavarada HK, Vijayasarathy C et al. (1999) Retrograde Ca2+ signaling in C2C12 skeletal myocytes in response to mitochondrial genetic and metabolic stress: a novel mode of inter-organelle crosstalk. EMBO J 18: 522-533. [Crossref]
- Dhaunsi GS, Singh I, Hanevold CD (1993) Peroxisomal participation in the cellular response to the oxidative stress of endotoxin. Mol Cell Biochem 126: 25-35. [Crossref]
- Oh hashi K, Koga H, Ikeda S, Shimada K, Hirata Y et al. (2009) CRELD2 is a novel endoplasmic reticulum stress-inducible gene. Biochem Biophys Res Commun 387: 504-510. [Crossref]
- Shigenaga MK, Hagen TM, Ames BN (1994) Oxidative damage and mitochondrial decay in aging. Proc Natl Acad Sci U S A 91: 10771-10778. [Crossref]
- Martin GM, Austad SN, Johnson TE (1996) Genetic analysis of ageing: Role of oxidative damage and environmental stresses. Nat Genet 13: 25-34. [Crossref]
- Hamilton ML, Van Remmen H, Drake JA, Yang H, Guo ZM et al. (2001) Does oxidative damage to DNA increase with age? Proc Natl Acad Sci U S A 98: 10469-10474. [Crossref]
- Vaaraniemi J, Palovuori R, Lehto VP, Eskelinen S (1999) Translocation of MARCKS and reorgnization of the cytoskeleton by PMA correlates with the ion selectivity, the confluence, and transformation state of kidney epithelial cell lines. J Cell Physiol 181: 83-95. [Crossref]
- Wallace DC (2005) A mitochondrial paradigm of metabolic and degenerative diseases, aging, and cancer: A dawn for evolutionary medicine. Annu Rev Genet 39: 359-407. [Crossref]