Prognostication of Patients with Spinal Bone Metastases (SBM): External Validation Study Comparing the Utility of Two Current Prediction Models
A B S T R A C T
Purpose: A majority of developed prediction models for SBM are not used in clinical practice, where there is lack of external validation studies describing their performance on independent patient data.
Methods: Primary aim was to externally validate two prediction models and to demonstrate whether these can be generalized for patients treated in different centers. Secondary aim was to identify additional prognostic factors predicting survival in patients with SBM.
Results: Our results show modest predictive capacity for patients with symptomatic SBM in daily clinical practice by use of the existing two prediction models Van der Linden and Bollen. A slightly better performance in discrimination and calibration is found for the Bollen model with a C-statistic of 0.67 (95% CI: 0.63 –0.71) based on the validation dataset (95% CI: 0.65 –0.73) in contrast to Van der Linden with a C-statistic of 0.65 (95% CI: 0.60–0.71). Impact of brain or visceral metastases was significantly associated with survival, with a Hazard Ratio (HR) of 3.8 and 1.34 respectively. For breast cancer patients with SBM, hormone receptor status was of importance for prognostication (C-statistic of 0.67).
Conclusion: With this first external validation study, we found modest predictive capacity for the prediction models by van der Linden and Bollen, with a slightly better performance for the Bollen model. Predictive impact of overall visceral and brainmetastases should not be underestimated. Breast tumor subtypes based on immunohistochemistry markers, seem to be of importance for the prognostication of breast cancer patients with SBM.
Keywords
Spinal bone metastases, prognostication survival, prediction models, external validation
Introduction
Due to improvements in systemic treatment of primary tumors, the overall survival for patients suffering from metastatic cancer is rising, resulting in a prolonged palliative phase [1, 2]. During the course of cancer, the incidence of spinal metastases varies up to 70% [3]. In more than 50%, the primary tumor for spinal metastases origins from breast, prostate, or lung cancer [3]. Spinal bone metastases (SBM) are often accompanied by a significant morbidity, causing pain due to actual or impending pathologic fractures or due to neurological complications, such as nerve root or spinal cord compression. Prediction of survival is not only crucial in counseling patients or appropriate allocation of resources, but also in selecting the most adequate treatment. Patients with a short expected survival (< 3-6 months) are likely to benefit most from a short radiotherapy course or supportive care, whereas patients with a relatively long expected survival may benefit from high-dose radiotherapy including stereotactic ablative radiotherapy, minimal invasive surgery or even more extensive surgical interventions. Over- or undertreatment due to inadequate prognostication may have a large impact on activity of daily living, dependency and quality of remaining lifespan.
Several prediction models have been developed, all with their own pitfalls, but widely used in clinical practice [4-11]. Because the performance of a prediction model is generally overestimated in the sample in which it was developed, external validation of a model in an independent sample is crucial to broadly evaluate the performance and thus the potential utility of the model in different populations and settings [12]. The Dutch Guideline Database Oncoline recommends the use of, amongst others, one of two prediction models developed in the Netherlands, the models by van der Linden and by Bollen [9, 11, 13]. Both prediction models incorporate the variables Karnofsky performance status (KPS), primary tumor, and visceral involvement in their scoring systems. The first model by Van der Linden, based on the Dutch Bone Metastasis Study (DBMS) database, is a prospective database which included only irradiated patients and stratified patients into 3 prognostic groups. No patients in the DBMS database had spinal cord compression (only patients with Harrington Class I and II lesions were included) or pathologic fracture at randomization. Patients with renal carcinoma, melanoma and cervical SBM were also excluded from randomization. The other model by Bollen stratified patients into 4 prognostic categories from a retrospective database, including surgical patients.
The current study focuses on a consecutive cohort of SBM patients in a university hospital, listed for solely palliative radiotherapy or a combination of surgery and postoperative radiotherapy, also with palliative intent. The primary aim was to externally validate the two abovementioned prediction models and to demonstrate whether these prediction models could be generalized to patients treated in different centers. Our secondary aim was to identify additional prognostic factors predicting survival in patients with SBM.
Methods
I Eligibility
The electronic medical records of consecutive patients, diagnosed with symptomatic SBM and receiving palliative radiotherapy for the first time between the January 1, 2014 – April 1, 2016, were included in this retrospective cohort study. Follow-up data were extracted from electronic medical records until November 6, 2018. Two validation cohorts were generated because of the differences in patient selection between the two models by Van der Linden and Bollen. The eligibility criteria for the Van der Linden model were similar to the original study, containing solely radiotherapy patients, and we excluded SBM which had already been irradiated for the spine, patients with renal carcinoma, melanoma, cervical SBM, spinal cord compression and pathologic fractures. The eligibility criteria for the Bollen validation cohort were similar to the original study. Prognostic factors that were analyzed were: pathologic fracture, spinal cord compression, VAS pre-treatment, lymphogenic metastases, visceral metastases, brain metastases, ER/PR/Her2Neu expression in breast cancer, and EGFR/ALK/KRAS mutation in lung cancer. Patients with direct ingrowth of the primary tumor in the vertebra, patients irradiated for bone metastases solely in the sacral or sacroiliac region, leptomeningeal or intradural metastases, metastases deriving from primary tumors of hematologic or unknown origin, metastases deriving from rare primary tumors, were excluded.
The primary tumors were categorized based on the Tomita classification modified by Bollen et al. [6, 11]. The original Tomita classification used growth speed alone to assign a primary tumor into 1 of 3 groups. However, as growth speed was not the only factor determining survival, the classification was renamed “clinical profile” by Bollen to encompass other contributing factors such as availability of effective systemic treatment options for the primary tumor. The clinical profile of a primary tumor was considered to be favorable, moderate, or unfavorable. The survival status of the patient or date of death was obtained from medical records and/or Municipal Personal Records Database. The Internal Review Board (IRB) approved the study.
II Statistical Analysis
On the total cohort, we selected patients separately for the external validation of both prediction models to match the source population of the two development studies. External validation cohorts were described in terms of patient characteristics using means and standard deviations, and frequencies and percentages. For both external validations separately, the median follow-up time was computed using the reversed-censoring method, to yield the median follow-up time for survivors. Overall survival measures were computed and visualised using Kaplan Meier estimates.
III External Validation
Individual patient risk scores were calculated for external validation. For the model by Bollen a risk score was computed based on the estimated regression coefficients of the Cox Proportional Hazards regression. In order to accomplish this, we computed the natural logarithm of the Hazard Ratios (HRs) that were reported in the study and computed each individual’s linear sum of regression coefficients multiplied by their respective predictor value. This step was performed as predictors are only additive on the log HR scale. The formula which was derived for the model by Bollen was: Bollen score = log(1.6)*Moderate clinical profile (yes = 1) + log(3.5)*Unfavourable clinical profile (yes = 1) + log(1.9)*Impaired Karnofsky performance status (yes = 1) + log(1.5)*Visceral/brain metastases present (yes = 1).
The manuscript by Van der Linden Hazard Ratios did not report regression coefficients or HRs. Therefore, we were only able to validate the simplified risk score in our data. The formula which was derived for the model by Van der Linden was: Van der Linden score = Karnofsky performance status (50-70 = 1, 80-100 = 2) + primary tumor (lung = 1, prostate = 2, breast = 3) + visceral metastases (no = 1). Karnofsky performance scores were not readily available for the study population and were derived from the WHO performance status of the patients. Based on expert opinion (group of 10 radiation oncologists of the MAASTRO clinic), the following conversion table was used: WHO 0-1: KPS 80-100%, WHO 2-3: KPS 50-70%, WHO 4: 10-40%.
The performance of the prediction models was evaluated by assessing discrimination and calibration [14, 15]. Discrimination describes the ability of a prediction model to distinguish individuals who experience the outcome sooner versus those who remain event free or experience the outcome later. Predictive performance was expressed as the concordance-statistic, or Harrell’s C-statistic, a generalization of the area under the Receiver Operating Characteristic curve. A C-statistic of 0.5 indicates the model performs no better than chance; a c-statistic of 0.7 to 0.8 indicates modest or acceptable discriminative ability, and a threshold of greater than 0.8 indicates good discriminative ability [16].
A calibration plot was plotted comparing predicted versus actual probabilities to those provided for subgroups in the original manuscripts. A 45 degree line would indicate perfect agreement between the predicted probabilities by the model, and the actual, or observed, probabilities in our cohort. Both prediction models presented clinical profiles based on total scores (e.g. A, B, C and where applicable D groups), which were replicated in our data. Both Kaplan Meier curves were subsequently stratified by clinical profile. We used the log rank test to test for differences in survival between strata.
Results
A total cohort of 250 patients was included in the study, of which 128 patients were eligible for external validation of the prediction model by Van der Linden, and all 250 were eligible for external validation of the model by Bollen. Detailed patient and treatment characteristics of the total study cohort are shown in (Table 1). Figure 1 shows the Kaplan-Meier curve for the cohort.
Table 1: Baseline characteristics total study population (n=250).
|
Gender Male Female |
N (%) 143 (57.2%) 107 (42.8%) |
|
Age at time of RT (mean +SD y) |
69 ±10.9 |
|
Radiation field Cervical Cervicothoracic Thoracic Thoracolumbal Lumbal Multiple locations |
16 (6.4%) 11 (4.4%) 91 (36.4%) 30 (12%) 84 (33.6%) 18 (7.2%) |
|
Radiation dose 1x8 Gy 5x4 Gy 10x3 Gy 13x3Gy |
166 (66.4%) 76 (30.4%) 6 (2.4%) 2 (0.8%) |
|
Treatment RT only RT and surgery |
242 (96.8%) 8 (3.2%) |
|
VAS pretreatment (mean SD cm) valid missing |
6.5±2.4 176 (70.4%) 74 (29.6%) |
|
Number spinal metastases 1 or 2 multiple |
107 (42.8%) 143 (57.2%) |
|
Visceral metastases present not present |
96 (38.4%) 154 (61.6%) |
|
Brain metastases present not present |
11 (4.4%) 239 (95.6%) |
|
Lymphogenic metastases present not present |
114(45.6%) 136(54.4%) |
|
Clinical profile Favorable Moderate Unfavorable |
50 (20%) 71 (28.4%) 129 (51.6%) |
|
Breast cancer (total N=49) Hormone receptorstatus ER/PR positive, Her2 positive ER/PR positive, Her2 negative ER/PR negative, Her2 positive ER/PR negative, Her2 negative ER+/PR-, Her2 negative ER+/PR-, Her2 postive ER+/PR+, Her2 unknown ER negative, Pr+, Her2 negative |
4 (1.6%) 28 (11.2%) 2 (0.8%) 3 (1.2%) 9 (3.6%) 1 (0.4%) 1 (0.4%) 1 (0.4%) |
|
Lung cancer type (total N=76) NSCLC SCLC not defined |
62 (81.6%) 12 (15.8%) 2 (2.6%) |
|
EGFR/ALK mutation NSCLC present not present unknown KRAS mutation NSCLC present not present unknown |
6 (9.6%) 24 (38.7%) 32 (51.6%)
18 (29%) 8 (13%) 36 (58%) |
|
KPS 80-100 10-70 |
105 (42%) 145 (58%) |
I External Validation of the Prediction Model by Bollen
The median follow-up time of survivors was 42.3 months. The median survival time for the 250 patients in this external validation cohort was 5.9 months (95% CI: 4.2 –8). Figure 1 shows the survival curve for the external validation cohort we used for the model by Bollen. When using the suggested simplified risk score (groups A through D), the C-statistic was 0.67 (95% CI: 0.63 –0.71). The Kaplan Meier curves stratified by this simplified score is shown in (Figure 2). The four groups do not overlap and make a clear distinction between low- and high risk of survival. The 1-year survival for the four groups are 92.9% (95% CI: 59.1 – 99.0), 63.6% (95% CI: 49.5 – 74.8), 28.9% (95% CI: 20.5 – 37.7), and 10.4% (95% CI: 4.9 – 18.4) for risk group A, B, C, and D, respectively. The calibration plot comparing predicted survival according to the Bollen model versus the actual survival probability observed in the external validation cohort is shown in (Figure 3). It shows good agreement between survival probabilities according to the manuscript by Bollen and those in the external validation cohort.

Figure 1: Kaplan Meier curve of the overall survival in the external validation cohort for the Van der Linden prediction model.
*The grey area denotes the 95% confidence band.
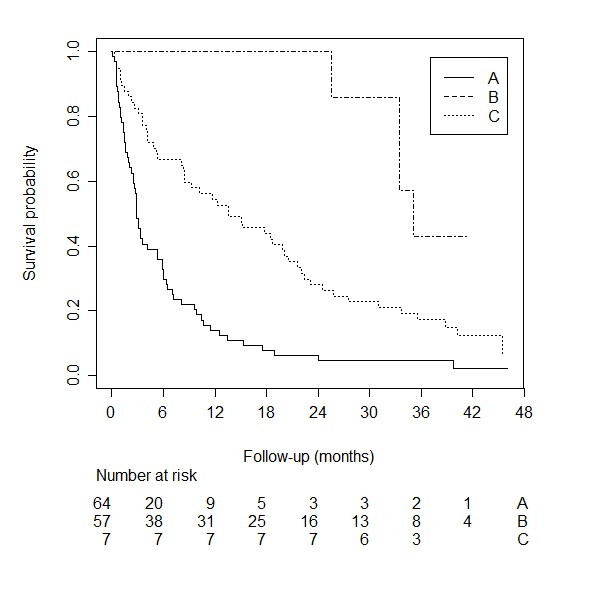
Figure 2: Kaplan Meier curve stratified by clinical profile for the van der Linden prediction model.

Figure 3: Calibration plots with predicted versus actual probabilities.
II External Validation of the Prediction Model by van der Linden
The patients who survived during the course of follow-up had a median follow-up time of 41.4 months. The median survival time for the 128 patients was 6.2 months (95% confidence interval [CI]: 4.2 – 9.6). Figure 4 shows the survival curve for the external validation cohort we used for the model by van der Linden.
A simplified risk score was published by creating three risk groups: A, B, and C. The C-statistic for this simplified risk score was: 0.65 (95% CI: 0.60–0.71). A Kaplan Meier curve stratified by the simplified risk score is shown in (Figure 5). It shows that the three risk groups do not overlap and that there is a substantial difference in survival between the three groups. The 1-year survival probability for risk group A, B, and C are 14.1% (95% CI: 6.9 – 23.7), 54.4% (95% CI: 40.7 – 66.2), and 100% (95% CI: 100 – 100). The calibration plot is shown in (Figure 3). It shows the survival probability for each group according to the original publication on the x-axis, and the actual survival probability in our cohort on the y-axis. The simplified risk score by van der Linden yields underestimated risks compared to patients in the external validation cohort.
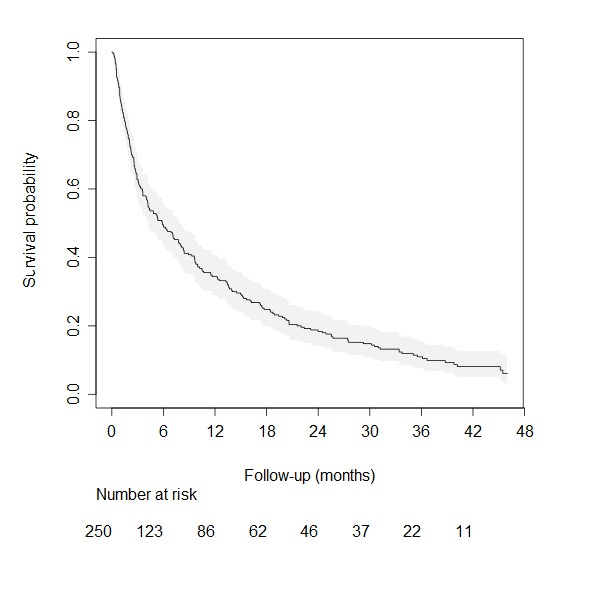
Figure 4: Kaplan Meier curve of the overall survival in the external validation cohort for the Bollen prediction model.
*The grey area denotes the 95% confidence band.
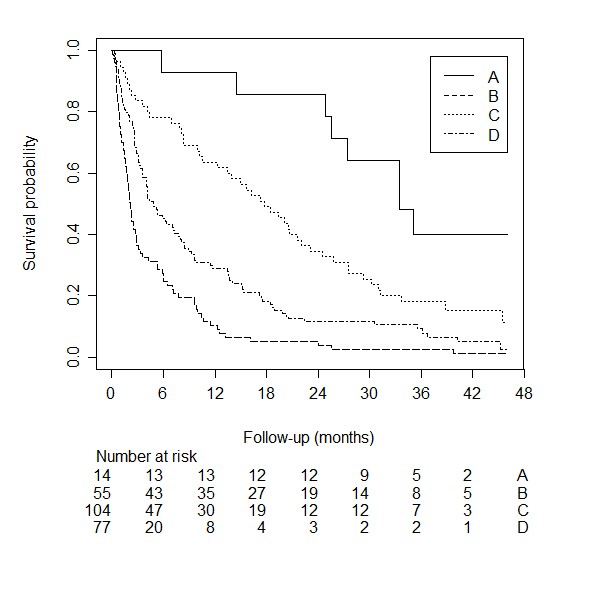
Figure 5: Kaplan Meier curve stratified by clinical profile for the Bollen prediction model.
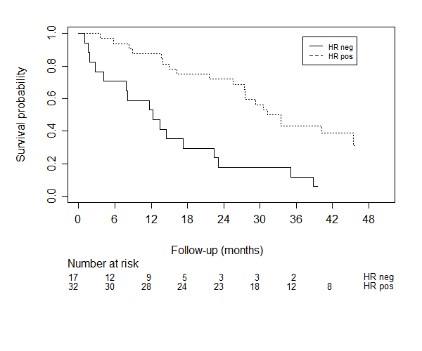
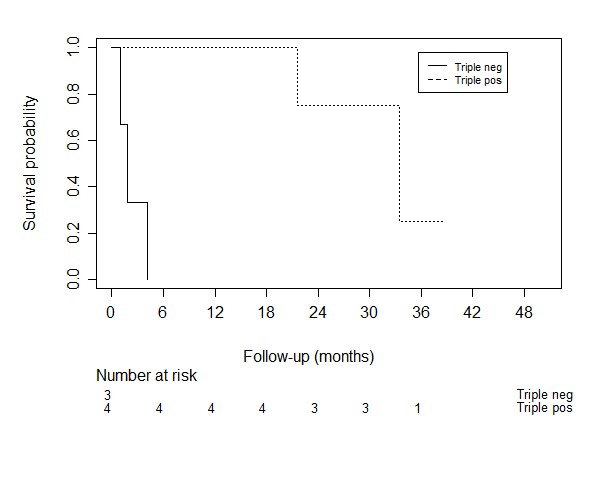
Figure 6: Kaplan meier curves for the survival of breast cancer patients with different tumor expressions.
Prognostic Factors
Impact of brain or visceral metastases was significantly associated with survival, the presence of brain metastases showed an HR of 3.8 (95% CI: 2.0 – 7.1, p < 0.001) and HR of 1.34 for visceral metastases (95% CI: 1.0 – 1.8, p = 0.030). VAS score of pain at baseline, which was scored as a continuous variable, was not significantly associated with survival (HR 1.1, 95% CI: 0.94 – 1.07, p = 0.971). We found no evidence of an effect on survival for the presence of a pathologic fracture (HR = 0.99, 95% CI: 0.72 – 1.34, p = 0.926), spinal cord compression (HR = 1.03, 95% CI: 0.76 – 1.30, p = 0.866), or the presence of lymphogenic metastases (HR = 1.06, 95% CI: 0.82 – 1.38, p = 0.651). In breast cancer patients different tumor expressions were associated with survival (C-statistic: 0.67), as shown in (Figure 6). In lung cancer patients, we did not find an association between different tumor types (non-small cell versus small cell, HR = 0.95, 95% CI: 0.50-1.82). Because of few events, we did not reach significant power to perform a survival analysis for the epidermal growth factor (EGFR)/anaplastic lymphoma kinase (ALK)/K-ras (KRAS) mutations.
Discussion
Although the analyzed models are relatively simple to use in clinical practice and impose no additional burden on both patient and physician, the existing models fall short in performance. We hypothesize that the incorporation of histological and molecular subtypes of the primary tumor would yield more discriminative ability. Especially for the most common primary malignancies of SBM patients, like breast- and lung cancer. We think that there is substantial heterogeneity between these subgroups with different effects on treatment and variation of median survival within the same primary cancer, with a significant part of patients who may benefit from more aggresive treatment. In our study we showed that the C-statistic for the variable tumor expression in breast cancer was 0.67, indicating moderate discriminative ability. A study of Tan et al. showed that the breast tumor histological subtype was of crucial importance for the prognostication of breast cancer patients with spinal metastases [17]. The revised Tokuhashi score 2014 suggested that hormone receptor negative and triple-negative breast cancer patients should be given a modified Tokuhashi histological score of 3 rather than a score of 5. Besides these interesting findings for breast cancer, Kumar et al. found differences in prognosis in spinal metastases patients with small cell lung cancer (SCLC) and non-small cell lung cancer (NSCLC) [18].
While the median survival time of SCLC patients was 2.4 months (95% CI 2.13-2.68) with a 6-month survival of 16.7%, the median survival of NSCLC patients was 5.1 months (3.78-6.41) with a 6-month survival of 47.5%. In addition, patients with an EGFR mutation and patients on a combinationtherapy of EGFR tyrosine kinase inhibitors and platinum doublet chemotherapy reached a median survival of 13.3 months and a 6-month survival of 72.7%, which was significantly better than the overall survival of all types of lung cancer (6-month survival up to 44.4%). In our study sample, only 6 patients (9.6%) had a confirmed epidermal growth factor (EGFR)/anaplastic lymphoma kinas (ALK) mutation. Because of the small number of patients in our cohort, we did not have significant statistical power to perform a survival analysis for these prognostic factors. A recent systematic review. suggested that prognostication for patients with spinal metastases should be based on an accurate primary tumor classification, combined with a performance score, in which the added benefit of visceral metastases and other possible predictive factors should be studied further [19]. In our study brain and visceral metastases were significantly associated with survival, with an HR of 3.8 for brain metastases and HR of 1.34 for visceral metastases.
A review of Gotay et al. showed that in 36 of the 39 cancer studies (metastatic and non-metastatic disease) at least one patient-reported outcome was significantly associated with survival in the multivariate analysis [19]. In 7 of these 36 studies pain was a significant patient reported outcome related to survival. Also, in the study of Westhoff et al. a higher patient reported pain score was associated with a higher risk of death. This study used follow-up questionnaires consisting, amongst others, of a pain scale. Pain was measured using an 10-point numeric rating scale, ranging from 0 (no pain) to 10 (the worst pain imaginable) [21]. However, in our multivariable analysis, patient-reported pain score did not contribute to the prediction of survival. We used reported VAS scores in the electronic medical records of our study patients. Moreover, tumor biology information could add more value. Features derived from radiomic analysis can provide tumor biology in vivo information that is complementary to other relevant clinical information in prediction of survival and can augment current available clinical decision support systems. With this method, it is possible to extract diverse quantitative features from digital images from CT or MRI and make a correlation with pathologic substrates, which can be used as imaging biomarkers. Various studies have shown the potential of radiomics features in prediction of survival [22-24].
The main strength of the current study is that this is the first study to externally validate and compare two prediction models recommended by the Dutch Guideline Database Oncoline. The retrospective design is a limitation of our study. Additionally, the relatively small patient cohort restricted the power and hampered analysis of specific prognostic variables like EGFR mutation, which may be relevant. Only 48.4% of our lung cancer patients underwent EGFR testing, and although this testing rate is in line with the worldwide literature, the testing rate is still low [25].
In conclusion we have externally validated two existing prediction models. Although the models successfully grouped patients into lower- and higher-risk strata, accurate individualized prediction remains suboptimal. A slightly better performance in discrimination and calibration is found for the Bollen model. Caution is warranted, when making individual clinical decisions based on the analyzed prediction models. In our study we found an essential predictive impact of overall visceral and brainmetastases. Besides, breast tumor subtypes based on immunohistochemistry markers, seem to be of importance for the prognostication of breast cancer patients with SBM.
Conflicts of Interest
None.
Article Info
Article Type
Research ArticlePublication history
Received: Fri 31, Jan 2020Accepted: Sat 15, Feb 2020
Published: Fri 28, Feb 2020
Copyright
© 2023 I. Sanli. This is an open-access article distributed under the terms of the Creative Commons Attribution License, which permits unrestricted use, distribution, and reproduction in any medium, provided the original author and source are credited. Hosting by Science Repository.DOI: 10.31487/j.COR.2020.02.05
Figures & Tables
Table 1: Baseline characteristics total study population (n=250).
|
Gender Male Female |
N (%) 143 (57.2%) 107 (42.8%) |
|
Age at time of RT (mean +SD y) |
69 ±10.9 |
|
Radiation field Cervical Cervicothoracic Thoracic Thoracolumbal Lumbal Multiple locations |
16 (6.4%) 11 (4.4%) 91 (36.4%) 30 (12%) 84 (33.6%) 18 (7.2%) |
|
Radiation dose 1x8 Gy 5x4 Gy 10x3 Gy 13x3Gy |
166 (66.4%) 76 (30.4%) 6 (2.4%) 2 (0.8%) |
|
Treatment RT only RT and surgery |
242 (96.8%) 8 (3.2%) |
|
VAS pretreatment (mean SD cm) valid missing |
6.5±2.4 176 (70.4%) 74 (29.6%) |
|
Number spinal metastases 1 or 2 multiple |
107 (42.8%) 143 (57.2%) |
|
Visceral metastases present not present |
96 (38.4%) 154 (61.6%) |
|
Brain metastases present not present |
11 (4.4%) 239 (95.6%) |
|
Lymphogenic metastases present not present |
114(45.6%) 136(54.4%) |
|
Clinical profile Favorable Moderate Unfavorable |
50 (20%) 71 (28.4%) 129 (51.6%) |
|
Breast cancer (total N=49) Hormone receptorstatus ER/PR positive, Her2 positive ER/PR positive, Her2 negative ER/PR negative, Her2 positive ER/PR negative, Her2 negative ER+/PR-, Her2 negative ER+/PR-, Her2 postive ER+/PR+, Her2 unknown ER negative, Pr+, Her2 negative |
4 (1.6%) 28 (11.2%) 2 (0.8%) 3 (1.2%) 9 (3.6%) 1 (0.4%) 1 (0.4%) 1 (0.4%) |
|
Lung cancer type (total N=76) NSCLC SCLC not defined |
62 (81.6%) 12 (15.8%) 2 (2.6%) |
|
EGFR/ALK mutation NSCLC present not present unknown KRAS mutation NSCLC present not present unknown |
6 (9.6%) 24 (38.7%) 32 (51.6%)
18 (29%) 8 (13%) 36 (58%) |
|
KPS 80-100 10-70 |
105 (42%) 145 (58%) |
*The grey area denotes the 95% confidence band.
*The grey area denotes the 95% confidence band.

References
- Xia W, Yu X, Mao Q, Xia W, Wang A et al. (2017) Improvement of survival for non-small cell lung cancer over time. Onco Targets Ther 10: 4295-4303. [Crossref]
- Foukakis, T Fornander, T Lekberg, H Hellborg, J Adolfsson et al. (2010) Age-specific trends of survival in metastatic breast cancer: 26 years longitudinal data from a population-based cancer registry in Stockholm Sweden. Breast Cancer Res Treat 130: 553-560. [Crossref]
- Groenen KHJ, van der Linden YM, Brouwer T, Dijkstra SPD, de Graeff A et al. (2018) The Dutch national guideline on metastases and hematological malignancies localized within the spine; a multidisciplinary collaboration towards timely and proactive management. Cancer Treat Rev 69: 29-38. [Crossref]
- Tokuhashi Y, Matsuzaki H, Oda H, Oshima M, Ryu J (2005) A revised scoring system for preoperative evaluation of metastatic spine tumor prognosis. Spine (Phila Pa 1976) 30: 2186-2191. [Crossref]
- Rades D, Hueppe M, Schild SE (2013) A score to identify patients with metastatic spinal cord compression who may be candidates for best supportive care. Cancer 119: 897-903. [Crossref]
- Tomita K, Kawahara N, Kobayashi T, Yoshida A, Murakami H et al. (2001) Surgical strategy for spinal metastases. Spine (Phila Pa 1976) 26: 298-306. [Crossref]
- Leithner A, Radl R, Gruber G, Hochegger M, Leithner K et al. (2008) Predictive value of seven preoperative prognostic scoring systems for spinal metastases. Eur Spine J 17: 1488-1495. [Crossref]
- Bauer HC, Wedin R (1995) Survival after surgery for spinal and extremity metastases. Prognostication in 241 patients. Acta Orthop Scand 66: 143-146. [Crossref]
- Van der Linden YM, Dijkstra PDS, Vonk E, Marijnen CA, Leer JW (2005) Prediction of survival in patients with metastases in the spinal column: results based on a randomized trial of radiotherapy. Cancer 103: 320-328. [Crossref]
- Bartels RH, Feuth T, van der Maazen R, Verbeek AL, Kappelle AC et al. (2007) Development of a model with which to predict the life expectancy of patients with spinal epidural metastasis. Cancer 110: 2042-2049. [Crossref]
- Bollen L, Van der Linden YM, Pondaag W, Fiocco M, Pattynama BP et al. (2014) Prognostic factors associated with survival in patients with symptomatic spinal bone metastases: a retrospective cohort study of 1043 patients. Neuro Oncol 16: 991-998. [Crossref]
- Usher-Smit JA, Harshfield A, Saunders CL, Sharp SJ, Emery J et al. (2018) External validation of risk prediction models for incident colon cancer using UK Biobank. Br J Cancer 118: 750-759. [Crossref]
- Bollen L, Dijkstra SPD, Bartels RHMA, de Graeff A, Poelma DLH et al.(2018) Clinical management of spinal metastases-The Dutch national guideline. Eur J Cancer 104: 81-90. [Crossref]
- Steyerberg EW (2009) Clinical Prediction Models. Springer, New York.
- Harrell FE (2001) Regression modeling strategies. Springer, New York.
- Tan KA, Tan JH, Zaw AS, Tan JYH, Hey HWD et al. (2018) Evaluation of Prognostic Factors and Proposed Changes to the Modified Tokuhashi Score in Patients With Spinal Metastases From Breast Cancer. Spine (Phila Pa 1976) 43: 512-519. [Crossref]
- Schneeweiss S, Seeger JD, Maclure M, Wang PS, Avorn J et al. (2001) Performance of comorbidity scores to control for confounding in epidemiologic studies using claims data. Am J Epidemiol 154: 854-864. [Crossref]
- Kumar N, Tan KA, Tan JH, Zaw AS, Hey HWD et al. (2018) The Influence of Histologic Subtype in Predicting Survival of Lung Cancer Patients With Spinal Metastases. Clin Spine Surg 31: E1-E7. [Crossref]
- Bollen L, Jacobs WCH, Van der Linden YM, Van der Hel O, Taal W et al. (2018) A systematic review of prognostic factors predicting survival in patients with spinal bone metastases. Eur Spine J 27: 799-805. [Crossref]
- Gotay CC, Kawamoto CT, Bottomley A, Efficace F (2008) The prognostic significance of patient-reported outcomes in cancer clinical trials. J Clin Oncol 26: 1355-1363. [Crossref]
- Westhoff PG, de Graeff A, Monninkhof EM, Bollen L, Dijkstra SP et al. (2014) Dutch Bone Metastasis Study Group. An easy tool to predict survival in patients receiving radiation therapy for painful bone metastases. Int J Radiat Oncol Biol Phys 90: 739-747. [Crossref]
- He B, Zhao W, Pi JY, Han D, Jiang YM et al. (2018) A biomarker basing on radiomics for the prediction of overall survival in non-small cell lung cancer patients. Respir Res 19: 199. [Crossref]
- Sun W, Jiang M, Dang J, Chang P, Yin FF (2018) Effect of machine learning methods on predicting NSCLC overall survival time based on Radiomics analysis. Radiat Oncol 13: 197. [Crossref]
- Park H, Lim Y, Ko ES, Cho HH, Lee JE et al. (2018) Radiomics Signature on Magnetic Resonance Imaging: Association with Disease-Free Survival in Patients with Invasive Breast Cancer. Clin Cancer Res 24: 4705-4714. [Crossref]
- Enewold L, Thomas A (2016) Real-World Patterns of EGFR Testing and Treatment with Erlotinib for Non-Small Cell Lung Cancer in the United States. PLoS One 11: e0156728. [Crossref]