Prognostic and Predictive Value of the Tumor-Stroma Ratio in STAGE II Colon Cancer
A B S T R A C T
Background: Tumor-stroma ratio (TSR) is an independent prognosticator in colon cancer.
Objective: We set out to investigate the predictive power, as well as to validate the prognostic power of TSR in stage II colon cancer patients. Better identification of patients who could benefit from adjuvant chemotherapy remains an important issue in stage II disease.
Methods: TSR was microscopically determined on haematoxylin and eosin-stained primary tumor tissue slides of 212 patients who received either adjuvant chemotherapy or surveillance after curative resection in a prospective randomized clinical trial (ABCSG-91).
Results: Stroma-high tumors were associated with significantly more cancer-related death ((CaDeath) HR 2.30, 95% CI 1.05−5.03; p=0.037) and significantly shorter distant recurrence-free survival ((DRFS) HR 2.32, 95% CI 1.10−4.87; p=0.027) compared to stroma-low tumors. Backward multivariate Cox-regression analysis demonstrated TSR as an independent prognosticator for DRFS (p=0.027) and CaDeath (p=0.031). TSR did not validate as a predictive biomarker; CaDeath (HR 0.87, 95% CI 0.18−4.17; p=0.87), DRFS (HR 0.76, 95% CI 0.17−3.36; p=0.71) and OS (HR 0.96, 95% CI 0.29−3.21; p=0.95) for the type of chemotherapy given in ABCSG-91.
Conclusions: TSR, an easily applicable and inexpensive observer-based method, is an independent predictor of poor prognosis in stage II colon cancer. Predictive value for adjuvant 5-FU/leucovorin could not be demonstrated.
Keywords
Colon cancer, tumor stroma, biomarker, treatment, prognosis, prediction
Introduction
The worldwide cancer incidence and mortality are rapidly growing, with an estimated 1.8 million new colorectal cancer cases and 881.000 deaths in 2018. Making colon cancer the third most common cancer [1]. This increase in incidence is partly due to countries undergoing major socioeconomic developments, influence of westernization (i.e. dietary patterns, alcohol consumption, smoking and obesity) and early detection and screening programs [2-4]. Although the screening programs generally lead to a temporary increase of newly detected colorectal tumors, which are mostly early-stage disease with favorable prognosis, they do have implications on subsequent treatment decisions. Currently, European guidelines recommend adjuvant systemic chemotherapy after primary tumor resection for stage III and “high-risk” stage II patients. Hereby, “high-risk” is defined by presence of at least one of the following features: vascular, lymphatic or perineural invasion, poorly differentiated tumors, tumor presentation with perforation or obstruction, pT4 stage and < 12 lymph nodes sampled [5, 6].
However, there is much debate on which high-risk stage II patients might benefit from adjuvant chemotherapy nowadays [7]. The issue is raised whether treatment decisions should be tailored to individual tumor characteristics in this group with localized disease since convincing evidence on adjuvant treatment benefit has not been proven in the general stage II disease group [8-10]. Risk assessment is presently performed by consideration of known tumor-related prognostic factors. Novel risk factors, such as MMR status, microRNA and BRAF mutational status, have proven to be prognostic, whereas the availability of predictors for chemotherapy derived benefits are scarce [11-14]. Promising results have been reported for markers like CDX2 and circulating tumor DNA. However, these are still far from routine clinical implementation [15, 16]. In the past years, our research group has repeatedly demonstrated that the amount of intratumoral stroma, referred to as the tumor-stroma ratio (TSR), is an independent prognosticator in colon cancer [17-21]. Most of these studies were performed in pooled stage I-III cohorts and reported subgroup analyses of stage II patients. We will assess if the TSR provides predictive information, which could serve as a marker for adjuvant therapy in this group and validate the prognostic power of the TSR in a group of exclusively stage II colon cancer patients.
Material and Methods
I Study Design
Between 1993-2003, the Austrian Breast and Colorectal Cancer Study Group (ABCSG) included patients for various research purposes. As part of this initiative, a multicentre prospective randomized trial investigating the impact of adjuvant chemotherapy in histologically proven stage II colon cancer (defined as T3-4, N0, M0) was performed in 2007. Thirty-one hospitals were involved in this trial, whereby the protocol was approved by local ethical comities of the participating hospitals.
For the original study, a total of 535 patients were included and randomized in two post-operative treatment groups; 1) 5-fluorouracil (5-FU) and leucovorin (LV), once weekly for 6 weeks in each 8-week cycle for a total of 7 chemotherapy cycles (=56 weeks of therapy); 2) surveillance only. Follow-up was performed every 3 months during the first year, followed by every 6 months during year 2-5 and once yearly until year 10 after randomization. For more details with regard to the original study design, see Schippinger et al. [22]. Patients from whom haematoxylin and eosin-stained (H&E) tumour tissue slides were available, were eligible for the currently described study. Since archival material was used in an anonymized manner, no additional informed consent was required.
II Histopathological Scoring of Tumour-Stroma Ratio
For all available H&E primary tumour tissue slides, the TSR was determined in a blinded manner by two investigators (GP, SV). Histopathological scoring was performed according to the method as described by Mesker et al., whereby using a 2.5x or 5x objective, the area with the highest amount of stroma was microscopically selected. Next, using a 10x objective, image fields where neoplastic cells were present at all borders were scored. Scoring percentages were given per 10-fold (10%, 20% etc.) per image field. Subsequently, two groups were defined: stroma-low (≤ 50%) and stroma-high (>50%). This cut-off has previously proven to have a maximum discriminative power [18].
III Statistical Analysis
Statistical analyses were performed with SPSS software version 25. Interobserver variability for histopathological scoring was tested using Cohen’s kappa coefficient (ĸ). The χ2 test was used to compare statistical differences among categorical variables between the stroma-low and stroma-high group. For numerical variables, the unpaired t-test or Mann-Whitney U test was used, depending on the normality of the distribution. For time-to-event analyses, the Kaplan Meier method and log-rank test were used. Distant recurrence-free survival (DRFS) was defined as the interval between the date of randomization and date of last visit or date of distant-recurrence. Cancer-related death (CaDeath) was defined as the interval between the date of randomization and date of last visit or date of death caused by colon cancer. Overall survival (OS) was defined as the interval between randomization and date of last visit and/or death by any cause. Univariate and multivariate analyses were performed by using a Cox-regression model, whereby a backward selection model was applied for the multivariate analyses. Predictive analyses were performed using a Cox-proportional hazard model with interaction term between TSR and the treatment groups.
Results
I Baseline Characteristics
The original trial performed by ABCSG included 535 patients. A total of 212 histological samples from this group were available for microscopic scoring in the current study. Upon scoring, baseline characteristics were added. Clinical data were not available from 34 patients, causing the final study population to consist of 174 patients with 88 patients (50.6%) in the 5-FU/LV group and 86 patients (49.4%) in the surveillance group, respectively. Baseline characteristics were evenly balanced between the two groups without significant differences. In total, 60 (34.5%) of the 174 patients died during a median follow-up period of 11.5 years. Table 1 provides a detailed description of all characteristics. Furthermore, there were no significant differences between this subset and the original ABCSG study population (data not shown).
Table 1: Baseline characteristics.
|
|
Stroma-low |
Stroma-high |
|
|
|
N = 138 (%) |
N = 36 (%) |
P-value |
|
Age in years |
|||
|
Median (range) |
65.7 (35.4 - 78.0) |
64.2 (37.5 - 77.2) |
0.27 |
|
Gender |
|||
|
Female |
65 (47.1) |
17 (47.2) |
0.99 |
|
Male |
73 (52.9) |
19 (52.8) |
|
|
Therapy |
|||
|
5-FU/LV |
70 (50.7%) |
18 (50.0%) |
0.94 |
|
Surveillance |
68 (49.3%) |
18 (50.0%) |
|
|
T stage |
|||
|
T3 |
118 (85.5) |
26 (72.2) |
0.06 |
|
T4 |
20 (14.5) |
10 (27.8) |
|
|
Grade |
|||
|
G1 and G2 |
113 (81.9) |
28 (77.8) |
0.58 |
|
G3 and G4 |
25 (18.1) |
8 (22.2) |
|
|
Tumor location |
|||
|
Coecum and right colon |
35 (25.4) |
7 (19.4) |
0.67 |
|
Sigmoid and left colon |
69 (50.0) |
18 (50.0) |
|
|
Flexures and transverse colon |
34 (24.6) |
11 (30.6) |
TSR: Tumor-Stroma Ratio; 5-FU: 5-Fluorouracil; LV: leucovorin.

Figure 1: Kaplan-Meier curves for survival endpoints according to TSR category:(A) Distant recurrence-free survival, (B) Cancer-related death, (C) Overall survival. Blue line = stroma-low; Red line = stroma-high.
Table 2: Univariate and multivariate analyses.
|
|
|
Distant recurrence-free survival |
|
|
|
Cancer-related death |
|
|
|
Overall survival |
|
|
|
|
|
|
Univariate |
|
Multivariate |
|
Univariate |
|
Multivariate |
|
Univariate |
|
Multivariate |
|
|
|
N= |
HR (95% CI) |
P- value |
HR (95% CI) |
P- value |
HR (95% CI) |
P- value |
HR (95% CI) |
P- value |
HR (95% CI) |
P- value |
HR (95% CI) |
P- value |
|
Age (mean) |
174 |
0.98 (0.953 - 1.017) |
0.338 |
|
|
0.99 (0.960 - 1.029) |
0.721 |
|
|
1.04 (1.011 - 1.069) |
0.006 |
1.04 (1.015-1.070) |
0.002 |
|
Gender |
|
|
|
|
|
|
|
|
|
|
|
|
|
|
Male |
92 |
0.65 (0.314 - 1.333) |
0.238 |
|
|
0.49 (0.224 - 1.069) |
0.073 |
|
|
1.02 (0.612 - 1.693) |
0.947 |
|
|
|
Female |
82 |
|
|
|
|
|
|
|
|
|
|
|
|
|
Grade |
|
|
|
|
|
|
|
|
|
|
|
|
|
|
G1 and G2 |
141 |
0.49 (0.147 - 1.603) |
0.236 |
|
|
0.54 (0.163 - 1.793) |
0.314 |
|
|
0.79 (0.388 - 1.604) |
0.512 |
|
|
|
G3 and G4 |
33 |
|
|
|
|
|
|
|
|
|
|
|
|
|
T stage |
|
|
|
|
|
|
|
|
|
|
|
|
|
|
T3 |
144 |
0.73 (0.255 - 2.096) |
0.561 |
|
|
1.10 (0.417 - 2.907) |
0.846 |
|
|
1.32 (0.716 - 2.448) |
0.37 |
|
|
|
T4 |
30 |
|
|
|
|
|
|
|
|
|
|
|
|
|
Tumor location |
|
|
|
|
|
|
|
|
|
|
|
|
|
|
Caecum and right colon |
42 |
Reference |
|
|
|
Reference |
|
|
|
Reference |
|
|
|
|
Sigmoid and left colon |
87 |
0.60 (0.246 - 1.474) |
0.267 |
|
|
0.34 (0.136-0.827) |
0.018 |
0.32 (0.131-0.796) |
0.014 |
0.38 (0.205-0.691) |
0.002 |
0.36 (0.196-0.661) |
0.001 |
|
Flexures and transverse colon |
45 |
1.08 (0.425 - 2-730) |
0.875 |
|
|
0.62 (0.246-1.583) |
0.321 |
0.56 (0.220-1.1435) |
0.228 |
0.72 (0.382-1.371) |
0.321 |
0.78 (0.412-1.482) |
0.45 |
|
Therapy |
|
|
|
|
|
|
|
|
|
|
|
|
|
|
Surveillance |
86 |
1.06 (0.518 - 2.175) |
0.871 |
|
|
1.01 (0.476 - 2.153) |
0.976 |
|
|
0.89 (0.536 - 1.476) |
0.651 |
|
|
|
5-FU / LV |
88 |
|
|
|
|
|
|
|
|
|
|
|
|
|
TSR |
|
|
|
|
|
|
|
|
|
|
|
|
|
|
Stroma-low |
138 |
2.32 (1.102 - 4.872) |
0.027 |
2.32 (1.102 - 4.872) |
0.027 |
2.30 (1.054 - 5.027) |
0.037 |
2.38 (1.082-5.220) |
0.031 |
1.25 (0.685 - 2.271) |
0.47 |
|
|
|
Stroma-high |
36 |
|
|
|
|
|
|
|
|
|
|
|
|
II Tumor-Stroma Ratio
Two hundred and twelve H&E tissue slides were scored for TSR. Four samples (1.9%) were excluded due to the absence of the material or an insufficient amount of invasive tumor tissue for scoring. Finally, 163 (76.9%) were scored as stroma-low tumors and 45 (21.1%) as stroma-high tumors. The interobserver agreement showed a good level of agreement for TSR scoring (κ= 0.81) Noteworthy, as previously mentioned, clinical data was not available from 34 patients. Hence, the final study population comprised 174 patients.
III Prognostic Value of TSR
In total, 138 (79.3%) primary tumors were scored as stroma-low and 36 (20.7%) as stroma-high. Patients with stroma-high tumors experienced significantly more CaDeath (HR 2.30 (95% CI 1.05−5.03; p= 0.037)) and had a shorter DRFS (HR 2.32 (95% CI 1.10−4.87; p= 0.027)) compared to patients with stroma-low tumors. A survival difference was ruled out for OS (HR 1.25, 95% CI 0.69−2.27; p= 0.470) (Figure 1). After 10 years of follow-up, 10 (27.8%) patients with stroma-high tumors died of a cancer-related cause versus 17 (12.3%) patients with stroma-low tumors, whereas for distant recurrence, this was 11 (30.6%) patients and 19 (13.8%) patients, respectively. Multivariate analyses validated the TSR as an independent prognosticator for DRFS (HR 2.32 (95% CI 1.10−4.87; p= 0.027)), as well as for CaDeath (HR 2.38 (95% CI 1.08−5.22; p= 0.031)), but not for OS. Additionally, the backward model revealed that tumor location also retained its prognostic power with respect to CaDeath and OS (Table 2).
IV Predictive Value of TSR
Within the 5-FU/LV group, 70 (79.9%) patients had a stroma-low tumor and 18 (20.5%) a stroma-high tumor. For the surveillance group, this was 68 (79.1%) for the former and 18 (20.9%) for the latter category (Table 1). The time-to-event analysis demonstrated no significant differences in survival between stroma-high and stroma-low patients amongst the two treatment arms (Figure 2). Predictive analysis ruled out an interaction between TSR and therapy with respect to CaDeath (HR 0.87 (95% CI 0.18−4.17; p= 0.87)), DRFS (HR 0.76 (95% CI 0.17−3.36; p= 0.71)) and OS (HR 0.96 (95% CI 0.29−3.21; p= 0.95)). Unfortunately, due to the limited amount of patients who met the ASCO guideline criteria of “high-risk” stage II disease (n= 48), we were unable to perform a formal predictive analysis in this group.
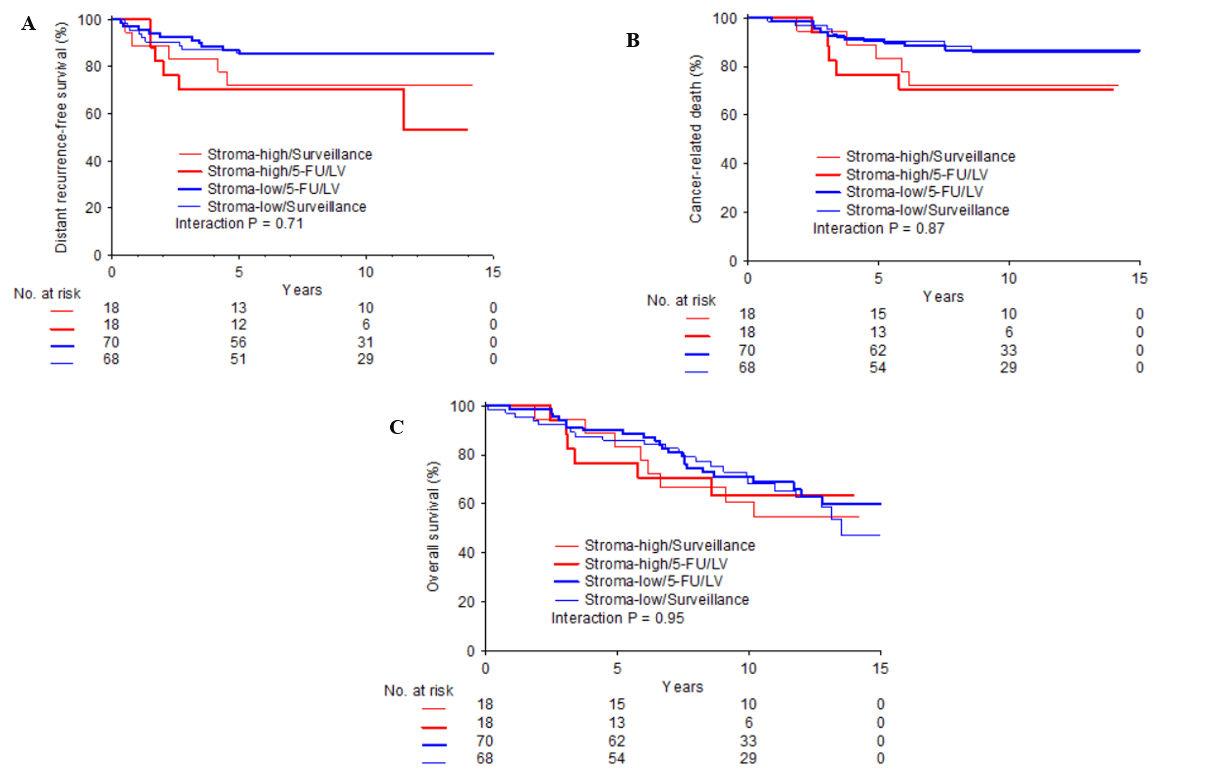
Figure 2: Kaplan-Meier curves for survival endpoints according to TSR category, stratified by treatment arms: Distant recurrence-free survival, (B) Cancer-related death, (C) Overall survival; Blue bold line = stroma-low / 5-FU/LV; Blue fine line = stroma-high/ surveillance; Red bold line = stroma-high / 5-FU/LV; Red fine line = stroma-high / surveillance.
Discussion
The indication of adjuvant chemotherapy for stage II colon cancer patients remains a topic of discussion, since the evidence on therapeutic benefit in this population is inconsistent, despite the availability of pathologically based high-risk disease stratifiers [6-10, 23-26]. The TSR has previously validated as an independent prognosticator in several stages of colon cancer. This led us to further explore the prognostic and predictive qualities of this biomarker in a population of exclusively stage II colon cancer. Our analysis demonstrated that tumors with a high amount of stroma were independently associated with more CaDeath and a shorter DRFS in stage II colon cancer. This was not the case for OS. The latter result was somewhat surprising, since the majority of the TSR studies in colon cancer also reported the TSR as an independent prognosticator for this survival endpoint, either in pooled cohorts or subgroup analyses [17-20, 27-31]. Nonetheless, demonstrating the prognostic power of the TSR with respect to CaDeath in a cohort of solely stage II disease is a valuable result, since this generally represents a group of individuals diagnosed via early detection screening programs and subsequently treated with local surgery. Using the CaDeath provides us with a more precise indicator of therapeutic impact on survival and subsequently gives a better illustration of the discriminating power of a new biomarker.
With respect to our hypothesis, that tumors with more stroma should be considered as more aggressive based on an increased metastatic potential and tumor burden due to an activated tumor microenvironment with consequent enhanced growth factor and cytokine production, it could be suggested that the amount of intratumoral stroma, expressed as the TSR, might be considered as a potential additional risk stratifier [32]. Upon predictive analysis, we presumed that patients with high amounts of intratumoral stroma would have a different response to therapy, at least for the survival endpoints DRFS and CaDeath. However, a predictive value was ruled out for all endpoints. This negative finding was more or less in agreement with results from our previous study in a cohort of stage II and III colon cancer, wherein we could only demonstrate a trend for adjuvant therapeutic survival benefit though this was in relation to chemotherapy and targeted therapy [28]. Based on the reports from Mezheyeuski et al., the suggestion is raised that observer-dependent scoring methods simply might not possess a predictive power with regard to response to adjuvant chemotherapy. In this particular study, the authors investigated the prognostic and predictive capability of multifractal analyses (i.e. a computer-assisted method which quantitatively evaluates the morphological composition of the tumor-stroma interface) versus the histomorphological parameters tumor budding, tumor grade and tumor border configuration. Herein, they demonstrated that like all histomorphological parameters, multifractional analyses validated as an independent prognostic marker in stage II colon cancer. However, only the multifractional analyses contained a predictive capacity and was subsequently able to identify patients who experienced significant improvement of CSS after receiving adjuvant 5-FU [33]. Nevertheless, we feel that we should not abandon the predictive potential of observer-based parameters right away since these methods are generally more cost-effective as well as easier to integrate into current clinical workflows.
Apart from the retrospective design of our study, the chemotherapy regimen of only 5FU/LV, which was administered could be indicated as a second limitation. This regimen is currently considered outdated, ever since it was demonstrated that addition of oxaliplatin to 5-FU/LV significantly increased the disease-free survival in stage II colon cancer [9, 34]. Therefore, we cannot fully extrapolate the results to the current clinical situation. Thirdly, in the current study population, approximately 20% of the tumors were classified as stroma-high, whereas in previous studies, the amount of stroma-high tumors usually ranged between 25-35% [19, 28, 35]. Lastly, we must acknowledge we were unable to perform analyses in the subgroup of “high-risk” patients, a clinically relevant group in need of additional predictive biomarkers.
In conclusion, our study validated an easily applicable and inexpensive method, such as the TSR, as an independent predictor of poor prognosis in stage II colon cancer. This provides the perspective of the implementation of this parameter as an additional prognostic clinical risk stratifier for colon cancer. Prospective studies to validate this are currently pending (NTR7270) [36]. Predictive value of the TSR for adjuvant 5-FU/leucovorin could not be demonstrated.
Acknowledgements
The authors would like to thank Professor Dr. H. Putter for his involvement and advice regarding interpretation of the statistical analyses.
Funding
This research was (financially) supported by “Genootschap Landoed Keukenhof”.
Conflicts of Interest
Dr. Greil reports honoraria, travel funding, and research funding from AbbVie, Amgen, Astra Zeneca, Bristol-Myers Squibb, Celgene, Merck, Merck Sharp & Dohme, Novartis, Takeda, Sandoz, and Roche. Dr. Gnant reports personal fees and non-financial support from Amgen, grants, personal fees and non-financial support from AstraZeneca, personal fees and non-financial support from Celgene, personal fees and non-financial support from Eli Lilly, grants, personal fees and non-financial support from Novartis, personal fees from NanoString Technology, grants and personal fees from Roche, other from Accelsoir, grants and non-financial support from Pfizer, non-financial support from Ipsen. Dr. Filipits reports personal fees and research funding from Astra Zeneca, and personal fees from Bayer, Biomedica, Boehringer Ingelheim, Eli Lilly, Merck Sharp & Dohme, Myriad Genetics Inc., Pfizer, and Roche. No other disclosures are reported.
Ethics Approval
The original study protocol was approved by local ethical review committees. For the current study, archival material was used in an anonymized manner. Therefore, no additional informed consent was required.
Contributions
All authors actively contributed to the paper and take responsibility and accountability for the accuracy and integrity of the work. Conception and design: MF, MG, HG, WM, RT Collection and assembly of data: MF Data analysis and interpretation: GP, SV, MF, SZ, MG Manuscript writing: MF, SZ, MG, HG, WM, RT.
Article Info
Article Type
Research ArticlePublication history
Received: Mon 13, Apr 2020Accepted: Tue 28, Apr 2020
Published: Thu 30, Apr 2020
Copyright
© 2023 Wilma E. Mesker. This is an open-access article distributed under the terms of the Creative Commons Attribution License, which permits unrestricted use, distribution, and reproduction in any medium, provided the original author and source are credited. Hosting by Science Repository.DOI: 10.31487/j.COR.2020.04.12
Figures & Tables
Table 1: Baseline characteristics.
|
|
Stroma-low |
Stroma-high |
|
|
|
N = 138 (%) |
N = 36 (%) |
P-value |
|
Age in years |
|||
|
Median (range) |
65.7 (35.4 - 78.0) |
64.2 (37.5 - 77.2) |
0.27 |
|
Gender |
|||
|
Female |
65 (47.1) |
17 (47.2) |
0.99 |
|
Male |
73 (52.9) |
19 (52.8) |
|
|
Therapy |
|||
|
5-FU/LV |
70 (50.7%) |
18 (50.0%) |
0.94 |
|
Surveillance |
68 (49.3%) |
18 (50.0%) |
|
|
T stage |
|||
|
T3 |
118 (85.5) |
26 (72.2) |
0.06 |
|
T4 |
20 (14.5) |
10 (27.8) |
|
|
Grade |
|||
|
G1 and G2 |
113 (81.9) |
28 (77.8) |
0.58 |
|
G3 and G4 |
25 (18.1) |
8 (22.2) |
|
|
Tumor location |
|||
|
Coecum and right colon |
35 (25.4) |
7 (19.4) |
0.67 |
|
Sigmoid and left colon |
69 (50.0) |
18 (50.0) |
|
|
Flexures and transverse colon |
34 (24.6) |
11 (30.6) |
TSR: Tumor-Stroma Ratio; 5-FU: 5-Fluorouracil; LV: leucovorin.
Table 2: Univariate and multivariate analyses.
|
|
|
Distant recurrence-free survival |
|
|
|
Cancer-related death |
|
|
|
Overall survival |
|
|
|
|
|
|
Univariate |
|
Multivariate |
|
Univariate |
|
Multivariate |
|
Univariate |
|
Multivariate |
|
|
|
N= |
HR (95% CI) |
P- value |
HR (95% CI) |
P- value |
HR (95% CI) |
P- value |
HR (95% CI) |
P- value |
HR (95% CI) |
P- value |
HR (95% CI) |
P- value |
|
Age (mean) |
174 |
0.98 (0.953 - 1.017) |
0.338 |
|
|
0.99 (0.960 - 1.029) |
0.721 |
|
|
1.04 (1.011 - 1.069) |
0.006 |
1.04 (1.015-1.070) |
0.002 |
|
Gender |
|
|
|
|
|
|
|
|
|
|
|
|
|
|
Male |
92 |
0.65 (0.314 - 1.333) |
0.238 |
|
|
0.49 (0.224 - 1.069) |
0.073 |
|
|
1.02 (0.612 - 1.693) |
0.947 |
|
|
|
Female |
82 |
|
|
|
|
|
|
|
|
|
|
|
|
|
Grade |
|
|
|
|
|
|
|
|
|
|
|
|
|
|
G1 and G2 |
141 |
0.49 (0.147 - 1.603) |
0.236 |
|
|
0.54 (0.163 - 1.793) |
0.314 |
|
|
0.79 (0.388 - 1.604) |
0.512 |
|
|
|
G3 and G4 |
33 |
|
|
|
|
|
|
|
|
|
|
|
|
|
T stage |
|
|
|
|
|
|
|
|
|
|
|
|
|
|
T3 |
144 |
0.73 (0.255 - 2.096) |
0.561 |
|
|
1.10 (0.417 - 2.907) |
0.846 |
|
|
1.32 (0.716 - 2.448) |
0.37 |
|
|
|
T4 |
30 |
|
|
|
|
|
|
|
|
|
|
|
|
|
Tumor location |
|
|
|
|
|
|
|
|
|
|
|
|
|
|
Caecum and right colon |
42 |
Reference |
|
|
|
Reference |
|
|
|
Reference |
|
|
|
|
Sigmoid and left colon |
87 |
0.60 (0.246 - 1.474) |
0.267 |
|
|
0.34 (0.136-0.827) |
0.018 |
0.32 (0.131-0.796) |
0.014 |
0.38 (0.205-0.691) |
0.002 |
0.36 (0.196-0.661) |
0.001 |
|
Flexures and transverse colon |
45 |
1.08 (0.425 - 2-730) |
0.875 |
|
|
0.62 (0.246-1.583) |
0.321 |
0.56 (0.220-1.1435) |
0.228 |
0.72 (0.382-1.371) |
0.321 |
0.78 (0.412-1.482) |
0.45 |
|
Therapy |
|
|
|
|
|
|
|
|
|
|
|
|
|
|
Surveillance |
86 |
1.06 (0.518 - 2.175) |
0.871 |
|
|
1.01 (0.476 - 2.153) |
0.976 |
|
|
0.89 (0.536 - 1.476) |
0.651 |
|
|
|
5-FU / LV |
88 |
|
|
|
|
|
|
|
|
|
|
|
|
|
TSR |
|
|
|
|
|
|
|
|
|
|
|
|
|
|
Stroma-low |
138 |
2.32 (1.102 - 4.872) |
0.027 |
2.32 (1.102 - 4.872) |
0.027 |
2.30 (1.054 - 5.027) |
0.037 |
2.38 (1.082-5.220) |
0.031 |
1.25 (0.685 - 2.271) |
0.47 |
|
|
|
Stroma-high |
36 |
|
|
|
|
|
|
|
|
|
|
|
|
References
- Bray F, Ferlay J, Soerjomataram I, Siegel RL, Torre LA et al. (2018) Global cancer statistics 2018: GLOBOCAN estimates of incidence and mortality worldwide for 36 cancers in 185 countries. CA Cancer J Clin 68: 394-424. [Crossref]
- Arnold M, Sierra MS, Laversanne M, Soerjomataram I, Jemal A et al. (2017) Global patterns and trends in colorectal cancer incidence and mortality. Gut 66: 683-691. [Crossref]
- Bonneux L, Barendregt JJ, Looman CW, van der Maas PJ (1995) Diverging trends in colorectal cancer morbidity and mortality. Earlier diagnosis comes at a price. Eur J Cancer 31A: 1665-1671. [Crossref]
- Harriss DJ, Atkinson G, Batterham A, George K, Cable NT et al. (2009) Lifestyle factors and colorectal cancer risk (2): a systematic review and meta-analysis of associations with leisure-time physical activity. Colorectal Dis 11: 689-701. [Crossref]
- Labianca R, Nordlinger B, Beretta GD, Mosconi S, Mandala M et al. (2013) Early colon cancer: ESMO Clinical Practice Guidelines for diagnosis, treatment and follow-up. Ann Oncol 24: vi64-vi72. [Crossref]
- Schmoll HJ, Van Cutsem E, Stein A, Valentini V, Glimelius B et al. (2012) ESMO Consensus Guidelines for management of patients with colon and rectal cancer. a personalized approach to clinical decision making. Ann Oncol 23: 2479-2516. [Crossref]
- Verhoeff SR, van Erning FN, Lemmens VE, de Wilt JH, Pruijt JF (2016) Adjuvant chemotherapy is not associated with improved survival for all high-risk factors in stage II colon cancer. Int J Cancer 139: 187-193. [Crossref]
- Investigators IB (1999) Efficacy of adjuvant fluorouracil and folinic acid in B2 colon cancer. International Multicentre Pooled Analysis of B2 Colon Cancer Trials (IMPACT B2) Investigators. J Clin Oncol 17: 1356-1363. [Crossref]
- Andre T, Boni C, Navarro M, Tabernero J, Hickish T et al. (2009) Improved overall survival with oxaliplatin, fluorouracil, and leucovorin as adjuvant treatment in stage II or III colon cancer in the MOSAIC trial. J Clin Oncol 27: 3109-3116. [Crossref]
- Figueredo A, Charette ML, Maroun J, Brouwers MC, Zuraw L (2004) Adjuvant therapy for stage II colon cancer: a systematic review from the Cancer Care Ontario Program in evidence-based care's gastrointestinal cancer disease site group. J Clin Oncol 22: 3395-3407. [Crossref]
- Sargent DJ, Marsoni S, Monges G, Thibodeau SN, Labianca R et al. (2010) Defective mismatch repair as a predictive marker for lack of efficacy of fluorouracil-based adjuvant therapy in colon cancer. J Clin Oncol 28: 3219-3226. [Crossref]
- Sinicrope FA, Foster NR, Thibodeau SN, Marsoni S, Monges G et al. (2011) DNA mismatch repair status and colon cancer recurrence and survival in clinical trials of 5-fluorouracil-based adjuvant therapy. J Natl Cancer Inst 103: 863-875. [Crossref]
- French AJ, Sargent DJ, Burgart LJ, Foster NR, Kabat BF et al. (2008) Prognostic significance of defective mismatch repair and BRAF V600E in patients with colon cancer. Clin Cancer Res 14: 3408-3415. [Crossref]
- Schepeler T, Reinert JT, Ostenfeld MS, Christensen LL, Silahtaroglu AN et al. (2008) Diagnostic and prognostic microRNAs in stage II colon cancer. Cancer Res 68: 6416-6424. [Crossref]
- Dalerba P, Sahoo D, Paik S, Guo X, Yothers G et al. (2016) CDX2 as a Prognostic Biomarker in Stage II and Stage III Colon Cancer. N Engl J Med 374: 211-222. [Crossref]
- Tie J, Wang Y, Tomasetti C, Li L, Springer S et al. (2016) Circulating tumor DNA analysis detects minimal residual disease and predicts recurrence in patients with stage II colon cancer. Sci Transl Med 8: 346ra92. [Crossref]
- Huijbers A, Tollenaar RA, v Pelt GW, Zeestraten EC, Dutton S et al. (2013) The proportion of tumor-stroma as a strong prognosticator for stage II and III colon cancer patients: validation in the VICTOR trial. Ann Oncol 24: 179-185. [Crossref]
- Mesker WE, Junggeburt JM, Szuhai K, de Heer P, Morreau H et al. (2007) The carcinoma-stromal ratio of colon carcinoma is an independent factor for survival compared to lymph node status and tumor stage. Cell Oncol 29: 387-398. [Crossref]
- Mesker WE, Liefers GJ, Junggeburt JM, van Pelt GW, Alberici P et al. (2009) Presence of a high amount of stroma and downregulation of SMAD4 predict for worse survival for stage I-II colon cancer patients. Cell Oncol 31: 169-178. [Crossref]
- Park JH, Richards CH, McMillan DC, Horgan PG, Roxburgh CS (2014) The relationship between tumour stroma percentage, the tumour microenvironment and survival in patients with primary operable colorectal cancer. Ann Oncol 25: 644-651. [Crossref]
- West NP, Dattani M, McShane P, Hutchins G, Grabsch J et al. (2010) The proportion of tumour cells is an independent predictor for survival in colorectal cancer patients. Br J Cancer 102: 1519-1523. [Crossref]
- Schippinger W, Samonigg H, Schaberl Moser R, Greil R, Thodtmann R et al. (2007) A prospective randomised phase III trial of adjuvant chemotherapy with 5-fluorouracil and leucovorin in patients with stage II colon cancer. Br J Cancer 97: 1021-1027. [Crossref]
- Casadaban L, Rauscher G, Aklilu M, Villenes D, Freels S et al. (2016) Adjuvant chemotherapy is associated with improved survival in patients with stage II colon cancer. Cancer 122: 3277-3287. [Crossref]
- Wilkinson NW, Yothers G, Lopa S, Costantino JP, Petrelli NJ et al. (2010) Long-term survival results of surgery alone versus surgery plus 5-fluorouracil and leucovorin for stage II and stage III colon cancer: pooled analysis of NSABP C-01 through C-05. A baseline from which to compare modern adjuvant trials. Ann Surg Oncol 17: 959-966. [Crossref]
- Benson AB 3rd, Schrag D, Somerfield MR, Cohen AM, Figueredo AT et al. (2004) American Society of Clinical Oncology recommendations on adjuvant chemotherapy for stage II colon cancer. J Clin Oncol 22: 3408-3419. [Crossref]
- NCCC (2012) NCCN Clinical Practice Guidelines in Oncology: Colon Cancer. [Crossref]
- Flam J, Gugic D, Bensic M, Tomic S, Rajc J (2017) High Tumor Stroma Proportion is a Worse Prognostic Factor in Colorectal Cancer. Acta Clin Croat 56: 73-79. [Crossref]
- Zunder SM, van Pelt GW, Gelderblom HJ, Mancao C, Putter H et al. (2018) Predictive potential of tumour-stroma ratio on benefit from adjuvant bevacizumab in high-risk stage II and stage III colon cancer. Br J Cancer 119: 164-169. [Crossref]
- Hynes SO, Coleman HG, Kelly PJ, Irwin S, O'Neill RF et al. (2017) Back to the future: routine morphological assessment of the tumour microenvironment is prognostic in stage II/III colon cancer in a large population-based study. Histopathology 71: 12-26. [Crossref]
- Eriksen AC, Sorensen FB, Lindebjerg J, Hager H, dePont Christensen R et al. (2018) The prognostic value of tumour stroma ratio and tumour budding in stage II colon cancer. A nationwide population-based study. Int J Colorectal Dis 33: 1115-1124. [Crossref]
- Hansen TF, Kjaer Frifeldt S, Lindebjerg J, Rafaelsen SR, Jensen LH et al. (2018) Tumor-stroma ratio predicts recurrence in patients with colon cancer treated with neoadjuvant chemotherapy. Acta Oncol 57: 528-533. [Crossref]
- De Wever O, Mareel M (2003) Role of tissue stroma in cancer cell invasion. J Pathol 200: 429-447. [Crossref]
- Mezheyeuski A, Hrynchyk I, Karlberg M, Portyanko A, Egevad L et al. (2016) Image analysis-derived metrics of histomorphological complexity predicts prognosis and treatment response in stage II-III colon cancer. Sci Rep 6: 36149. [Crossref]
- Andre T, Boni C, Mounedji Boudiaf L, Navarro M, Tabernero J et al. (2004) Oxaliplatin, fluorouracil, and leucovorin as adjuvant treatment for colon cancer. N Engl J Med 350: 2343-2351. [Crossref]
- Huijbers A, van Pelt GW, Kerr RS, Johnstone EC, Tollenaar RAEM et al. (2018) The value of additional bevacizumab in patients with high-risk stroma-high colon cancer. A study within the QUASAR2 trial, an open-label randomized phase 3 trial. J Surg Oncol 17: 1043-1048. [Crossref]
- Smit MA, van Pelt GW, Roodvoets AGH, Meershoek Klein Kranenbarg WM, Putter H et al. (2019) Uniform Noting for International Application of the Tumor-Stroma Ratio as an Easy Diagnostic Tool: Protocol for a Multicenter Prospective Cohort Study. JMIR Res Protoc 8: e13464. [Crossref]