Preclinical In-House Validation of Commercially Available Fluorescence In-Situ Hybridization Probes Used in Diagnosis of Haematological Malignancies
A B S T R A C T
World Health Organization states the importance of conventional cytogenetics and FISH in hematological malignancy for accurate diagnosis, treatment and monitoring response to therapy. Most FISH probes, however, are Analyte- Specific reagents (not FDA approved) and thus an elaborate validation procedure prior to diagnostic use becomes essential. This study focuses on validating FISH probes by assessing the analyte- sensitivity, specificity, accuracy, precision and determining normal reference ranges (cut-offs). Eight probes from two different manufacturers each were validated using cytogenetically normal peripheral blood (negative controls) and leukemia positive bone marrow samples (positive controls) to determine the most suitable probe for use in a diagnostic set-up. Both the controls were cytogenetically defined before initiating the validation procedure. Alongside this, the probe constructs were studied to understand signal co-localization, size and intensity. Accuracy was determined by metaphase FISH, precision by standard deviation or inter-observer variability and analyte specificity and sensitivity using standard formulae. The cut-off or the normal reference range was derived by BETAINV function in Microsoft Excel. Based on performance characteristics and qualitative data most relevant probes were suggested for diagnostic use. Although validation procedures may differ between test centres, it should be a mandate pre-clinical practice. A validated FISH probe surges dependability on generated reports and this study presents the most rudimentary yet essential parameters in a FISH probe validation.
Keywords
Cancer, cut-offs, diagnostic, FISH, probe, validation
Introduction
As most haematolymphoid malignancies are defined by chromosomal aberrations, cytogenetics plays a very important role in its diagnosis. Fluorescence in-situ hybridization (FISH) has become particularly useful in diagnosing cryptic cytogenetic abnormalities unidentified by karyotype [1]. The American College of Medical Genetics (ACMG) recommends FISH for clinical considerations- diagnosis, prenatal testing and identification of derivative chromosomes/ acquired markers as it is quick and highly efficient [2]. However, most FISH probes are analyte specific reagents and demand laboratory validation prior diagnostic use. Regulatory agencies, like the College of American Pathologists (CAP) and Clinical Laboratory Improvement Amendments (CLIA), have provided guidelines to validate FISH probes- institute the scoring criteria, analyte- sensitivity, specificity, accuracy, precision and normal reference range [3]. In routine diagnostics, validation includes proficiency testing, assessment of observer competency, instrument calibration, assessment of probe performance and correlation of test results with clinical findings [3].
This study emphasizes on evaluating the probe’s efficiency (analyte- accuracy, precision, sensitivity, and specificity) and defining thresholds for true positivity (i.e. quantitatively affirming malignancy at diagnosis and evaluating disease progression). In this study, we validated eight different FISH probes from two manufacturers each (two each of dual colour dual fusion, dual colour break apart, centromere enumeration and locus specific deletion probes) and the most suitable one's were suggested for diagnostic use.
Materials and Methods
Peripheral blood from 11 cytogenetically normal individuals (five males and six females) were used as negative controls along with bone marrow from malignant positive (Chronic Myeloid Leukemia (CML)- BCR/ABL1 positive, Acute Promyelocytic Leukemia (APML)- PML/RARA positive, Acute Myeloid Leukemia (AML)- MLL positive, Non-Hodgkins Lymphoma (NHL)- IgH positive, B-cell Acute Lymphoblastic Leukemia (B-ALL)- Trisomy 10,17 and Chronic Lymphocytic Leukemia (CLL)- 6q, 13q deletion positive) individuals (positive controls). Cytogenetic abnormality in positive bone marrow and absence of cytogenetic abnormality in negative controls was confirmed by karyotyping- the Gold standard test in cytogenetics. Positive controls (cytogenetically abnormal) were especially used to check if translocations are comfortably analysed by observers.
Peripheral Blood was cultured in Phytohemagglutinin (PHA) stimulated Ham’s F12 media with fetal bovine serum (FBS) for 72 hours and bone marrow was cultured in unstimulated Ham’s F12 media with FBS overnight and for 24 hours. Metaphases were arrested by Colcemid and lymphocytes were harvested using warm KCl (hypotonic) solution. Cells were fixed using Carnoy’s fixative (3:1 Methanol: Glacial acetic acid) and karyotyping (GTG banded metaphases) was performed and reported according to International System for Human Cytogenomic Nomenclature (ISCN) 2016 [4]. Both male and female specimens were employed in each probe validation to check for cross-reactivity with the X or Y chromosome.
FISH was performed according to the standard operational protocol of the laboratory. Four negative and positive controls (two males and two females) were randomly selected for each probe validation. Two hundred interphase nuclei (100 each by two observers) from negative controls were scored to determine cut-offs and comment on precision. Metaphase FISH was performed in four negative and positive controls (five metaphases each) to comment on accuracy, sensitivity and specificity. Metaphase FISH was also used to check co-localization, signal size and intensity in translocation positive and negative controls. Both metaphase and interphase cells were tested to comment on the quality of fluorescent signals generated.
In the study, eight different probes from two manufacturers each were compared, and most efficient probes were suggested for utility in diagnostics. The BCR/ABL1 probe was procured from manufacturers 1 and 2, PML/RARA from manufacturers 1 and 3, MLL probe from 1 and 2, IgH probe from manufacturers 1 and 5, CEP 10 and 17 from manufacturers 1 and 2, 13q probe from manufacturers 5 and 2 and 6q probe from manufacturers 4 and 5 (tricolour probe). The normal and abnormal signal patterns for each have been described (Table 1).
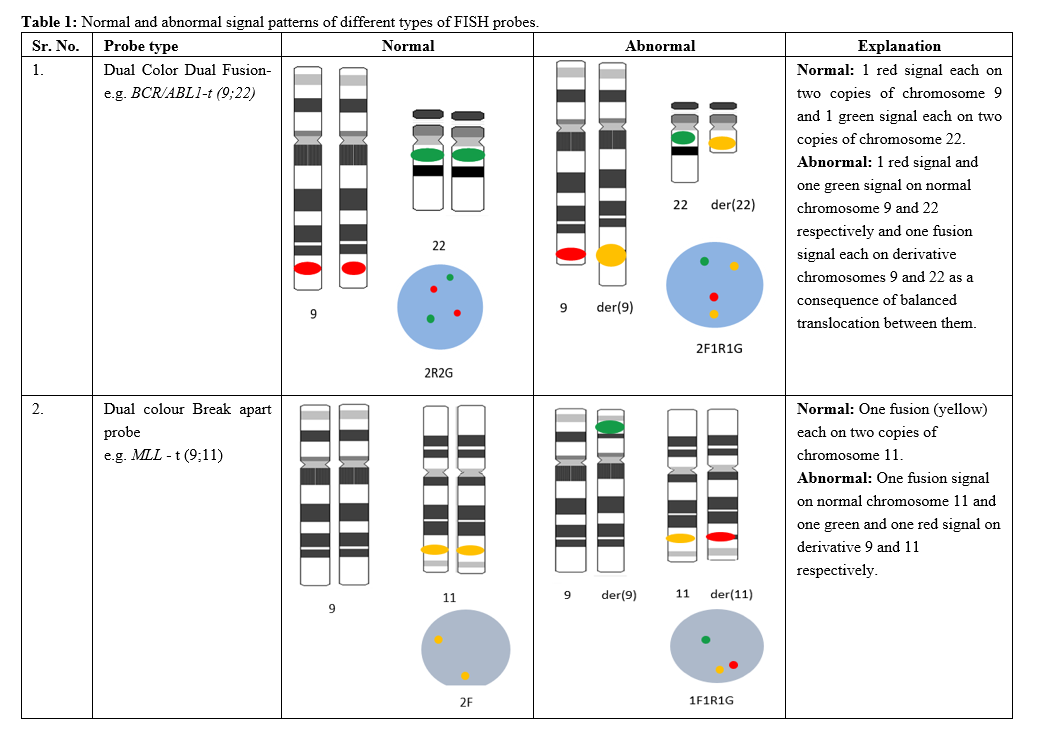
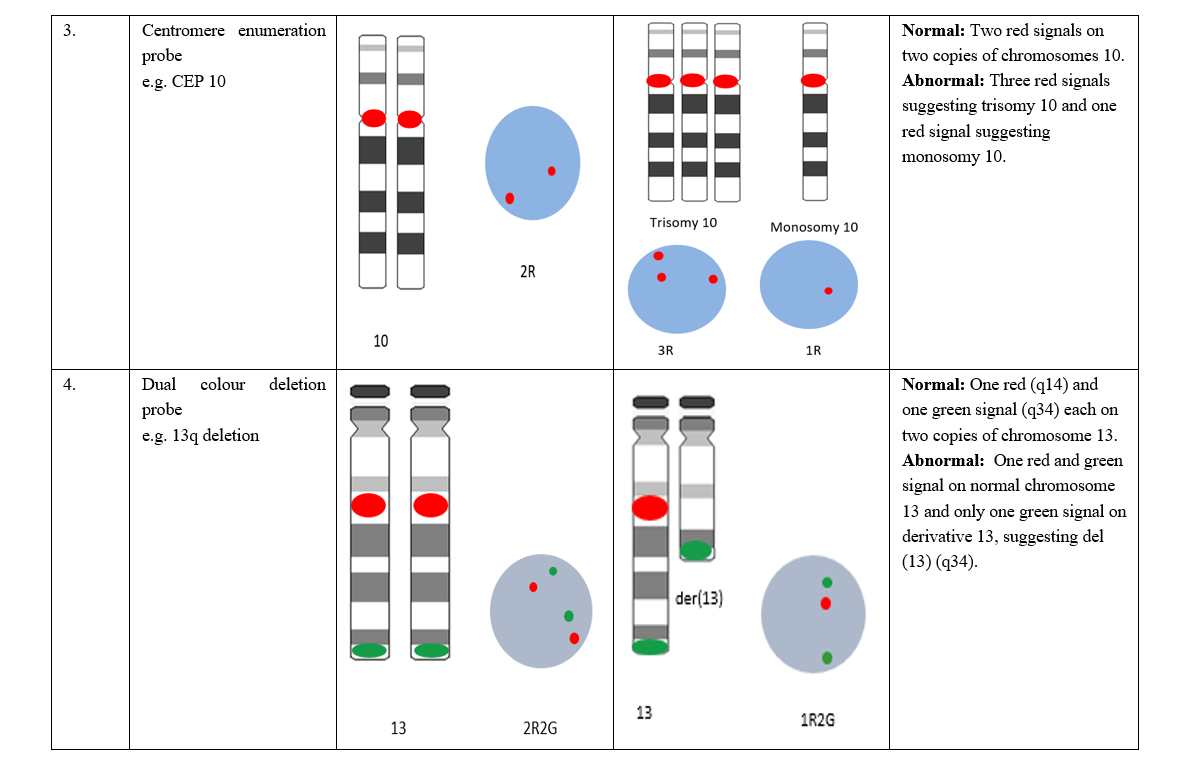
Table 1: Normal and abnormal signal patterns of different types of FISH probes.
I Study of Probe Constructs and Signal Co-Localization
The probe’s efficiency depends on its design and is determined by the signal size, intensity, method of fluorescent labelling and presence of background signals. Large signals in small nuclei elevate chances of two separate signals appearing as one. Likewise gap in fluorescent labels (red and green) may cause separation of the red and green signals instead of a single yellow signal for a break apart probe. Signal co-localization is yet another important factor that determines the probe quality by recognizing cross-hybridization inherent to the probe. Hence probe constructs were studied and correlated with the performance characteristic to suggest suitable probes for diagnostic use.
II Examination of Performance Characters
i Accuracy
Accuracy is defined as the degree to which observed results conforms to actual results. Hence for a probe to be accurate it should hybridize to the locus for which it has been designed. Accuracy was assessed in four negative controls (2 males, 2 females).
ii Precision
Precision is closeness between independent test results, in simpler terms the reproducibility. It can be determined by performing replicate assays or by determining inter-observer variability encountered in scoring a FISH assay. Inherent biological variations are known to confound results and the laboratory should understand that the FISH test may not show absolute precision. In our study, precision was determined by comparing mean analytical scores (11 negative controls) of both test readers. This data was used to reject highly divergent probes.
iii Sensitivity
Sensitivity is defined as the percentage of cells having the expected signal pattern (i.e. how frequently a probe hybridizes to its intended genomic target). Thus, higher values relate to lowered chances of false negatives [5]. An ideal (100%) sensitivity means a detectable signal will be observed over the expected region for every target chromosome examined [6]. Sensitivity of at least 95% is recommended [6]. It was determined by assessing five metaphases each from four positives controls and using the following formulae [7].
Sensitivity = ( Number of true positives)/( Total number of cells examined ) x100
iv Specificity
It is defined as the percentage of cells where the probe binds only to a specific locus and no other location on the chromosome (i.e. how frequently a target detected by the probe is truly the intended genomic target). Thus, higher the probe specificity, lower are the chances of false- positives and a probe with perfect (100%) specificity will never produce a signal over any chromosomal region other than the expected region [5]. Specificity of at least 98% is recommended [6]. It was determined by assessing metaphase chromosomes from four negative controls and using the formulae available in literature [7].
Specificity = ( Number of true negatives)/(Total number of cells examined) x100
It should be noted that analytical sensitivity or specificity may also be a consequence of probe contruct [6].
v Reference Range
Reference range as defined by ACMG FISH guidelines, is the range of test values expected to occur in 95% of healthy individuals [8]. It is a method to estimate the number of cells that should show an abnormal FISH pattern to report an individual as test positive. Estimation of normal reference range was done using Microsoft Excel Function- BETAINV with a probability of 95% [9]. Beta inverse function in Excel is given by [=BETAINV(alpha,beta,[A],[B]) which is [=BETAINV(probability, number of false positive nuclei +1 found in normal samples with the utmost number of false positive nucleus for a given signal pattern, total number of cells scored). It inverts beta distribution by utilizing number of positive nuclei in a specimen or sample & the probability of a positive nucleus to generate cut-offs [10]. Signal patterns in 200 interphase cells from negative controls were scored by two observers to calculate cut-off values. Regardless of calculations used, borderline-positive and borderline-negative results should always be interpreted with great caution and in the context of other clinical and laboratory findings.
Results and Discussion
It was essential to first define karyotypes to assess probe performance. Metaphases in all 11 negative controls showed a normal karyotype of 46, XX or 46, XY confirming absence of cytogenetic abnormality. Samples used as positive controls were also karyotypically defined.
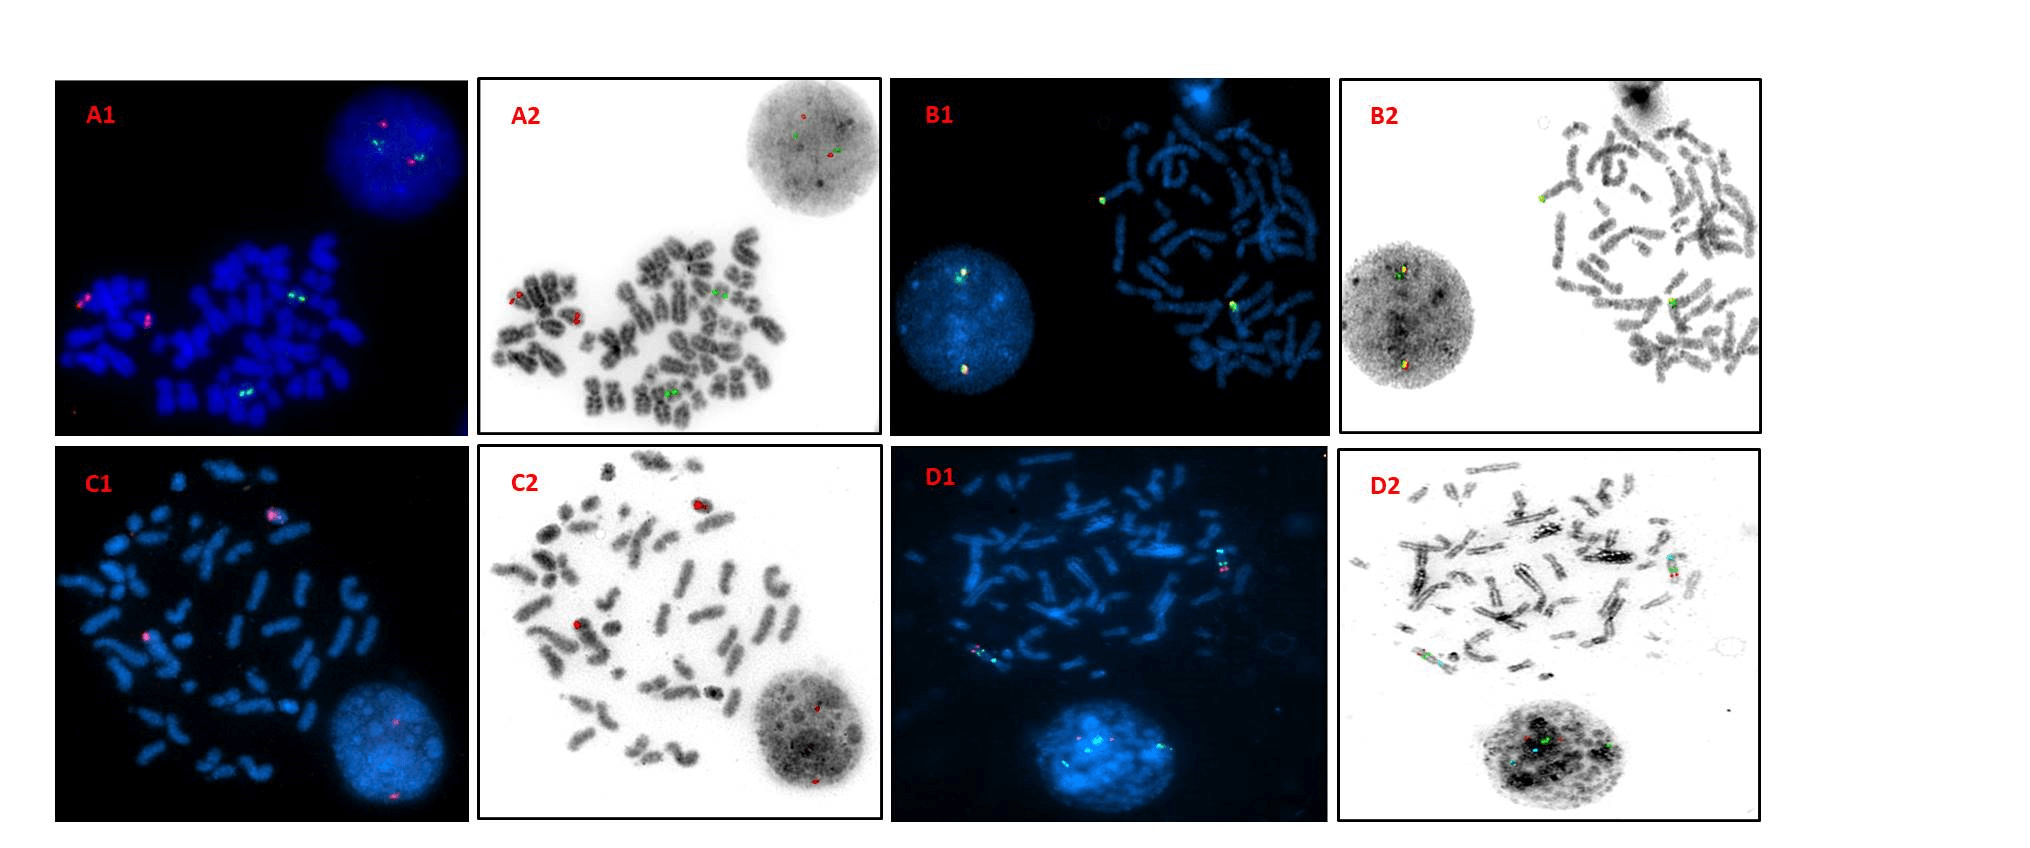
Figure 1: DAPI and inverted DAPI images of metaphase FISH on negative controls. A1 & A2- Dual colour dual fusion probe (PML/RARA) showing 2R2G signal pattern. B1 & B2- Break apart probe (IgH) showing 2F signal pattern. C1 & C2- Centromere enumeration probe (CEP17) showing 2R signal pattern. D1 & D2- Triple colour deletion probes (6q deletion) showing 2R2G2A signal pattern. Key: R- red; G- green; A- aqua; F- fusion.
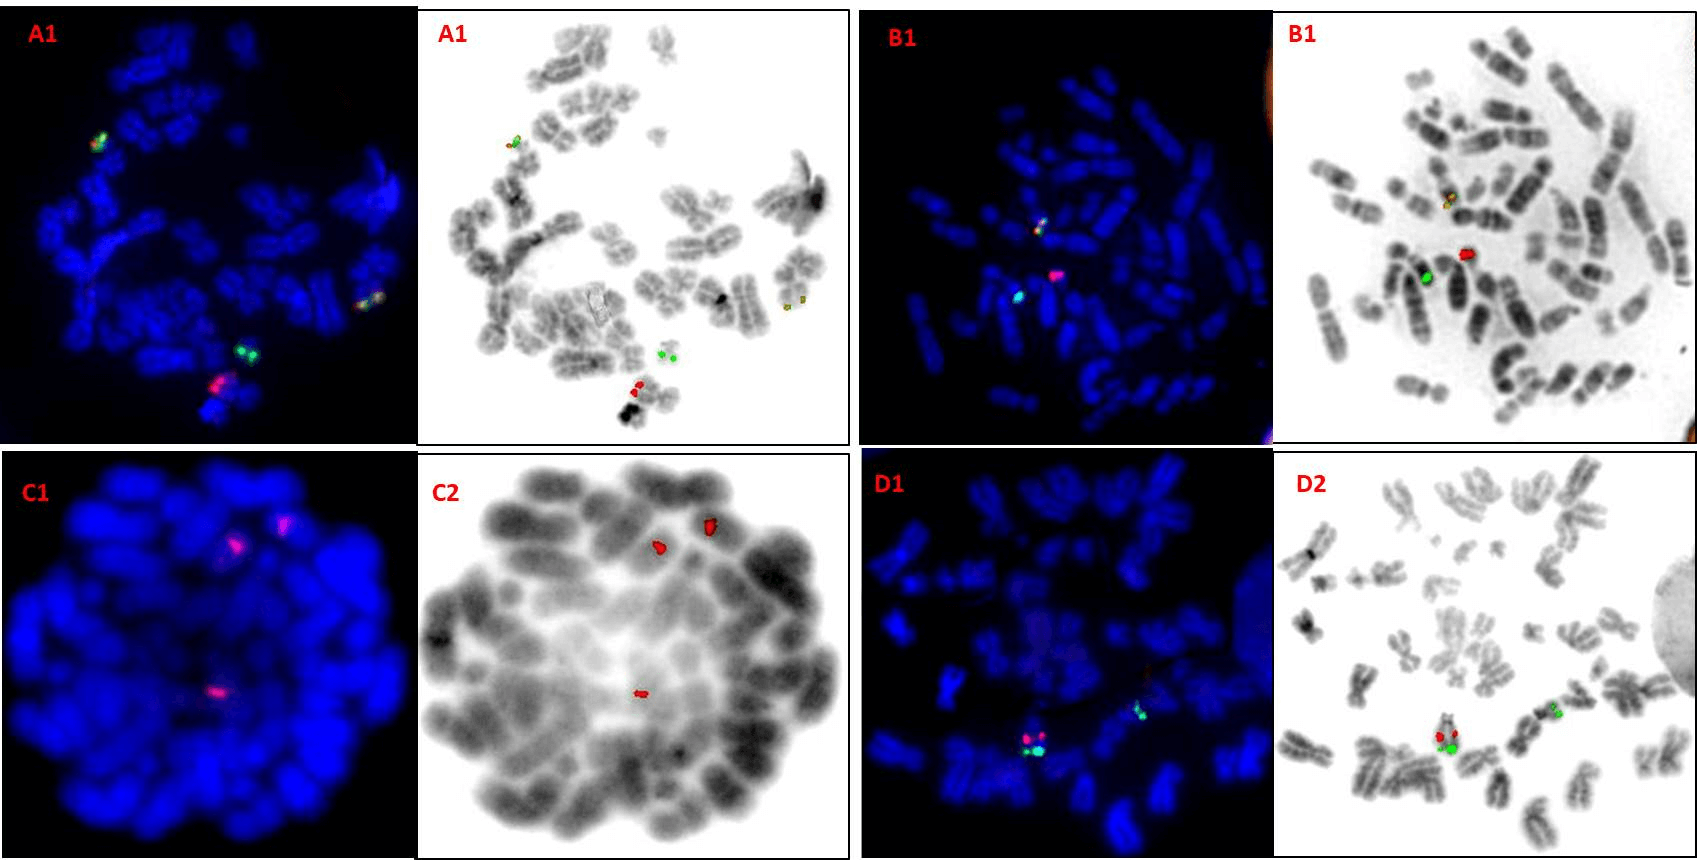
Figure 2: DAPI and inverted DAPI image of metaphase FISH on positive controls. A1 & A2- Dual colour dual fusion probe (BCR/ABL1) showing 2F1R1G signal pattern. B1 & B2- Break apart probe (MLL) showing 1F1R1G signal pattern. C1 & C2- Centromere enumeration probe (CEP10) showing 3R signal pattern.D1 & D2- Dual colour deletion probes (13q deletion) showing 1R2G signal pattern. Key: R- red; G- green; F- fusion.
Reverse DAPI images revealed 100% accuracy of probes (Figure1). The BCR/ABL1 probe from Manufacturer 1 (Table 2), PML/RARA probe from manufacturer 3, MLL probe from manufacturer 2 and IgH probe from manufacturer 1 were observed to be precise whereas centromere enumeration probes from neither manufacturer was precise. The 13q deletion probe from manufacturer 2 and 6q deletion probe from manufacturer 5 also showed good precision. All probes were seen to display ideal sensitivity and specificity as they could detect the intended loci as well as bind specifically only to that loci (Table 2). In case of positive controls, all probes bound to the loci and yielded translocation positive FISH patterns which were conveniently analysed by both observers (Figure 2).
Table 2: Accuracy, precision, sensitivity and specificity of the BCR/ABL1 probe (manufacturer one).
|
ACCURACY |
|||||||||
|
No. of samples Scored (negative control) |
No. of samples with probes bound to its own locus |
No. of probes bound unspecifically |
|||||||
|
4 |
4 |
0 |
|||||||
|
PRECISION |
|||||||||
|
Pattern (negative control) |
O1 (100 nuclei) |
O2 (100 nuclei) |
SD |
Precise (Mean±SD) |
|||||
|
2R2G |
90.8 |
88.1 |
2.82 |
Y |
|||||
|
2R1G |
3.7 |
5.4 |
2.4 |
Y |
|||||
|
1R2G |
3 |
2.8 |
1.9 |
Y |
|||||
|
1F1R1G |
2.4 |
2.4 |
1.2 |
Y |
|||||
|
SENSITIVITY |
|||||||||
|
Cases |
No. Metaphases scored (positive controls) |
BCR/ABL1 Positive metaphases |
BCR/ABL1 Negative metaphases |
Sensitivity %
|
|
||||
|
1 |
5 |
5 |
0 |
100% |
|
||||
|
2 |
5 |
5 |
0 |
|
|||||
|
3 |
5 |
5 |
0 |
|
|||||
|
4 |
5 |
5 |
0 |
|
|||||
|
SPECIFICITY |
|
||||||||
|
Cases |
No. of metaphases scored (negative control) |
BCR/ABL1 positive metaphases |
BCR/ABL1 negative metaphases |
Specificity % |
|
||||
|
1 |
5 |
0 |
5 |
100% |
|
||||
|
2 |
5 |
0 |
5 |
|
|||||
|
3 |
5 |
0 |
5 |
|
|||||
|
4 |
5 |
0 |
5 |
|
|||||
O1: Observer1; O2: Observer 2, R: red, G: green; F: fusion; Y: precise.
Normal reference range for most frequent signal patterns was determined on normal controls by BETAINV function in Microsoft Excel and a brink value was reported for true positivity. Cut-offs for BCR/ABL1 probe (manufacturer 1) was calculated to be 13.8%, 9.5% and 8.4% for signal patterns 2R1G, 1R2G and 1F1R1G respectively (Table 3). This suggests that if there are more than 13.8% cells with a 2R1G signal pattern, a test sample should be considered positive for deletion of BCR gene (which is tagged by a green fluorochrome) in one homologue of chromosome 22. Similarly, if the percentage of nuclei with a signal pattern of 1R2G or 1F1R1G exceeds 9.5% or 8.4% respectively, the test sample should be considered positive for deletion of ABL1 region on one homologue of chromosome 9 or positive for BCR/ABL1 translocation respectively. Thus, the calculated normal reference range was used to classify patients as positive, negative, border-line positive and border-line negatives, thereby felicitating the course of treatment.
Signal size, intensity, and probe design are also essential alongside the performance parameters of probes. Thus, these were collectively studied to determine suitability of the probes in diagnostics. The BCR/ABL1 probe from manufacturer 1 generated bright signals and was chosen over manufacturer 2 producing large but dispersed signals (corresponding to large tag). The PML/RARA probe from manufacturer 3 was best suited for diagnosis, for it gave no background noise and signals could be analysed with ease in both positive and negative controls. Precision results also confirmed suitability of this probe (manufacturer 3) for diagnosis. For a break apart rearrangement probe, 2F (yellow) signals should be observed in a negative sample, however, the MLL probe from manufacturer 2 showed two red and two green signals in close proximity instead of two clearly defined yellow signals. Different analysers can interpret this differently- some as 2R2G (Diseased) and some as 2F (normal) thus increasing chances of false positivity.
On the contrary, although MLL probe from manufacturer 1 showed small signals (a consequence of its small map) it did not possess this limitation and hence should be preferred. IgH probes from both manufacturers were equally good, however, probe from manufacturer 5 showed brighter signals. Also, IgH probe from manufacturer 1 showed weaker red signals (smaller red tag -282 kb as compared to its complement-551kb) in positive controls. CEP 10 probe from manufacturer 2 was seen to be better in comparison to its counterparts as it showed bright, large signals. The CEP 17 from manufacturer 1 was chosen as it exhibited better precision. The 13q deletion probes from both manufacturers (2 and 5) were excellent in terms of all parameters studied and either probe could be used, however, probe from manufacturer 2 showed better precision. The 6q deletion probe from manufacturer 4 was better in comparison to the same probe from manufacturer 5, as green signals for latter were very faint in spite of having larger green fluorescent tag as compared to its counterpart. The Selection of probe was also a balance between cost and performance- i.e. although some probes were less expensive, they were inadequate in performance and thus were not used in diagnostics.
Table 3: Dataset of 200 interphase nuclei scored (signal pattern) in 11 known normal control peripheral blood specimens for BCR/ABL1 (manufacturer 1) FISH probe.
|
Sample |
Total cells |
Normal Signal pattern |
Abnormal Signal Patterns |
|||||||||||||
|
Patterns |
2R2G |
2R1G |
1R2G |
1F1R1G |
others |
|||||||||||
|
Observers |
O1 |
O2 |
% |
O1 |
O2 |
% |
O1 |
O2 |
% |
O1 |
O2 |
% |
O1 |
O2 |
% |
|
|
1. |
200 |
95 |
96 |
95.5 |
3 |
2 |
2.5 |
2 |
2 |
2 |
0 |
0 |
0 |
0 |
0 |
0 |
|
2. |
200 |
89 |
86 |
87.5 |
3 |
3 |
3 |
4 |
6 |
5 |
4 |
3 |
3.5 |
2 |
0 |
1 |
|
3. |
200 |
88 |
87 |
87.5 |
3 |
6 |
4.5 |
4 |
5 |
4.5 |
5 |
2 |
3.5 |
0 |
0 |
0 |
|
4. |
200 |
92 |
88 |
90 |
4 |
7 |
5.5 |
1 |
0 |
0.5 |
3 |
2 |
2.5 |
3 |
0 |
1.5 |
|
5. |
200 |
91 |
85 |
88 |
4 |
7 |
5.5 |
3 |
3 |
3 |
2 |
5 |
3.5 |
0 |
0 |
0 |
|
6. |
200 |
93 |
87 |
90 |
4 |
3 |
3.5 |
2 |
6 |
4 |
1 |
1 |
1 |
3 |
0 |
1.5 |
|
7. |
200 |
89 |
84 |
86.5 |
4 |
8 |
6 |
5 |
2 |
3.5 |
2 |
6 |
4 |
0 |
0 |
0 |
|
8. |
200 |
88 |
83 |
85.5 |
8 |
14 |
11 |
1 |
0 |
0.5 |
3 |
3 |
3 |
0 |
0 |
0 |
|
9. |
200 |
92 |
94 |
93 |
5 |
3 |
4 |
0 |
0 |
0 |
3 |
3 |
3 |
0 |
0 |
0 |
|
10. |
200 |
92 |
91 |
91.5 |
0 |
2 |
1 |
6 |
7 |
6.5 |
2 |
0 |
1 |
0 |
0 |
0 |
|
11. |
200 |
90 |
89 |
89.5 |
3 |
5 |
4 |
5 |
0 |
2.5 |
2 |
2 |
2 |
4 |
0 |
2 |
|
MEAN |
|
90.8 |
88.1 |
89.5 |
3.7 |
5.4 |
4.5 |
3 |
2.8 |
2.9 |
2.4 |
2.4 |
2.4 |
1.0 |
0 |
0.5 |
|
SD |
|
2.1 |
3.8 |
2.82 |
1.8 |
3.3 |
2.4 |
1.8 |
2.6 |
1.9 |
1.3 |
1.7 |
1.2 |
1.5 |
0 |
0.7 |
|
BETAINV (%) |
|
|
|
|
|
|
13.8 |
|
|
9.5 |
|
|
8.4 |
|
|
4.4 |
O: observer, 2R2G: 2 red, 2 green; 2R1G: 2 red, 1 green; 1R2G: 1 red, 2 green;
Note: 1F1R1G: 1 fusion 1 red 1 green; others: less common signals. SD: Standard deviation.
Conclusions
Each new probe to be used in diagnostics must undergo a validation procedure. Probe verification for consequent lots can be performed by applying new and validated probes on the same control sample. Both probes (in-use and new) should superlatively give the same outputs, only then can the new probe be contemplated as valid. During diagnosis, it is also very crucial to interpret the results based on both conventional and molecular cytogenetics. Along with validation of probes, emphasis on validation and standardization of all instruments in use and maintaining an SOP is also essential.
Acknowledgements
None.
Article Info
Article Type
Research ArticlePublication history
Received: Mon 02, Mar 2020Accepted: Fri 20, Mar 2020
Published: Tue 31, Mar 2020
Copyright
© 2023 Dhanlaxmi Shetty. This is an open-access article distributed under the terms of the Creative Commons Attribution License, which permits unrestricted use, distribution, and reproduction in any medium, provided the original author and source are credited. Hosting by Science Repository.DOI: 10.31487/j.EJMC.2020.01.01
Figures & Tables
Table 1: Normal and abnormal signal patterns of different types of FISH probes.
Table 2: Accuracy, precision, sensitivity and specificity of the BCR/ABL1 probe (manufacturer one).
|
ACCURACY |
|||||||||
|
No. of samples Scored (negative control) |
No. of samples with probes bound to its own locus |
No. of probes bound unspecifically |
|||||||
|
4 |
4 |
0 |
|||||||
|
PRECISION |
|||||||||
|
Pattern (negative control) |
O1 (100 nuclei) |
O2 (100 nuclei) |
SD |
Precise (Mean±SD) |
|||||
|
2R2G |
90.8 |
88.1 |
2.82 |
Y |
|||||
|
2R1G |
3.7 |
5.4 |
2.4 |
Y |
|||||
|
1R2G |
3 |
2.8 |
1.9 |
Y |
|||||
|
1F1R1G |
2.4 |
2.4 |
1.2 |
Y |
|||||
|
SENSITIVITY |
|||||||||
|
Cases |
No. Metaphases scored (positive controls) |
BCR/ABL1 Positive metaphases |
BCR/ABL1 Negative metaphases |
Sensitivity %
|
|
||||
|
1 |
5 |
5 |
0 |
100% |
|
||||
|
2 |
5 |
5 |
0 |
|
|||||
|
3 |
5 |
5 |
0 |
|
|||||
|
4 |
5 |
5 |
0 |
|
|||||
|
SPECIFICITY |
|
||||||||
|
Cases |
No. of metaphases scored (negative control) |
BCR/ABL1 positive metaphases |
BCR/ABL1 negative metaphases |
Specificity % |
|
||||
|
1 |
5 |
0 |
5 |
100% |
|
||||
|
2 |
5 |
0 |
5 |
|
|||||
|
3 |
5 |
0 |
5 |
|
|||||
|
4 |
5 |
0 |
5 |
|
|||||
O1: Observer1; O2: Observer 2, R: red, G: green; F: fusion; Y: precise.
Table 3: Dataset of 200 interphase nuclei scored (signal pattern) in 11 known normal control peripheral blood specimens for BCR/ABL1 (manufacturer 1) FISH probe.
|
Sample |
Total cells |
Normal Signal pattern |
Abnormal Signal Patterns |
|||||||||||||
|
Patterns |
2R2G |
2R1G |
1R2G |
1F1R1G |
others |
|||||||||||
|
Observers |
O1 |
O2 |
% |
O1 |
O2 |
% |
O1 |
O2 |
% |
O1 |
O2 |
% |
O1 |
O2 |
% |
|
|
1. |
200 |
95 |
96 |
95.5 |
3 |
2 |
2.5 |
2 |
2 |
2 |
0 |
0 |
0 |
0 |
0 |
0 |
|
2. |
200 |
89 |
86 |
87.5 |
3 |
3 |
3 |
4 |
6 |
5 |
4 |
3 |
3.5 |
2 |
0 |
1 |
|
3. |
200 |
88 |
87 |
87.5 |
3 |
6 |
4.5 |
4 |
5 |
4.5 |
5 |
2 |
3.5 |
0 |
0 |
0 |
|
4. |
200 |
92 |
88 |
90 |
4 |
7 |
5.5 |
1 |
0 |
0.5 |
3 |
2 |
2.5 |
3 |
0 |
1.5 |
|
5. |
200 |
91 |
85 |
88 |
4 |
7 |
5.5 |
3 |
3 |
3 |
2 |
5 |
3.5 |
0 |
0 |
0 |
|
6. |
200 |
93 |
87 |
90 |
4 |
3 |
3.5 |
2 |
6 |
4 |
1 |
1 |
1 |
3 |
0 |
1.5 |
|
7. |
200 |
89 |
84 |
86.5 |
4 |
8 |
6 |
5 |
2 |
3.5 |
2 |
6 |
4 |
0 |
0 |
0 |
|
8. |
200 |
88 |
83 |
85.5 |
8 |
14 |
11 |
1 |
0 |
0.5 |
3 |
3 |
3 |
0 |
0 |
0 |
|
9. |
200 |
92 |
94 |
93 |
5 |
3 |
4 |
0 |
0 |
0 |
3 |
3 |
3 |
0 |
0 |
0 |
|
10. |
200 |
92 |
91 |
91.5 |
0 |
2 |
1 |
6 |
7 |
6.5 |
2 |
0 |
1 |
0 |
0 |
0 |
|
11. |
200 |
90 |
89 |
89.5 |
3 |
5 |
4 |
5 |
0 |
2.5 |
2 |
2 |
2 |
4 |
0 |
2 |
|
MEAN |
|
90.8 |
88.1 |
89.5 |
3.7 |
5.4 |
4.5 |
3 |
2.8 |
2.9 |
2.4 |
2.4 |
2.4 |
1.0 |
0 |
0.5 |
|
SD |
|
2.1 |
3.8 |
2.82 |
1.8 |
3.3 |
2.4 |
1.8 |
2.6 |
1.9 |
1.3 |
1.7 |
1.2 |
1.5 |
0 |
0.7 |
|
BETAINV (%) |
|
|
|
|
|
|
13.8 |
|
|
9.5 |
|
|
8.4 |
|
|
4.4 |
O: observer, 2R2G: 2 red, 2 green; 2R1G: 2 red, 1 green; 1R2G: 1 red, 2 green;
Note: 1F1R1G: 1 fusion 1 red 1 green; others: less common signals. SD: Standard deviation.
References
- NCCLS (2004) Fluorescence In-situ Hybridization (FISH) methods for medical genetics: Approved guideline. NCCLS document MM7-A.
- Wiktor AE, Van Dyke DL, Stupca PJ, Ketterling RP, Thorland EC et al. (2006) Preclinical validation of fluorescent in situ hybridization assay for clinical practice. Genet Med 8: 16-23. [Crossref]
- Test and Technology Transfer Committee, American College of Medical Genetics, 9650 Rockville Pike, Bethesda, MD 20814-3998, United States (2000) Technical and clinical assessment of fluorescence in situ hybridization: an ACMG/ASHG position statement. I. Technical considerations. Test and Technology Transfer Committee. Genet Med 2: 356-361. [Crossref]
- McGowan Jordan J, Simons A, Schmid M (2016) An International system for human cytogenomic nomenclature (ISCN). Karger publisher Basel.
- Saxe DF, Persons DL, Wolff DJ, Theil KS (2012) Validation of fluorescent in situ hybridization using an analyte- specific reagent for detection of abnormalities involving the mixed lineage leukemia gene. Arch Pathol Lab Med 136: 47-52. [Crossref]
- Mascarello JT, Hirsch B, Kearney HM, Ketterling RP, Olson SB et al. (2011) Section E9 of the American College of Medical Genetics technical standards and guidelines: fluorescence in situ hybridization. Genet Med 13: 668-675. [Crossref]
- Parikh R, Mathai A, Parikh S, Chandra SG, Thomas R (2008) Understanding and using sensitivity, specificity and predictive values. Indian J Ophthalmol 56: 45-50. [Crossref]
- Shearer BM, Knudson RA, Flynn HC, Ketterling RP (2005) Development of a D- FISH method to detect DEK/CAN fusion resulting from t(6;9) (p23;q34) in patients with acute myelogenous leukaemia. Leukaemia 19: 126-131. [Crossref]
- Wolff DJ, Bagg A, Cooley LD, Dewald GW, Hirsch BA et al. (2007) Guidance for fluorescence in situ hybridization testing in haematological disorders. J Mol Diagn 9: 134-143. [Crossref]
- Ciolino AL, Tang ME, Bryant R (2009) Statistical treatment of fluorescent in situ hybridization Validation data to generate normal reference ranges using Excel functions. J Mol Diagn 11: 330-333. [Crossref]