Plasma Growth Differentiation Factor-15 in Children with Pulmonary Hypertension Associated with Congenital Heart Disease
A B S T R A C T
Objectives: We aimed to investigate the levels and diagnostic value of plasma growth differentiation factor-15 (GDF-15) in children with pulmonary hypertension associated with congenital heart disease (PH-CHD).
Methods: One hundred infants and children with CHD were included in the study; 50 of them with PH-CHD and another 50 patients with CHD only. Fifty healthy infants and children of matched age and sex were included as a control group. GDF-15 levels as well as echocardiographic examination were done for all included subjects. Cardiac catheterization was performed for patients only.
Results: GDF-15 levels were significantly higher in patients with PH-CHD (0.62±0.2) nmol/ml compared to those with CHD only patients (0.21±0.06) nmol/ml and to control group (0.13±0.02) nmol/ml with P<0.001. GDF-15 levels were significantly elevated according to the severity of PH; (0.4±0.1) nmol/ml in mild PH vs (0.7±0.3) nmol/ml in moderate PH vs (1.1±0.1) nmol/ml in severe PH. At a cutoff value of ≥ 0.313 nmol/ml, the sensitivity of GDF-15 as a diagnostic biomarker in PH-CHD children was 95%, the specificity was 100%, positive predictive value (PPV) was 100%, and negative predictive value (NPV) was 95.2 %.
Conclusion: GDF-15 is elevated in infants and children with PH-CHD and can be a promising diagnostic biomarker in these patients
Keywords
GDF-15, infants, pulmonary hypertension, congenital heart disease, diagnostic biomarker
Introduction
Pulmonary hypertension (PH) is a serious complication of congenital heart disease (CHD) and early diagnosis and management is vital to improve the outcome in these children [1, 2]. Several biomarkers were used for diagnosis and risk stratification of pulmonary hypertension associated with congenital heart disease (PH-CHD) such as B type natriuretic peptide and amino-terminal pro-B-type natriuretic peptides (NT proBNP) [3-5]. Growth differentiation factor 15 (GDF-15) is a cytokine that was found to be increased in several pathological conditions such as pressure overload, cardiovascular disease, hypoxia, and shear stress [6-9]. Additionally, GDF-15 has been reported to increase in heart failure (HF) and PH [10-12]. However, studies investigating its level and diagnostic value in infants and children with PH-CHD are few. So, we performed this study to investigate the levels and diagnostic value of plasma GDF-15 in infants and children with PH-CHD.
Material and Methods
This prospective study was carried out on one hundred children with CHD; 50 of them had PH-CHD and the other 50 had CHD only after obtaining a written informed consent from all subjects’ parents or guardians. Patients were selected from infants and children admitted at Pediatric Cardiology, Tanta University hospital, Egypt during the period from March 2017 to December 2018. Fifty healthy children of matched age and sex were included as a control group. The patients were classified into two groups – Group I: Fifty (50) children with PH-CHD, and Group II: Fifty (50) children with CHD and no PH. The inclusion criteria comprised infants and children CHD with or without PH aged more than one month and less than 18 years. The exclusion criteria comprised children with acquired heart disease, children with primary PH, children with mitochondrial disease, heart failure, diabetes mellitus, or acute or chronic illness.
Complete history taking and thorough clinical examination were performed for all included children. Echocardiographic assessment was performed using Vivid 7 and Vivid 9 ultrasound machine (GE Medical System, Horten, Norway) with 7 and 4s MHz multi- frequency transducers. Doppler, two dimensional, and M mode were used for the complete echocardiographic assessment. Right ventricular diameter was estimated at end diastole of right ventricle in the apical 4 chamber view. Right ventricular systolic function was assessed using right ventricular outflow tract fraction shortening (RVOT FS) that was measured by M mode from the parasternal short axis view at aortic valve level with magnified images of RVOT and the cursor was aligned perpendicular to the anterior RVOT wall. Then RVOT end-diastolic diameter and RVOT end-systolic diameter were measured. Then RVOT FS can be calculated by the equation: RVOT FS= (RV end diastolic diameter - RVOT end systolic diameter) / RV end diastolic diameter × 100 [13]. Right ventricular diastolic function was measured using tricuspid E/A.
A cardiac catheter was performed to assess mean pulmonary artery pressure (mPAP) and pulmonary vascular resistance (PVR). Plasma GDF-15 levels were assessed using enzyme-linked immunosorbent assay test (ELISA). PH was defined as mPAP more than 25 mm HG. PH was classified into mild, moderate, and severe according to the level of mPAP. Mild PH was defined as mPAP between 26 and 35 mmHg, moderate PH if mPAP ranged between 36 and 45 mmHg, and severe PH if mPAP was more than 45 mmHg. The primary outcome was to evaluate the level of GDF-15 in children with PH-CHD. The secondary outcome was to evaluate the diagnostic value of GDF-15 in children with PH-CHD.
Statistical Analysis
Statistical analysis of the data was performed using SPSS V. 21 (SPSS Inc. Chicago, IL, USA). Continuous data were presented as mean and standard deviation. Categorical data were presented as number and percentage. Comparison of continuous data between the three groups was performed using one-way analysis of variance (ANOVA). Comparing the mean of two groups was performed using Student t test. Comparison of categorical data between the three groups was performed using Chi-Square test. Receiver operating characteristics (ROC) curves was measured to assess the diagnostic value of PDF-15 in children with PH-CHD. P value less than 0.05 was considered significant.
Table 1: Demographic, clinical, laboratory and echocardiographic parameters in the studied groups.
|
Variable |
PH-CHD patients |
CHD only patients |
Healthy control |
p |
p1 |
p2 |
p3 |
|
Age (months) |
8.3±2.6 |
8.7±3.1 |
8±2.5 |
NS |
|
|
|
|
Sex (male: female) |
26:24 |
23:27 |
25:25 |
NS |
|
|
|
|
Weight |
6.7±0.8 |
7.2 ±1.2 |
9.2±1.3 |
0.001 |
NS |
0.001* |
0.01* |
|
HR(b/m) |
124 ± 21.8 |
117.3 ±23.9 |
90.5 ± 18.9 |
0.001* |
NS |
0.001* |
0.001* |
|
RR (cycle/m) |
46.1 ± 7.5 |
43.6 ±6.9 |
35.2 ± 4.3 |
0.001* |
NS |
0.001* |
0.01* |
|
GDF-15 (nmol/ml) |
0.62 ± 0.2 |
0.21 ± 0.06 |
0.13 ± 0.02 |
<0.001* |
0.001* |
<0.001* |
<0.001* |
|
mPAP (mm Hg) |
47.3 ± 13.8 |
16.2 ± 4.5 |
12.6 ± 3.9 |
<0.001* |
<0.001* |
<0.001* |
NS |
|
PVR(Wood unit) |
3.1±0.9 |
1.5±0.3 |
|
|
|
|
|
|
RVOT FS% |
35.8 ± 8.2 |
33.5 ± 7.2 |
36.9 ± 4.9 |
NS |
|
|
|
|
RV E/A ratio |
1 ± 0.3 |
1.3 ± 0.2 |
1.3 ± 0.1 |
0.01* |
0.001* |
0.001* |
NS |
p: p value for comparison between the three studied groups.
p1: p value for comparison between PH-CHD and CHD groups.
p2: p value for comparison between PH-CHD and control groups.
p3: p value for comparison between CHD and control groups.
*means significant, NS: non-significant, HR: heart rate, b/m: beat per minute, RR: respiratory rate, GDF: growth differentiation factor, mPAP: mean pulmonary artery pressure, PVR: pulmonary vascular resistance, RVOT FS: right ventricular outlet fraction shortening, RV: right ventricle, E/A ratio: ratio of the early (E) to late (A) ventricular filling velocities.
Results
The study included 50 children with PH-CHD with mean age of 8.3±2.6 m. Children with CHD only had mean age of 8.7±3.1 m, while the healthy control group had a mean age of 8±2.5 m. The three groups were comparable as regards age, sex, and RVOT FS. However, there was a significant decrease of body weight and RV E/A ratio in children with PH-CHD compared to CHD only patients and control group. Furthermore, there was a significant increase of RR and HR in children with CHD compared to healthy control. PDF-15 was significantly higher in children with CHD compared to normal control and this increase was more evident in children with PH-CHD (Table 1). PDF-15 levels were significantly elevated in children with severe PH (1.1 ± 0.1) compared to those with moderate PH (0.7 ± 0.3) and those with mild PH (0.4 ± 0.1) with P<0.001 (Table 2). When using a cutoff value of ≥ 0.313 nmol/ml, the sensitivity of GDF-15 as a diagnostic biomarker in PH- CHD children was 95%, the specificity was 100%, PPV was 100%, NPV was 95.2 %, and area under the ROC curve was 0.97 (Figure 1).
Table 2: Plasma GDF-15 levels in different grades of PH in PAH-CHD group.
|
GDF-15 (nmol/ml) |
Grades of PH |
p |
||
|
Mild (n = 20) |
Moderate (n =14) |
Severe (n =16) |
||
|
Mean ± SD. |
0.4 ± 0.1 |
0.7 ± 0.3 |
1.1 ± 0.1 |
|
|
Post –Hoc analysis |
Mild vs moderate |
Mild vs severe |
Moderate vs severe |
|
|
p1=0.02* |
p2=0.002* |
p3=0.001* |
||
p: p value for association between different grades of PH.
p1: p value for comparison between mild and moderate PH.
p2: p value for comparison between mild and severe PH.
p3: p value for comparison between moderate and severe PH.
*means significant, GDF: growth differentiation factor, PH: pulmonary hypertension
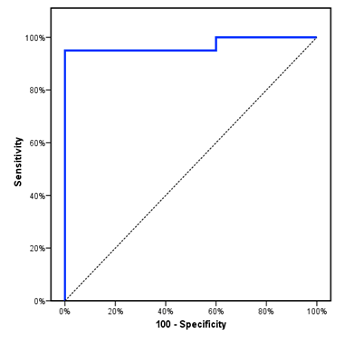
Figure 1: ROC curve for GDF-15 to diagnose PH in CHD patients where the area under the curve (AUC) was 0.97.
Discussion
GDF-15 is highly expressed by myocardial cells especially in those exposed to hypoxia, wall stress or ischemia [14]. The present study aimed to investigate the levels and diagnostic value of plasma GDF-15 in children with PH-CHD. Our study revealed that plasma levels of GDF-15 were significantly higher in PH-CHD patients compared to CHD only patients and control group. This agreed with Li et al. who found that GDF-15 levels were higher in children with PH-CHD [12]. PH leads to an increase of pressure overload on the right ventricle with a resultant increase of plasma GDF-15 that found to be increased in conditions characterized by hypoxia or pressure overload [7-9].
Our study revealed that GDF-15 levels were significantly higher in CHD patients with severe PH compared to those with mild or moderate PH. This comes in agreement with the results of Li et al. who found that plasma GDF-15 levels were closely correlated with disease severity of PH in children with PH-CHD and GDF-15 had a significant positive correlation with both mPAP and PVR, suggesting a pathological role that is directly linked to the increased pressure in pulmonary vasculature [12]. Moreover, Nickel et al. revealed that GDF-15 was abundantly found in pulmonary vascular endothelial cells in patients with idiopathic PH suggesting that it had a role in the pathogenesis of PH [8].
The novel finding in our study is that GDF-15 can be used to diagnose PH in CHD children with a high sensitivity reaching 95% and a high specificity of 100% at cutoff level of more than 0.313 nmol/ml denoting that GDF-15 can be used as a promising biomarker to diagnose PH in children with CHD. For the best of our knowledge, our study is the one of the few studies that reported GDF-15 as a good diagnostic biomarker in children with PH-CHD. Moreover, GDF-15 levels gave an idea about the severity of the disease in children with PH-CHD that can reflect on the plan of treatment. The limitations of the study are that it is a one-center study and comparison of GDF-15 with established biomarker such as BNP was not performed.
Conclusion
GDF-15 is elevated in infants and children with PH-CHD and can be a promising diagnostic biomarker in these patients.
Ethics Committee Approval
The study was approved by the Ethics Committee of Faculty of Medicine, Tanta University.
Funding
None.
Conflicts of Interest
None.
Article Info
Article Type
Research ArticlePublication history
Received: Sat 18, Jan 2020Accepted: Tue 04, Feb 2020
Published: Fri 07, Feb 2020
Copyright
© 2023 Doaa El Amrousy. This is an open-access article distributed under the terms of the Creative Commons Attribution License, which permits unrestricted use, distribution, and reproduction in any medium, provided the original author and source are credited. Hosting by Science Repository.DOI: 10.31487/j.CDM.2019.01.04
Figures & Tables
Table 1: Demographic, clinical, laboratory and echocardiographic parameters in the studied groups.
|
Variable |
PH-CHD patients |
CHD only patients |
Healthy control |
p |
p1 |
p2 |
p3 |
|
Age (months) |
8.3±2.6 |
8.7±3.1 |
8±2.5 |
NS |
|
|
|
|
Sex (male: female) |
26:24 |
23:27 |
25:25 |
NS |
|
|
|
|
Weight |
6.7±0.8 |
7.2 ±1.2 |
9.2±1.3 |
0.001 |
NS |
0.001* |
0.01* |
|
HR(b/m) |
124 ± 21.8 |
117.3 ±23.9 |
90.5 ± 18.9 |
0.001* |
NS |
0.001* |
0.001* |
|
RR (cycle/m) |
46.1 ± 7.5 |
43.6 ±6.9 |
35.2 ± 4.3 |
0.001* |
NS |
0.001* |
0.01* |
|
GDF-15 (nmol/ml) |
0.62 ± 0.2 |
0.21 ± 0.06 |
0.13 ± 0.02 |
<0.001* |
0.001* |
<0.001* |
<0.001* |
|
mPAP (mm Hg) |
47.3 ± 13.8 |
16.2 ± 4.5 |
12.6 ± 3.9 |
<0.001* |
<0.001* |
<0.001* |
NS |
|
PVR(Wood unit) |
3.1±0.9 |
1.5±0.3 |
|
|
|
|
|
|
RVOT FS% |
35.8 ± 8.2 |
33.5 ± 7.2 |
36.9 ± 4.9 |
NS |
|
|
|
|
RV E/A ratio |
1 ± 0.3 |
1.3 ± 0.2 |
1.3 ± 0.1 |
0.01* |
0.001* |
0.001* |
NS |
p: p value for comparison between the three studied groups.
p1: p value for comparison between PH-CHD and CHD groups.
p2: p value for comparison between PH-CHD and control groups.
p3: p value for comparison between CHD and control groups.
*means significant, NS: non-significant, HR: heart rate, b/m: beat per minute, RR: respiratory rate, GDF: growth differentiation factor, mPAP: mean pulmonary artery pressure, PVR: pulmonary vascular resistance, RVOT FS: right ventricular outlet fraction shortening, RV: right ventricle, E/A ratio: ratio of the early (E) to late (A) ventricular filling velocities.
Table 2: Plasma GDF-15 levels in different grades of PH in PAH-CHD group.
|
GDF-15 (nmol/ml) |
Grades of PH |
p |
||
|
Mild (n = 20) |
Moderate (n =14) |
Severe (n =16) |
||
|
Mean ± SD. |
0.4 ± 0.1 |
0.7 ± 0.3 |
1.1 ± 0.1 |
|
|
Post –Hoc analysis |
Mild vs moderate |
Mild vs severe |
Moderate vs severe |
|
|
p1=0.02* |
p2=0.002* |
p3=0.001* |
||
p: p value for association between different grades of PH.
p1: p value for comparison between mild and moderate PH.
p2: p value for comparison between mild and severe PH.
p3: p value for comparison between moderate and severe PH.
*means significant, GDF: growth differentiation factor, PH: pulmonary hypertension
References
- Ivy DD, Abman SH, Barst RJ, Berger RM, Bonnet D et al. (2013) Pediatric pulmonary hypertension. J Am Coll Cardiol 62: D117-D126. [Crossref]
- Saleh A, Shabana A, El Amrousy D, Zoair A (2019) Predictive value of P-wave and QT interval dispersion in children with congenital heart disease and pulmonary arterial hypertension. J Saudi Heart Assoc 31: 57-63. [Crossref]
- Foris V, Kovacs G, Tscherner M, Olschewski A, Olschewski H (2013) Biomarkers in pulmonary hypertension: what do we know. Chest 144: 274-283. [Crossref]
- Farag M, El Amrousy D, El Serogy H, Zoair A (2018) Role of plasma asymmetric dimethyl-L-arginine levels in detection of pulmonary hypertension in children with CHD. Cardiol Young 28: 1163-1168. [Crossref]
- Li G, Tang L, Jia P, Zhao J, Liu D et al. (2016) Elevated Plasma Connective Tissue Growth Factor Levels in Children with Pulmonary Arterial Hypertension Associated with Congenital Heart Disease. Pediatr Cardiol 37: 714-721. [Crossref]
- Bootcov MR, Bauskin AR, Valenzuela SM, Moore AG, Bansal M et al. (1997) MIC-1, a novel macrophage inhibitory cytokine, is a divergent member of the TGF-beta superfamily. Proc Natl Acad Sci USA 94: 11514-11519. [Crossref]
- Kempf T, Eden M, Strelau J, Naguib M, Willenbockel C et al. (2006) The transforming growth factor-beta superfamily member growth-differentiation factor-15 protects the heart from ischemia/reperfusion injury. Circ Res 98: 351-360. [Crossref]
- Nickel N, Jonigk D, Kempf T, Bockmeyer CL, Maegel L et al. (2011) GDF-15 is abundantly expressed in plexiform lesions in patients with pulmonary arterial hypertension and affects proliferation and apoptosis of pulmonary endothelial cells. Respir Res 12: 62. [Crossref]
- Xu J, Kimball TR, Lorenz JN, Brown DA, Bauskin AR et al. (2006) GDF15/MIC-1 functions as a protective and antihypertrophic factor released from the myocardium in association with SMAD protein activation. Circ Res 98: 342-350. [Crossref]
- Anand IS, Kempf T, Rector TS, Tapken H, Allhoff T et al. (2010) Serial measurement of growth-differentiation factor-15 in heart failure: relation to disease severity and prognosis in the Valsartan Heart Failure Trial. Circulation 122: 1387-1395. [Crossref]
- Norozi K, Buchhorn R, Yasin A, Geyer S, Binder L et al. (2011) Growth differentiation factor 15: an additional diagnostic tool for the risk stratification of developing heart failure in patients with operated congenital heart defects? Am Heart J 162: 131-135. [Crossref]
- Li G, Li Y, Tan XQ, Jia P, Zhao J et al. (2017) Plasma Growth Differentiation Factor-15 is a Potential Biomarker for Pediatric Pulmonary Arterial Hypertension Associated with Congenital Heart Disease. Pediatr Cardiol 38: 1620-1626. [Crossref]
- Lindqvist P, Henein M, Kazzam E (2003) Right ventricular outflow tract fractional shortening: an applicable measure of right ventricular systolic function. Eur J Echocardiogr 4: 29-35. [Crossref]
- Ho JE, Wang TJ (2012) Growth differentiation factor 15: a canary in a coal mine? Clin Chem 58: 3-5. [Crossref]