Integrative Analysis of HMMR as a Potential Target of Prognosis and Therapy in Hepatocellular Carcinoma
A B S T R A C T
Background: Previous work has indicated Hyaluronic acid-mediated motor receptor (HMMR) plays an important role in regulating tumor metastasis. However, few researchers address the clinical significance of HMMR and its underlying mechanisms for regulating hepatocellular carcinoma (HCC). This study focuses on the underlying effect of HMMR in the development and prognosis of HCC.
Materials and Methods: In the present study, data of RNA and miRNA sequencing array were obtained from Oncomine dataset or The Cancer Genome Atlas (TCGA) dataset, the distinctive genomic patterns associated with HMMR expression and its correlation with prognosis were analysed by using R package. Gene set enrichment analysis (GSEA) were performed on genes expressed aberrantly. We also performed Reverse Transcription-polymerase Chain Reaction (RT-PCR), Immunohistochemical (IHC) staining and Western blotting analysis to evaluate the expression of HMMR in liver cancer cell lines or 12 HCC samples from The Affiliated Hospital of Southwest Medical University.
Results: A total of 407 tumor tissue samples in TCGA dataset were evaluated, combined with analysis in Oncomine dataset, we found HMMR expression was increased in HCC compared to normal tissues. Higher expression of HMMR was correlated with poorer overall survival and disease-free survival outcomes. Moreover, multivariate Cox regression analysis revealed that HMMR expression was an independent risk factor for overall survival (HMMR: hazard ratio [HR] = 1.154, 95% confidence interval [CI] = 1.080-1.233, p<0.001). Consistently, RT-PCR, IHC staining and Western blotting analysis further confirmed that HMMR expression was increased in HCC compared with patient-matched adjacent normal liver tissues. Notably, GSEA analysis revealed that differential gene expression in HMMR-high patients (compared with HMMR-low patients) were enriched in cell proliferation and p53 signaling pathway. Moreover, comprehensive analysis showed a strong correlation between HMMR upregulation and miRNA changes.
Conclusion: The high expression of HMMR is a poor prognostic factor in HCC and might serve as a potential target of therapy in patients with HCC.
Keywords
Hepatocellular carcinoma, prognosis, HMMR, TCGA, therapeutic target
Introduction
Hepatocellular carcinoma (HCC) is one of the major malignant tumors and has become the third leading cause of cancer-related death in the world [1]. An epidemiological investigation shows that 4 million new cases diagnosed in 2015, and it keeps on an upward trend [2]. HCC has poor prognosis, 60% of patients still have a high risk of local recurrence and distant metastasis, even surgical excision and postoperative adjuvant chemotherapy were adopted [3]. The emergence of various targeted drugs such as sorafenib or regorafenib has prolonged the survival of patients with HCC. However, the overall life expectancy is still less than 1 year [4-6]. The pathogenesis of HCC is extremely complex, a series of biological events within tumor microenvironment have been identified as effective prognostic biomarkers for HCC [7]. It might be possible to discover new drug targets for HCC by integrating various molecules in gene networks associated with tumor formation and progression.
Hyaluronan-mediated motility receptor [HMMR, also known as receptor for hyaluronate-mediated motility (RHAMM)], which belongs to a group of hyaladherins, has the common ability to bind to hyaluronic acid (HA) [8]. HMMR performs multiple functions, which can interact with signal pathways of the microtubules, calmodulin, actin and extracellular regulated kinase (ERK) [9]. HMMR, cluster differentiation 44 (CD44) and HA constitute a trimer complex on the cell surface, which activates cell signaling pathways involved in cell migration, invasion and proliferation [10]. Intracellularly, HMMR participates in the assembly of microtubule spindle, thus promoting cell cycle progression [11]. Higher HMMR expression was reported to be related to upregulated genes involved in G2M checkpoint, E2F Targets and Myc Targets V [12]. These effects suggest a potential role for HMMR as a therapeutic target for cancer patients. Actually, HMMR has been reported to be highly expressed in various tumor cells such as colon cancer, bladder cancer, endometrial cancer and breast cancer and has become a target for some tumor immunotherapy [13-18]. However, the prognostic value of HMMR expression and its underlying mechanisms for the regulation of hepatocarcinogenesis are still poorly understood.
In this study, we used the Oncomine database and the Cancer Genome Atlas (TCGA) database to analyse the sequencing data of HMMR and the gene regulatory network in HCC. Reverse Transcription-polymerase Chain Reaction (RT-PCR) analysis were performed to detect the expression of HMMR in 4 liver cancer cell lines and 12 HCC patient samples from The Affiliated Hospital of Southwest Medical University. The clinical and histopathological features of hepatocellular carcinoma specimens were evaluated by immunohistochemistry and immunoblotting. In addition, we assessed the association of HMMR expression with transcriptome profiles and microRNA (miRNA) in HCC. Our results indicate that higher expression of HMMR was correlated with poorer prognosis. Gene enrichment analysis further demonstrated that revealed that differential gene expression in HMMR-high patients (compared with HMMR-low patients) were enriched in cell proliferation and p53 signaling pathway. Compared with previous studies, our work aims to provide evidence for HMMR acting as a prognostic biomarker, thus, potentially reveal a new target and strategy for HCC diagnosis and treatment.
Materials and Methods
I Patients and Samples
Consecutive series of 12 cases of HCC and 12 cases of adjacent tissues specimens were collected from The Affiliated Hospital of Southwest Medical University. Patients with a previous history of other primary tumors or those who had received chemotherapy and/or radiotherapy were excluded from this study. The pathologist analysed the tumor samples and made a definitive diagnosis. All liver tissue samples from surgical excision were stored at -80°C. This study was approved by the ethics committee of The Affiliated Hospital of Southwest Medical University.
II Cell Culture
Liver cell line L02, Hep3B, SMMC-7721, LM3 and Huh7 cells were purchased from the American Type Culture Collection (ATCC). All cells were cultured in complete culture medium (DMEM (Gibco) plus GlutaMAX, Pen/Strep, and 10% (v/v) fetal bovine serum (FBS) (Gibco), and grown in cell incubator (5% CO2) at 37°C. Before harvest, cells were inoculated into a 6-pore plate at a density of 1×10⁶ cells for 24 hour at 37°C. For RT-PCR analysis, total RNA of cell samples was extracted by using 1 milliliters TRIzol reagent (Invitrogen) per well. For Western blotting analysis, cell culture media were removed and washed with ice-cold phosphate-buffered saline (PBS) for 3 times, then, cellular extracts were collected by using RIPA buffer. All data from cell lines were repeated in 3 independent experiments.
III RT-PCR Analysis
Total RNA was extracted from the cells and human liver tissue by using the TRIzol reagent (Invitrogen) as previously described [19]. For quantitative RT-PCR analysis, 1 µg of total RNA was reverse-transcribed using the cDNA Reverse-Transcription Kit (Takara). SYBR Green reactions were assembled along with 250 nM primers using SYBR Green PCR Master Mix (Bio-Rad), and performed with a Bio-Rad C1000 thermal cycler CFX96 Real-Time System. The primers were as follows: HMMR forward, 5‘- AGAACCAACTCAAGCAACAGG-3’ and reverse, 5‘-AGGAGACGCCACTTGTTAATTTC-3’. GAPDH forward, 5‘-ACAACTTTGGTATCGTGGAAGG-3’ and reverse, 5‘-GCCATCACGCCACAGTTTC-3’. Relative expression of HMMR was determined after normalization to GAPDH.
IV Western Blotting Analysis
Protein of HCC tissue samples were extracted by using RIPA buffer supplemented with proteinase and phosphorylase inhibitor (Roche) as described [20]. Then, a BCA kit (Thermo) was used to detect protein concentration. Proteins (20μg) from tissue or cell lysate were loaded in each lane and fractionated by 10% polyacrylamide gels (SDS-PAGE) at 110 volts, and then transferred to PVDF membrane (Millipore) for 3 hour at 250 milliampere. After blocking with 5% nonfat milk for 1 hour at room temperature, the membranes were incubated the primary antibodies HMMR (Zen- bioscience, 1/2000) and GAPDH (Zen-bioscience, 1/2000) at 4°C overnight. After washing 5 times with PBS-Tween-20 solution, the membranes were incubated with a horseradish peroxidase (HRP)-conjugated anti-rabbit secondary antibody (Zen-bioscience, 1/10000) for 2 hour. The signals were detected by using enhanced chemiluminescence (Millipore).
V Immunohistochemistry Analysis
IHC staining was performed to detect the HMMR expression in tumor and patient- matched adjacent normal liver tissue from HCC samples. All tissues were fixed in 10% neutral-buffered formalin for 48 hour, then embedded in paraffin, and cut into 5µm sections. Paraffin slices were deparaffinized and rehydrated in gradient alcohol series and distilled water, then immersed in Citrate Antigen Retrieval solution (pH 6.0) and boiled for 10 minutes twice. After slow cooling down, endogenous peroxidase activities were quenched by 3% H2O2 (diluted with methanol) for 30 minutes. Slices were washed 3 times in distilled water and immersed in 5% donkey serum (Dako) for 15 minutes, followed with HMMR antibodies (Zen-bioscience, 1/200) incubation 4°C overnight. After washed in distilled water 3 times, slices were incubated with HRP-conjugated secondary antibody (Dako) for 1 hour. Nuclei were counterstained with hematoxylin. HMMR IHC staining images were observed and captured using the NDP.view.2 software programme. All representative images were repeated in 3 independent experiments.
VI Oncomine Database Analysis
The mRNA expression of HMMR in HCC were analysed within the Oncomine 4.5 database (Link1). Oncomine is currently the world’s largest oncogene chip database and integrated data mining platform, with 715 gene expression databases and more than 86,000 samples of cancer and normal tissues collected so far. This database was used to classify common cancer types and their respective normal tissues by differential expression classification and to perform clinical and pathological analysis. This analysis focus on HMMR expression in Wurmbach Liver, Roessler Liver, and Chen Liver [21-23]. p˂0.05 considered to be statistically significant.
VII TCGA Database Analysis
Raw counts of gene expression and corresponding clinical information of HCC patients were obtained from the TCGA data portal (Link2). X-tile software was used to find the optimal cutting-off point to divide patients into subgroups with different survival outcomes based on HMMR expression, Kaplan-Meier method and log-rank analyses were used to analyse survival curves of these subsets [24]. To assess gene expression between HMMR -high and -low patients, expression profile data were ranked from low to high quartiles according to the HMMR expression, and data in the bottom 25% and top 25% were selected as low and high groups. R package edgeR (version 3.4.1) was used to analysis the differential gene expression between HMMR-high and -low patients [25]. Genes with counts per million (CPM) <1 were excluded. An adjusted p value <0.05 and the absolute FC>2.0 were considered to be statistically significant.
VIII Gene Functional and Pathway Analysis
We performed Gene Ontology (GO) terms and pathway enrichment analysis of predicted target genes by using Metascape database (Link3). Then, Gene set enrichment analysis (GSEA) were performed on the aberrantly expression genes between HMMR high- and low-expression patients as previous described [26]. Gene clusters with adjusted p<0.05 and false discovery rates (FDR) <0.05 were considered to be significantly enriched genes.
IX Integration of Gene Expression and Mirna Change
We retained raw counts of miRNA from the TCGA data portal (Link4). To investigate the potential miRNAs regulation by HMMR, we focused on aberrantly expressed miRNA (adjusted p value <0.05, absolute FC >2) from RNA-seq between HMMR-high and -low patients. Online analysis tool LinkedOmics (Link5) and TargetScan (Link6) were used to identify miRNAs potentially regulated by HMMR.
X Statistical Analyses
Data from RT-PCR were analysed in GraphPad Prism 7.0.4. Student’s t-test was used to analyse measurement data. R package ‘ggplot2’ was used to draw the different scatter plot, forest plot, volcano plot, venn plot and heatmap. A Cox regression model was used to estimate the hazard ratio (HR) and 95% confidence interval (Cl) associated with HMMR expression. p<0.05 was considered to be statistically significant.
Results
I HMMR Expression in HCC Based on Oncomine Database
We initially evaluated HMMR transcription levels in multiple hepatocellular carcinoma datasets from Oncomine database. Expression data of HMMR were obtained in 452 different types of tumor studies (Figure 1A). Among them, HMMR expression were significantly increased in 64 studies and decreased in 8 studies, most of which focus on Colorectal cancer, Lung cancer and Sarcoma. Expression of HMMR in hepatocellular carcinoma was significantly higher than in normal tissues in 4 Oncomine datasets (Figure 1B). We then filtered out Wurmbach Liver dataset to further analyses HMMR expression in subgroup with different clinic pathological features [21]. In this study, mRNA level of HMMR in hepatocellular carcinoma was higher than that in the cirrhosis, liver cell dysplasia and normal liver samples (Figure 1C). Invasion of malignant cells to endothelium is the major part of metastasis, we then assessed the relation of vascular invasion and the mRNA level of HMMR, and the results suggest that HMMR is upregulated in angiogenesis and metastases of HCC (Figure 1D) [27, 28]. In summary, these results indicate that HMMR is upregulated in HCC tissue compared with normal liver tissue or other common liver disease, thus play an essential role in HCC progression.
Table 1: Cox regression model analysis of overall survival in
hepatocellular carcinoma.
|
Variables |
Univariate analysis |
p-value |
Multivariate analysis |
p-value |
||
|
HR |
95%Cl of HR |
HR |
95%Cl of HR |
|||
|
Age (<60 vs ≥60)
(years) |
1.005 |
0.987-1.023 |
0.591 |
1.010 |
0.990-1.031 |
0.311 |
|
Gender (Male vs Female) |
0.780 |
0.487-1.249 |
0.301 |
0.999 |
0.589-1.693 |
0.996 |
|
Grade (G1+G2 vs G3+G4) |
1.017 |
0.746-1.387 |
0.914 |
1.070 |
0.763-1.501 |
0.694 |
|
Stage (I-II vs III-IV) |
1.865 |
1.456-2.388 |
8.07e-07*** |
1.205 |
0.450-3.226 |
0.710 |
|
T1+T2 vs T3+T4 |
1.804 |
1.434-2.270 |
4.73e-07*** |
1.416 |
0.585-3.431 |
0.441 |
|
M1 vs M0 |
3.850 |
1.207-12.281 |
0.023* |
1.825 |
0.480-6.934 |
0.377 |
|
N0 + N1 vs N2 + N3 |
2.022 |
0.494-8.276 |
0.328 |
1.966 |
0.295-13.115 |
0.485 |
|
HMMR (low expression vs
high expression) |
1.153 |
1.090-1.220 |
7.51e-07*** |
1.154 |
1.080-1.233 |
2.16e-05*** |
*p <0.05; ***p<0.001.
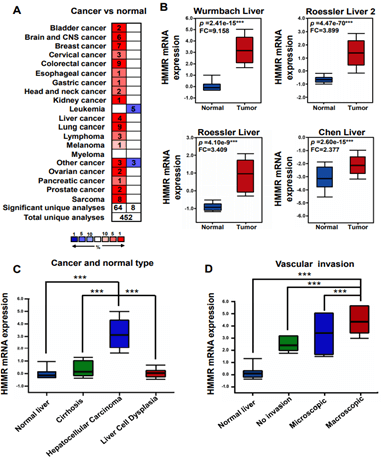
Figure 1: HMMR transcription in hepatocellular carcinoma based on the Oncomine database. A) Expression of HMMR in all tumor studies in the Oncomine database. B) the relative mRNA expression of HMMR in four Oncomine datasets. Data represent the mean ± SD. ***p<0.001. C) & D) Expression of HMMR in different liver cancer subgroup in Wurmbach Liver datasets. ***p<0.001.
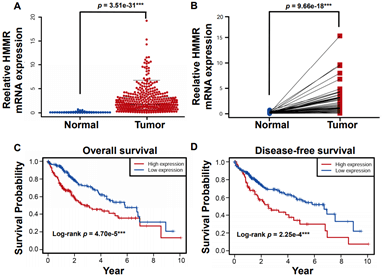
Figure 2: HMMR is upregulated in HCC tissues and predicts poorer survival outcomes in the TCGA database. A) The relative mRNA expression of HMMR in the TCGA database. B) The relative level of HMMR expression is higher in HCC than patient-matched adjacent normal tissues. C) & D) Higher expression of HMMR predicts poorer outcomes of overall survival and disease-free survival in patients with HCC. Data represent the mean ± SD. ***p<0.001.
II HMMR Expression is Upregulated in HCC Based on TCGA Datasets
To further investigate the clinical relevance of HMMR in HCC, Microarray data of a total of 407 hepatocellular carcinoma tissue samples and 58 normal liver tissues were obtained from the TCGA dataset. Meanwhile, raw information of clinical parameters and survival data of cases were also obtained. The expression of the HMMR gene and clinical parameters in dataset was extracted by using R package. Consistent with Oncomine database, HMMR expression in TCGA database was identified to be significantly increased in HCC tissues compared with normal tissues (Figure 2A). In addition, paired t-test analysis revealed HMMR expression was higher in HCC patients than that in matched adjacent normal patients (Figure 2B).
By using X-tile software, 407 HCC patients were stratified into HMMR-high (n = 181) and -low (n = 226) subgroups. We then performed Kaplan-Meier analysis and found that higher expression of HMMR lead to poorer overall survival (Figure 2C) and disease-free survival outcomes (Figure 2D). Moreover, Cox regression model was established to analyse the independent factors including TMN stage, disease stages, tumor grade, age and gender on the survival prognosis. Univariate analysis demonstrated that clinical stage, T stage, M stage and higher HMMR expression were influential factors for HCC prognosis (all p<0.05) (Table 1). Multivariate analysis further showed that high expression of HMMR may serve as a potential independent prognostic factor for HCC patients (HMMR: HR = 1.154, 95% CI: 1.080-1.233, p<0.001) (Table 1 & Supplementary Figure 1).
III Gene Expression Levels of HMMR in Human Liver Cancer Cells and Tissues
To further validate the expression of HMMR in hepatocellular carcinoma, we performed RT-PCR analysis and Western blotting analysis in human liver cancer cells and tissues. RT-PCR analysis showed that HMMR mRNA expression in liver cancer cell lines (Hep3B, SMMC-7721, LM3 and Huh7) were higher than that in L02 (normal liver cell line) (Figure 3A). Among them, The HMMR upregulation were the most significant in LM3 and Huh7 cell lines. Similar results were obtained by using Western blotting analysis (Figure 3B).
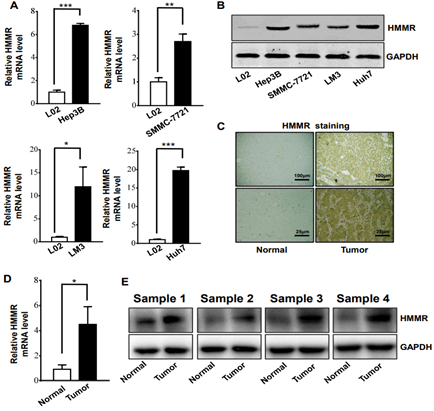
Figure 3: HMMR gene expression was increased in different liver cancer cells and tissue A) RT-PCR analysis of HMMR expression levels in liver cancer cell lines of SMMC-7721, Hep3B, Huh7, LM3 and normal liver cell lines (n = 3 experiments). B) Western blot analysis of HMMR expression levels in different liver cell lines. C) Representative immunohistochemistry staining of HMMR in HCC and patient-matched adjacent normal tissues. D) RT-PCR analysis of HMMR expression levels in HCC and adjacent normal tissues (n = 12). E) Western blot analysis of HMMR expression levels in HCC and patient-matched adjacent normal tissues. Data represent the mean ± SD. *p<0.05. **p<0.01. ***p<0.001.
Then, the expression of HMMR was evaluated in HCC samples and matched adjacent normal tissues from The Affiliated Hospital of Southwest Medical University. IHC analysis demonstrated that HMMR expression in HCC samples was increased compared with adjacent normal tissues (Figure 3C). Meanwhile, we utilized The Human Protein Atlas (Link7) database to explore the protein expression of the HMMR gene in HCC tissues and normal liver tissues. As shown in (Supplementary Figure 2), the positive degree of HMMR increases with the malignant degree of HCC (Supplementary Figure 2). In addition, HMMR expression in 12 human HCC tissues and paired normal tissues was detected by RT-PCR and Western blotting analysis (Figures 3D & 3E), consistently, HMMR mRNA and protein level were found to be significantly upregulated in HCC patients.
IV Underlying Mechanism of HMMR in Regulating HCC Progression
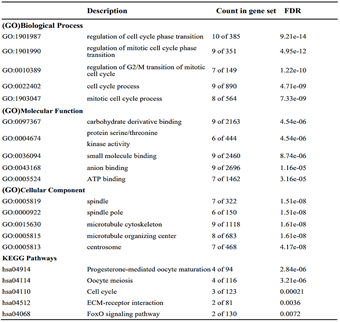
To explore the underlying mechanism of HMMR in regulating HCC progression, we firstly used the STRING platform (Link8) and Cytoscape 3.6.1 software to map the HMMR protein interaction network, which shows that HMMR could interact with genes including TPX2, NEK2, CD44 and CDK1 (Supplementary Figure 3), together regulate the cell cycle process and proliferation (Supplementary Table 1).To elucidate whether HMMR play a role in promoting HCC development, we performed an RNA sequence gene expression analysis. As mentioned previously, gene transcription data in the bottom 25% and top 25% based on HMMR expression were selected as low and high groups. By comparing the gene expression profiles of HMMR- high and -low groups, a total of 477 genes were upregulated significantly (>2-fold) (Figure 4A). By contrast, a total of 580 downregulated genes (>2-fold) were identified in HMMR-high group (Figure 4A). GO analysis was then performed to analyse the biologic pathways involved in HCC pathogenesis of differential genes stratified by HMMR expression level, the results showed that genome changes in patients with higher HMMR expression were related to cell cycle and DNA replication (Figures 4B & 4C; Supplementary Figure 4).
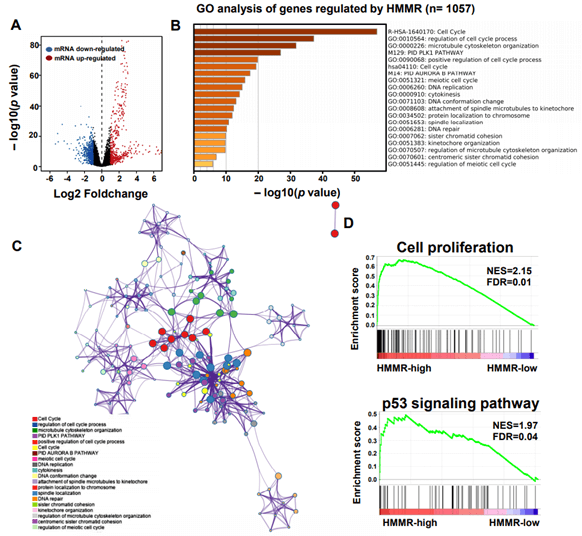
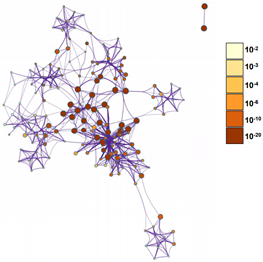
Figure 4: Identifying differentially expressed genes between HMMR-high and -low patients. A) Volcano plot of differential gene profiles between HMMR-high and -low groups. B) Top 20 functional path enrichment analysis heatmap enriched in HMMR- high patients. C) Network showing functional and pathway correlations. Different colours in the map represent different functional groups. D) GSEA analysis shows that genes involved in cell proliferation and p53 signaling pathway are enriched in HMMR- high patients. NES: Normalized Enrichment score; FDR: False Discovery Rates.
In addition, enrichment plots in GSEA analysis further demonstrated that gene signatures including cell proliferation and p53 signaling pathway were highly enriched in HMMR-high patients (Figure 4D). Furthermore, by using cBioPortal online analysis tool (Link9), we observed comparatively higher mutation rate of p53 gene exists in HMMR-altered patients with HCC (Supplementary Figure 5). p53 gene is proved to be a tumor suppressor that regulates the expression of a variety of genes, including apoptosis, cell cycle progression inhibition and growth inhibition [29]. HMMR might be a crucial gene in regulation of p53 mutation in patients with HCC. Thus, genes changes related to cell proliferation is strongly correlated with the up- regulation of HMMR.
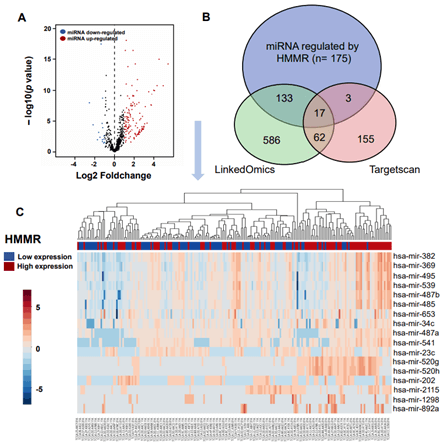
Figure 5: Integration of miRNA change and gene expression between HMMR-high and -low patients. A) Volcano plot of differentially expressed miRNAs between HMMR -high and -low groups. B) Venn diagrams demonstrating the number of miRNAs changed after up-regulation of HMMR, as well as the overlay with miRNA potentially regulated by HMMR in TargetScan and LinkedOmics database. C) Heatmap of miRNAs regulated by HMMR expression. Red indicates positively correlated miRNAs and blue indicates negatively correlated miRNAs.
Table 2: Integrative analysis of miRNA regulated by HMMR in
hepatocellular carcinoma.
|
miRNA |
Log FC |
Log CPM |
p Value |
FDR |
|
hsa-mir-1298 |
2.663881 |
-0.57208 |
5.15e-07 |
4.08e-06 |
|
hsa-mir-541 |
2.484783 |
1.749196 |
5.51e-10 |
1.11e-08 |
|
hsa-mir-520h |
2.404134 |
2.375414 |
0.000456 |
0.001362 |
|
hsa-mir-520g |
2.334209 |
3.377751 |
0.000695 |
0.001928 |
|
hsa-mir-653 |
2.109349 |
4.283337 |
6.82e-17 |
5.86e-15 |
|
hsa-mir-485 |
1.760869 |
3.894414 |
2.59e-09 |
3.80e-08 |
|
hsa-mir-487b |
1.683985 |
3.774609 |
2.24e-09 |
3.45e-08 |
|
hsa-mir-539 |
1.681184 |
4.102598 |
9.64e-10 |
1.80e-08 |
|
hsa-mir-487a |
1.628041 |
1.876996 |
2.49e-07 |
2.21e-06 |
|
hsa-mir-34c |
1.459062 |
3.079739 |
1.44e-05 |
7.55e-05 |
|
hsa-mir-382 |
1.302314 |
5.092798 |
2.68e-07 |
2.31e-06 |
|
hsa-mir-369 |
1.149297 |
4.716288 |
1.55e-05 |
7.77e-05 |
|
hsa-mir-495 |
1.132775 |
4.113906 |
8.75e-06 |
4.80e-05 |
|
hsa-mir-23c |
-1.06657 |
0.353962 |
0.001119 |
0.002907 |
|
hsa-mir-2115 |
-1.23348 |
-0.26416 |
0.005315 |
0.011737 |
|
hsa-mir-202 |
-1.60861 |
0.180996 |
0.000250 |
0.000808 |
|
hsa-mir-892a |
-1.73388 |
-0.06918 |
0.005508 |
0.012122 |
FC: Fold Change; CPM: Counts Per Million; FDR: False Discovery Rates.
V Correlation of miRNAs and DNA Methylation with HMMR Expression
MicroRNA (miRNA) is a class of non-coding single-stranded RNA molecules with a length of about 19-24 nucleotides, encoded by endogenous genes and has a variety of important regulatory roles in cells [30]. Many studies have shown that miRNAs participate in regulating tumorigenesis and metastasis [31, 32]. In our work, we sought to assess changes in miRNA after up-regulation of HMMR in patients with HCC. We retained data of 440 miRNAs sequence from TCGA database, of these, A total of 150 miRNAs were upregulated (>2-fold) and 15 miRNAs were downregulated (>2-fold) in HMMR-high group (compared with HMMR-low group, Figure 5A). By using TargetScan database, a total of 568 miRNAs were identified potentially regulated by HMMR. We then found 832 miRNAs may interacted with HMMR based on LinkedOmics database (Figure 5B). Venn diagrams demonstrated the number of changed miRNA identified from RNA-seq, as well as the overlay with the miRNA potentially regulated by HMMR from TargetScan and LinkedOmics database (Figure 5B). As shown in the heatmap and (Table 2), a total of 13 significant miRNA including hsa-mir-541 were positively correlated with HMMR up-regulation (Figure 5C). By contrast, 4 miRNAs (hsa-mir-23c, hsa-mir-2115, hsa-mir-202 and hsa-mir-892 a) were downregulated in HCC with higher HMMR expression. In addition to the regulation of miRNAs, DNA methylation leading to transcriptional silencing of tumor suppressor genes is also considered to be an important epigenetic abnormality in cancer [33-35]. However, the promoter methylation level of HMMR was similar in HCC patients with different grade and stage (Supplementary Figure 6). HMMR methylation might not be involved in the genesis and development of HCC.
Discussion
Although accumulating evidence has suggested that HMMR could be regarded as a novel biomarker and therapeutic target in many cancer types, research on HMMR as a prognostic marker for HCC is still limited. We analysed the relationship between HMMR expression and prognostic value in 407 patients with HCC in the TCGA datasets. Our results demonstrated that HCC patients with higher expression of HMMR was correlated with poorer overall survival and disease-free survival than those with HMMR lower expression. In addition, multivariate analysis revealed that higher expression of HMMR was an independent risk factor for overall survival rate. Taken together, these results show that HMMR lead to poorer survival outcomes, which might be acting as an independent factor for judging the prognosis of patients with HCC.
Our results were consistent with previous reports demonstrating the prognostic impact of HMMR on HCC36. In He et al.’s study, they only examined the HMMR expression in HCC patients by performing RT-PCR and IHC analysis [36]. By contrast, our study further performed in vitro validation experiments, and found HMMR is highly expressed in invasive liver cancer cell lines. Moreover, not only did we detect HMMR expression in HCC and patient-matched adjacent normal tissues, but we also assessed gene enrichment analysis between HMMR -high and -low HCC patients, and further demonstrated that gene signatures including cell proliferation and p53 signaling pathway were highly enriched in HMMR-higher patients. Comparatively higher mutation rate of p53 gene were also exists in HMMR-altered patients with HCC. Given that the tumor suppressor gene p53 can inhibit the expression of HMMR in G2/M phase, abnormal expression of HMMR might participate in p53 signaling associated anti-cancer effect [29]. Thus, our study provided more information of HMMR in HCC prognosis on what previously reported. In addition to regulation in cell cycle progression, recent studies have shown that HMMR promotes inflammation and fibrosis by activating the TGF-β/Smad2 signaling pathway [37-39]. Hepatic fibrosis is an essential pathological process involved in various chronic hepatic diseases that may deteriorate into hepatic cirrhosis and hepatic cancer, whether HMMR promotes fibrosis in HCC early development remain to be determined [40].
Chemotherapy is suggested to be the major method in the treatment of HCC, but resistance to multidrugs compromise therapeutic efficacy [41]. Zhang et al. observed that HMMR promoted epithelial-mesenchymal transition and render resistance to chemotherapy. HMMR knockdown significantly elevated the susceptibility of 5-Fu therapy [8]. Whether HMMR could act as a multi-drug resistance gene in patients with HCC is still unclear, therefore, it is important to explore the function of HMMR in the chemotherapeutic efficacy of hepatocellular carcinoma in our future study.
MiRNAs are small non-coding RNAs which function in the cleavage and posttranscriptional regulation of mRNAs [31]. Current studies have found that more than 200 miRNAs are significantly correlated with the tumorigenesis and treatment of liver cancer [31, 32]. Dysregulation of miRNA expression is believed to play a key role in HCC carcinogenesis [42]. In the past few years, several research groups have systematically studied the expression profiles of miRNAs in HCC. These results show that miRNAs are involved in the progression and metastasis of liver cancer and some other cancer- related pathways [43]. Hsa-mir-23c has been proved to suppress tumor growth of human hepatocellular carcinoma by attenuating erbb2 interacting protein (ERBB2IP), clinical trials indicated that HCC patients with lower expression of Hsa-mir-23c were associated with large tumor size and poor survival outcomes [44]. Of the differential miRNAs that potentially regulated by HMMR expression, we also found that hsa-mir-23c expression was downregulated in HMMR-high HCC group. Additionally, Krishnakumar D et al. indicate that hsa-mir-541 were consistently upregulated in human immune-deficiency virus type 1 (HIV-1) infected cells [45]. Genes involved in signal transduction, metabolism and cell death is speculated to be the functional targets of hsa-mir-541 [45]. Our data suggested that hsa-mir-541 expression was also upregulated in HMMR-high HCC patients. Thus, multiple synchronization existed between the expression of miRNA and its target gene. These results indicate that miRNA expression has a complex regulatory network with up-regulation of HMMR.
In addition to the regulation of miRNAs, long noncoding RNAs (lncRNA) play essential roles in carcinogenesis and tumor progression. An HMMR antisense lncRNA, HMMR-AS1, is reported to be upregulated in multiple tumors [46-49]. Li et al. revealed that HMMR-AS1 was increased in glioblastoma (GBM) cell lines and stabilizes HMMR mRNA. HMMR-AS1 knockdown radiosensitizes GBM by inhibiting DNA repair proteins including ATM and BMI1 [48]. Cai et al. further found HMMR-AS1 induces cell proliferation and metastasis in patients with lung adenocarcinoma by activating MiR-138/Sirt6 axis [46]. Moreover, HMMR-AS1 was significantly upregulated in human epithelial ovarian cancer, patients with higher HMMR-AS1 expression lead to poorer prognosis than those with lower expression [47]. Whether lncRNAs regulate the expression or function of HMMR in patients with HCC remain to be determined.
Conclusion
In summary, our study found that higher expression of HMMR predicts higher invasiveness and poorer prognosis of hepatocellular carcinoma and might be used as a candidate for tumor efficacy evaluation. However, the mechanisms of HMMR in tumor regulation are complicated, and involve many aspects. Further study is needed to validate the biological functions of HMMR on the pathogenesis of tumors.
Acknowledgements
We sincerely thank the researchers for providing their TCGA, Oncomine and The Human Protein Atlas databases information online, it’s our pleasure to acknowledge their contributions.
Author Contributions
Xuping Yang, Yilan Huang and Bin Yu designed this research, analysed both experimental and genomics data and wrote the manuscript, Qingze Fan and Qinhui Liu performed the IHC, RT-PCR and western blotting experiment, Xin Liu, Wanlong Zhu, Xiaoyan Zhong, Hengli Luo and Qimin Wei performed data collection and pre-processing of data.
Funding
This study was supported by research funding from the Science and Technology Planning Project of Sichuan Province (No.2019YFS0180), Science and Technology Programme of Luzhou (No.2018-JYJ-41, 2015LZCYD-SO2-9/11).
Availability of Data and Materials
All data generated or analysed in this study are included in this published article.
Ethics Approval and Consent to Participate
All of the patient samples used in this study were stored by the biobank of our hospital. HCC samples being used for this research was approved by the ethics committee of The Affiliated Hospital of Southwest Medical University (Luzhou city, Sichuan Province, China) before we start the experiment.
Consent for Publication
Not Applicable.
Conflicts of Interest
None.
Abbreviations
HMMR: Hyaluronan-Mediated Motility Receptor
RHAMM: Hyaluronate-Mediated Motility
HCC: Hepatocellular Carcinoma
TCGA: The Cancer Genome Atlas
RT-PCR: Transcription-Polymerase Chain Reaction
IHC: Immunohistochemical
HRP: Horseradish Peroxidase
miRNA: micro RNA
HA: Hyaluronic Acid
ERK: Extracellular Regulated Kinase
CD44: Cluster Differentiation 44
FBS: Fetal Bovine Serum
PBS: Phosphate-Buffered Saline
GO: Gene Ontology
GSEA: Gene Set Enrichment Analysis
FC: Fold Change
FDR: False Discovery Rates
NES: Normalized Enrichment Score
CPM: Counts Per Million
K-M: Kaplan-Meier
HR: Hazard Ratio
CI: Confidence Interval
ERBB2IP: Erbb2 Interacting Protein
HIV-1: Human Immunodeficiency Virus Type 1
PPI: Protein-Protein Interaction
KEGG: Kyoto Encyclopedia of Genes and Genomes
lncRNA: Long Noncoding RNAs
GBM: Glioblastoma
PPI: Protein-Protein Interaction; FDR: False Discovery Rate; GO: Gene Ontology; KEGG: Kyoto Encyclopedia of Genes and Genomes.
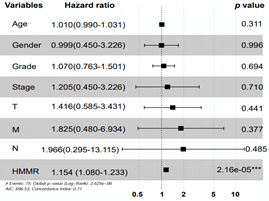
Supplementary Figure 1: Multivariate Cox regression model analysis of overall survival in hepatocellular carcinoma. Independent prognostic factors were assessed by using the multivariate Cox model and mapped as forest plot. The HRs are presented as the means with 95% confidence interval. ***p<0.001.
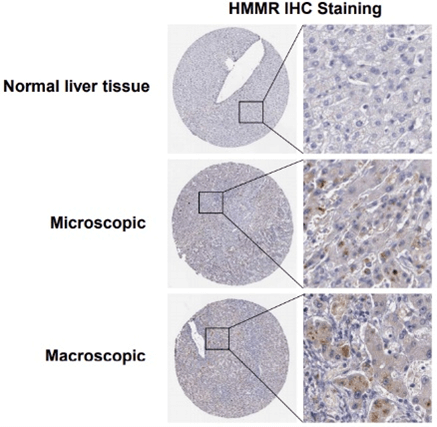
Supplementary Figure 2: HMMR IHC Staining in normal liver tissue and in hepatocellular carcinoma based on Human Protein Atlas database.
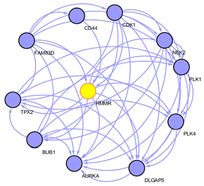
Supplementary Figure 3: Protein–protein interactions of HMMR plot as network in Cytoscape.
Supplementary Figure 4: Network showing functional and pathway correlations. The deeper the colour, the stronger the trend.
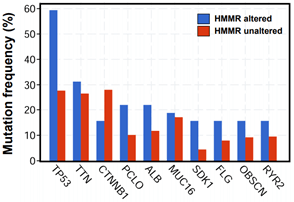
Supplementary Figure 5: Mutation frequency of genes in HMMR altered patients with HCC.
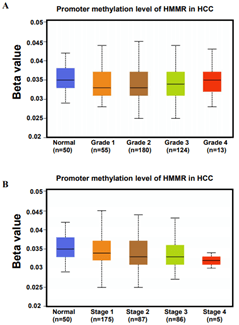
Supplementary Figure 6: Promoter methylation level of HMMR in patients with HCC in A) different grade and B) stage.
Article Info
Article Type
Research ArticlePublication history
Received: Mon 07, Dec 2020Accepted: Thu 07, Jan 2021
Published: Wed 24, Mar 2021
Copyright
© 2023 Yilan Huang. This is an open-access article distributed under the terms of the Creative Commons Attribution License, which permits unrestricted use, distribution, and reproduction in any medium, provided the original author and source are credited. Hosting by Science Repository.DOI: 10.31487/j.COR.2021.01.01
Figures & Tables
Table 1: Cox regression model analysis of overall survival in
hepatocellular carcinoma.
|
Variables |
Univariate analysis |
p-value |
Multivariate analysis |
p-value |
||
|
HR |
95%Cl of HR |
HR |
95%Cl of HR |
|||
|
Age (<60 vs ≥60)
(years) |
1.005 |
0.987-1.023 |
0.591 |
1.010 |
0.990-1.031 |
0.311 |
|
Gender (Male vs Female) |
0.780 |
0.487-1.249 |
0.301 |
0.999 |
0.589-1.693 |
0.996 |
|
Grade (G1+G2 vs G3+G4) |
1.017 |
0.746-1.387 |
0.914 |
1.070 |
0.763-1.501 |
0.694 |
|
Stage (I-II vs III-IV) |
1.865 |
1.456-2.388 |
8.07e-07*** |
1.205 |
0.450-3.226 |
0.710 |
|
T1+T2 vs T3+T4 |
1.804 |
1.434-2.270 |
4.73e-07*** |
1.416 |
0.585-3.431 |
0.441 |
|
M1 vs M0 |
3.850 |
1.207-12.281 |
0.023* |
1.825 |
0.480-6.934 |
0.377 |
|
N0 + N1 vs N2 + N3 |
2.022 |
0.494-8.276 |
0.328 |
1.966 |
0.295-13.115 |
0.485 |
|
HMMR (low expression vs
high expression) |
1.153 |
1.090-1.220 |
7.51e-07*** |
1.154 |
1.080-1.233 |
2.16e-05*** |
*p <0.05; ***p<0.001.
Table 2: Integrative analysis of miRNA regulated by HMMR in
hepatocellular carcinoma.
|
miRNA |
Log FC |
Log CPM |
p Value |
FDR |
|
hsa-mir-1298 |
2.663881 |
-0.57208 |
5.15e-07 |
4.08e-06 |
|
hsa-mir-541 |
2.484783 |
1.749196 |
5.51e-10 |
1.11e-08 |
|
hsa-mir-520h |
2.404134 |
2.375414 |
0.000456 |
0.001362 |
|
hsa-mir-520g |
2.334209 |
3.377751 |
0.000695 |
0.001928 |
|
hsa-mir-653 |
2.109349 |
4.283337 |
6.82e-17 |
5.86e-15 |
|
hsa-mir-485 |
1.760869 |
3.894414 |
2.59e-09 |
3.80e-08 |
|
hsa-mir-487b |
1.683985 |
3.774609 |
2.24e-09 |
3.45e-08 |
|
hsa-mir-539 |
1.681184 |
4.102598 |
9.64e-10 |
1.80e-08 |
|
hsa-mir-487a |
1.628041 |
1.876996 |
2.49e-07 |
2.21e-06 |
|
hsa-mir-34c |
1.459062 |
3.079739 |
1.44e-05 |
7.55e-05 |
|
hsa-mir-382 |
1.302314 |
5.092798 |
2.68e-07 |
2.31e-06 |
|
hsa-mir-369 |
1.149297 |
4.716288 |
1.55e-05 |
7.77e-05 |
|
hsa-mir-495 |
1.132775 |
4.113906 |
8.75e-06 |
4.80e-05 |
|
hsa-mir-23c |
-1.06657 |
0.353962 |
0.001119 |
0.002907 |
|
hsa-mir-2115 |
-1.23348 |
-0.26416 |
0.005315 |
0.011737 |
|
hsa-mir-202 |
-1.60861 |
0.180996 |
0.000250 |
0.000808 |
|
hsa-mir-892a |
-1.73388 |
-0.06918 |
0.005508 |
0.012122 |
FC: Fold Change; CPM: Counts Per Million; FDR: False Discovery Rates.
PPI: Protein-Protein Interaction; FDR: False Discovery Rate; GO: Gene Ontology; KEGG: Kyoto Encyclopedia of Genes and Genomes.
References
1.
Sia D, Villanueva
A, Friedman SL, Llovet JM (2017) Liver Cancer Cell of Origin, Molecular Class,
and Effects on Patient Prognosis. Gastroenterology 152: 745-761. [Crossref]
2.
Chen W, Zheng R,
Baade PD, Zhang S, Zeng H et al. (2016) Cancer statistics in China, 2015. Ca
Cancer J Clin 66: 115-132. [Crossref]
3.
Yeh MM (2010)
Pathology of combined hepatocellular-cholangiocarcinoma. J Gastroenterol
Hepatol 25: 1485-1492. [Crossref]
4.
Sun T, Liu H,
Ming L (2017) Multiple Roles of Autophagy in the Sorafenib Resistance of
Hepatocellular Carcinoma. Cell Physiol Biochem 44: 716-727. [Crossref]
5.
Bruix J, Qin S,
Merle P, Granito A, Huang YH et al. (2017) Regorafenib for patients with
hepatocellular carcinoma who progressed on sorafenib treatment (RESORCE): a
randomised, double-blind, placebo-controlled, phase 3 trial. Lancet 389:
56-66. [Crossref]
6.
Kim K, Jha R,
Prins PA, Wang H, Chacha M et al. (2017) Regorafenib in advanced hepatocellular
carcinoma (HCC): considerations for treatment. Cancer Chemother Pharmacol
80: 945-954. [Crossref]
7.
Tsuchiya N,
Sawada Y, Endo I, Saito K, Uemura Y et al. (2015) Biomarkers for the early
diagnosis of hepatocellular carcinoma. World J Gastroenterol 21: 10573-
10583. [Crossref]
8.
Zhang H, Ren L,
Ding Y, Li F, Chen X et al. (2019) Hyaluronan-mediated motility receptor
confers resistance to chemotherapy via TGFbeta/Smad2-induced
epithelial-mesenchymal transition in gastric cancer. FASEB J 33:
6365-6377. [Crossref]
9.
Bahrami SB, Tolg
C, Peart T, Symonette C, Veiseh M et al. (2017) Receptor for hyaluronan
mediated motility (RHAMM/HMMR) is a novel target for promoting subcutaneous
adipogenesis. Integr Biol (Camb) 9: 223-237. [Crossref]
10. Mele V, Sokol L, Kolzer VH, Pfaff D, Muraro MG et al.
(2017) The hyaluronan-mediated motility receptor RHAMM promotes growth,
invasiveness and dissemination of colorectal cancer. Oncotarget 8:
70617-70629. [Crossref]
11. Leng Y, Abdullah A, Wendt MK, Calve S (2019)
Hyaluronic acid, CD44 and RHAMM regulate myoblast behavior during
embryogenesis. Matrix Biol 78-79: 236-254. [Crossref]
12. Yang D, Ma Y, Zhao P, Ma J, He C (2019) Systematic
screening of protein-coding gene expression identified HMMR as a potential
independent indicator of unfavorable survival in patients with papillary
muscle-invasive bladder cancer. Biomed Pharmacother 120: 109433. [Crossref]
13. Xu J, Zhang Y, Xu J, Wang M, Liu G et al. (2019)
Reversing tumor stemness via orally targeted nanoparticles achieves efficient
colon cancer treatment. Biomaterials 216: 119247. [Crossref]
14. Stone R 2nd, Sabichi AL, Gill J, Lee IL, Adegboyega P
et al. (2010) Identification of genes correlated with early-stage bladder
cancer progression. Cancer Prev Res (Phila) 3: 776-786. [Crossref]
15. Fusco N, Lopez G, Corti C, Pesenti C, Colapietro P et
al. (2018) Mismatch Repair Protein Loss as a Prognostic and Predictive
Biomarker in Breast Cancers Regardless of Microsatellite Instability. JNCI
Cancer Spectr 2: pky056. [Crossref]
16. Bidadi B, Liu D, Kalari KR, Rubner M, Hein A et al.
(2018) Pathway-Based Analysis of Genome-Wide Association Data Identified SNPs
in HMMR as Biomarker for Chemotherapy- Induced Neutropenia in Breast Cancer
Patients. Front Pharmacol 9: 158. [Crossref]
17. Hauser Kawaguchi A, Tolg C, Peart T, Milne M, Turley
EA et al. (2018) A truncated RHAMM protein for discovering novel therapeutic
peptides. Bioorg Med Chem 26: 5194-5203. [Crossref]
18. Yang C, Li C, Zhang P, Wu W, Jiang X (2017) Redox
Responsive Hyaluronic Acid Nanogels for Treating RHAMM (CD168) Over-expressive
Cancer, both Primary and Metastatic Tumors. Theranostics 7: 1719-1734. [Crossref]
19. Pu S, Ren L, Liu Q, Kuang J, Shen J et al. (2016) Loss
of 5-lipoxygenase activity protects mice against paracetamol-induced liver
toxicity. Br J Pharmacol 173: 66-76. [Crossref]
20. Yao L, Cui X, Chen Q, Yang X, Fang F et al. (2017)
Cold-Inducible SIRT6 Regulates Thermogenesis of Brown and Beige Fat. Cell
Rep 20: 641-654. [Crossref]
21. Wurmbach E, Chen YB, Khitrov G, Zhang W, Roayaie S et
al. (2007) Genome-wide molecular profiles of HCV-induced dysplasia and
hepatocellular carcinoma. Hepatology 45: 938-947. [Crossref]
22. Roessler S, Jia HL, Budhu A, Forgues M, Ye QH et al.
(2010) A unique metastasis gene signature enables prediction of tumor relapse
in early-stage hepatocellular carcinoma patients. Cancer Res 70:
10202-10212. [Crossref]
23. Chen X, Cheung ST, So S, Fan ST, Barry C et al. (2002)
Gene expression patterns in human liver cancers. Mol Biol Cell 13:
1929-1939. [Crossref]
24. Camp RL, Dolled Filhart M, Rimm DL (2004) X-tile: a new
bio-informatics tool for biomarker assessment and outcome-based cut-point
optimization. Clin Cancer Res 10: 7252-7259. [Crossref]
25. Robinson MD, McCarthy DJ, Smyth GK (2010) edgeR: a
Bioconductor package for differential expression analysis of digital gene
expression data. Bioinformatics 26: 139-140. [Crossref]
26. Liu X, Wang J, Chen M, Liu S, Yu X et al. (2019)
Combining data from TCGA and GEO databases and reverse transcription
quantitative PCR validation to identify gene prognostic markers in lung cancer.
Onco Targets Ther 12: 709-720. [Crossref]
27. Joyce JA, Pollard JW (2009) Microenvironmental
regulation of metastasis. Nat Rev Cancer 9: 239-252. [Crossref]
28. Quail DF, Joyce JA (2013) Microenvironmental
regulation of tumor progression and metastasis. Nat Med 19: 1423-1437. [Crossref]
29. Hideshima T, Cottini F, Nozawa Y, Seo HS, Ohguchi H et
al. (2017) p53-related protein kinase confers poor prognosis and represents a
novel therapeutic target in multiple myeloma. Blood 129: 1308-1319. [Crossref]
30. Liu B, Li J, Cairns MJ (2014) Identifying miRNAs,
targets and functions. Brief Bioinform 15: 1-19. [Crossref]
31. Bartel DP (2009) MicroRNAs: target recognition and
regulatory functions. Cell 136: 215-233. [Crossref]
32. Hutvagner G, Zamore PD (2002) A microRNA in a
multiple-turnover RNAi enzyme complex. Science 297: 2056-2060. [Crossref]
33. Verma M (2015) The Role of Epigenomics in the Study of
Cancer Biomarkers and in the Development of Diagnostic Tools. Adv Exp Med
Biol 867: 59-80. [Crossref]
34. Lugli A, Zlobec I, Gunthert U, Minoo P, Baker K et al.
(2006) Overexpression of the receptor for hyaluronic acid mediated motility is
an independent adverse prognostic factor in colorectal cancer. Mod Pathol
19: 1302-1309. [Crossref]
35. Koelzer VH, Huber B, Mele V, Iezzi G, Trippel M et al.
(2015) Expression of the hyaluronan-mediated motility receptor RHAMM in tumor
budding cells identifies aggressive colorectal cancers. Hum Pathol 46:
1573-1581. [Crossref]
36. He X, Liao W, Li Y, Wang Y, Chen Q et al. (2015)
Upregulation of hyaluronan-mediated motility receptor in hepatocellular
carcinoma predicts poor survival. Oncol Lett 10: 3639-3646. [Crossref]
37. Yang Y, Han CY, Guan QB, Ruan SL (2018)
Interleukin-17-mediated inflammation promotes nonalcoholic fatty liver disease
in mice with regulation of M1-type macrophage polarization. Zhonghua Gan
Zang Bing Za Zhi 26: 916-921. [Crossref]
38. Abu Halima M, Ayesh BM, Hart M, Alles J, Fischer U et
al. (2019) Differential expression of miR-23a/b- 3p and its target genes in
male patients with subfertility. Fertil Steril 112: 323.e2-335.e2. [Crossref]
39. Truong JL, Liu M, Tolg C, Barr M, Dai C et al. (2019)
Creating a Favorable Micro-Environment for Fat Grafting in a Novel Model of
Radiation Induced Mammary Fat Pad Fibrosis. Plast Reconstr Surg 145: 116-126. [Crossref]
40. Jiao J, Friedman SL, Aloman C (2009) Hepatic fibrosis.
Curr Opin Gastroenterol 25: 223-229. [Crossref]
41. Dutta R, Mahato RI (2017) Recent advances in
hepatocellular carcinoma therapy. Pharmacol Therapeut 173: 106-117. [Crossref]
42. Yang N, Ekanem NR, Sakyi CA, Ray SD (2015)
Hepatocellular carcinoma and microRNA: new perspectives on therapeutics and
diagnostics. Adv Drug Deliv Rev 81: 62-74. [Crossref]
43. Sulaiman SA, Abu N, Ab Mutalib NS, Low TY, Jamal R
(2019) Signatures of gene expression, DNA methylation and microRNAs of hepatocellular
carcinoma with vascular invasion. Future Oncol 15: 2603-2617. [Crossref]
44. Zhang L, Wang Y, Wang L, Yin G, Li W et al. (2018)
miR-23c suppresses tumor growth of human hepatocellular carcinoma by
attenuating ERBB2IP. Biomed Pharmacother 107: 424-432. [Crossref]
45. Devadas K, Biswas S, Haleyurgirisetty M, Ragupathy V,
Wang X et al. (2016) Identification of Host Micro RNAs That Differentiate HIV-1
and HIV-2 Infection Using Genome Expression Profiling Techniques. Viruses
8: 121. [Crossref]
46. Cai Y, Sheng Z, Chen Y, Wang J (2019) LncRNA HMMR-AS1
promotes proliferation and metastasis of lung adenocarcinoma by regulating
MiR-138/sirt6 axis. Aging (Albany NY) 11: 3041-3054. [Crossref]
47. Chu Z P, Dai J, Jia LG, Li J, Zhang Y et al. (2018)
Increased expression of long noncoding RNA HMMR-AS1 in epithelial ovarian
cancer: an independent prognostic factor. Eur Rev Med Pharmacol Sci 22:
8145-8150. [Crossref]
48. Li J, Ji X, Wang H (2018) Targeting Long Noncoding RNA
HMMR-AS1 Suppresses and Radiosensitizes Glioblastoma. Neoplasia 20:
456-466. [Crossref]
49. Liu W, Ma J, Cheng Y, Zhang H, Luo W et al. (2016)
HMMR antisense RNA 1, a novel long noncoding RNA, regulates the progression of
basal-like breast cancer cells. Breast Cancer (Dove Med Press) 8:
223-229. [Crossref]