Good Agreement Between Hba1c Analyzed Using Capillary Electrophoresis, HPLC, Immunological and Enzymatic Methods
Good Agreement Between Hba1c Analyzed Using Capillary Electrophoresis, HPLC, Immunological and Enzymatic Methods
A B S T R A C T
Purpose: Hemoglobin A1c (HbA1c) is an essential marker for assessment of glycemic control in diabetes patients. The aim of this study was to evaluate the agreement between different HbA1c methods.
Methodology: We used blood samples to compare HbA1c results analyzed with Capillarys 3 Tera, Roche Tina-Quant HbA1c Gen 3, BioRad Variant II Turbo (3 sites), Mono S® and Abbott Architect enzymatic method. The comparisons were made as paired instrument comparisons with Capillarys 3 Tera.
Results: The linear correlations between the HbA1c methods were as follows:
Cobas 6000 = 0.982 x Capillarys 3 Tera + 0.975, R² = 0.994;
Architect c8000 = 0.982 x Capillarys 3 Tera + 1.064, R² = 0.994;
Mono S® = 0.916 x Capillarys 3 Tera + 3.397, R² = 0.965;
BioRad Variant II Turbo = 0.923 x Capillarys 3 Tera + 4.062, R² = 0.990;
Tosoh G8 = 0.963 x Capillarys 3 Tera + 3.895, R² = 0.996.
Conclusions: The different instrument platforms showed the best agreement in the 50-70 mmol/mol interval. Above and below this range the methods separated into 2 groups, one consisting of Capillarys 3 Tera, Roche Tina-Quant and Abbott enzymatic method and the other group consisting of BioRad Variant II Turbo, Tosoh G8 and Mono S®.
Keywords
Analytical performance, capillary electrophoresis, enzymatic assay, HPLC, immunoassay
Introduction
Hemoglobin A1c (HbA1c) is an important blood test for the diagnosis and monitoring of diabetes mellitus patients, providing information about the average blood glucose levels over the past 2 to 3 months. Together with glucose it is used for glycemic control assessment of both type 1 and type 2 diabetes patients [1, 2]. There are a number of different methods for HbA1c testing that cover the range from point of care environments to large centralized laboratories. The diabetes patient may thus have their HbA1c measured with different methods over a time period. To be able to correctly evaluate changes in HbA1c levels it is important that these different methods provide similar test results. The accuracy goal for HbA1c results in Equalis external quality assessment (EQA) scheme is that results should deviate less than 1.5 mmol/mol + 1.65 * 0.025 * the assigned HbA1c value. This corresponds to an allowed deviation of 3 mmol/mol at the level of 37 mmol/mol, and of 5 mmol/mol at the level of 85 mmol/mol. To be able to reach this accuracy it is important that the different methods in use provide test results without bias and with a high precision. HbA1c is used to monitor the diabetes care in Sweden and is an important part of the Swedish national diabetes register (SNDR) [3, 4]. SNDR strives to improve the quality of care of Swedish diabetes patients by providing tools for monitoring the performance of the care and HbA1c is one of the most important biomarkers used for this monitoring [2, 5]. The registry collect very large number of patient results which means that even small differences in trueness will reach significance.
There are a number of different available methods for HbA1c determinations such as ion-exchange high-performance liquid chromatography (e.g. Mono S®), boronate affinity HPLC, capillary zone electrophoresis (CZE), enzymatic assays and immunoassays [6, 7]. Much effort has been put into the standardization of HbA1c and it is generally recognized that all HbA1c results shall be traceable to the International Federation of Clinical Chemistry (IFCC) reference method even if the results may be reported as different units [8]. In Sweden, all HbA1c results are reported using the unit mmol/mol and the different methods should theoretically give the same test results. It is difficult to have good agreement over broad measuring ranges, so most likely the companies will give priority to the HbA1c range that is the most important for the care of diabetes patients (e.g. 50-70 mmol/mol). The aim of the present study was to compare HbA1c results provided by the new Capillarys 3 Tera, Cobas 6000 (immunological method), Architect 8000 (enzymatic method), Mono S®, BioRad Variant II Turbo, and Tosoh G8 (three ion exchange chromatography methods) using fresh patient samples and external quality assurance pooled whole blood samples.
Materials & Methods
I Samples
Blood samples were collected in K2-EDTA tubes according to the local routines at seven Swedish sites; Gothenburg, Falun, Gävle, Huddinge, Malmö, Uddevalla and Uppsala. Routine requested HbA1c samples were used for this evaluation. After the initial routine analysis at each laboratory the samples were sent to Uppsala the same or following day where the samples were reanalyzed on Capillarys 3 Tera. The study was approved by the local ethical board at Uppsala University (01-167). Sample stability for Capillarys 3 Tera was 7 days at +4°C and the calibration of the system was verified by analyzing samples that had previously had been measured with the IFCC reference method (INSTAND, Germany) [9].
The Mono S® method is one of the designated comparison methods for HbA1c in relation to the IFCC reference measurement system [10]. and has served for many years as national standardization for HbA1c in Sweden. A fixed equation is used to convert result from Mono S® scale to IFCC scale: HbA1c (mmol/mol) = 10.45 x HbA1c (Mono S®, %) – 10.62. The stability of the method is carefully studied in the IFCC monitoring program. The Mono S® procedure is currently used to assign target values for Equalis external quality assurance program for HbA1c. The five evaluation sites in this study participated in six ordinary EQA surveys during the period January - June 2016.
Ovarian Imaging: Imaging tests for the OVA1 and OVA500 studies included computed tomography (CT), ultrasound, or magnetic resonance imaging (MRI). Physicians were allowed to choose the type and number of studies performed. Images were prospectively obtained before enrollment to identify and characterize the ovarian mass. Only nine patients received MRI-only, and they were omitted from analysis because of low numbers. The imaging variables previously identified from the OVA1 and OVA500 trials to be significantly predictive of ovarian malignancy (p< .001 for each) were solid or papillary components (odds ratio [OR] = 4.2; 95% confidence interval [CI] = 3.0-5.8), ascites (OR = 8.0; 95% CI = 5.3-12.1), and metastatic implants (OR = 28.3; 95% CI = 9.9-80.8). Similar to analyses done with previous publications, patients with ascites or metastatic implants were omitted from the high-risk category because the MIA2G test is not recommended for use when the clinical presentation is suggestive of advanced stage malignancy [12]. Patients with clinical findings of advanced ovarian cancer should are referred to a specialist without MIA2G testing. Ovarian tumors were deemed low-risk by imaging if they were unilocular or septate without high-risk features. If participants received multiple imaging modalities, they were considered independent events and analyzed separately.
II Instruments
Capillary electrophoretic determination of HbA1c was performed using Capillarys 3 Tera and the CAPI 3 HbA1c kit (#2515) from Sebia (Lisses, France). The instrument is equipped with twelve fused-silica capillaries (total/effective length 17.5/15.5 cm; inner diameter 25 um) allowing a throughput of approximately 70 HbA1c samples per hour. HbA1c was analyzed immunologically in Uppsala using Cobas 6000 and Tina-quant Hemoglobin A1c Gen. 3 reagents (Roche Diagnostics, Mannheim, Germany). HbA1c was analyzed enzymatically on an Architect c8000 in Uddevalla, with a Mono S® system in Gothenburg, with Bio-Rad, Variant II Turbo in Gävle, Huddinge and Malmö and with Tosoh G8 (Tosoh, Tokyo, Japan) in Falun. The Architect and BioRad procedures were calibrated according to the manufactures instructions. The Tosoh instrument was used with calibrator values traceable to the Mono S procedure. The total coefficient of variation (CV)/day-to-day analytical performance for the Cobas method was 1.9% at 36 and 1.5% at 73 mmol/mol. The corresponding CVs/day-to-day analytical performance were 1.5% at 37 mmol/mol and 0.8% at 76 mmol/mol for Architect c8000, 1.6% at 40 mmol/mol and 0.8% at 99 mmol/L for Mono S®, 1.9% at 37 mmol/mol and 1.4% at 84 mmol/mol (Huddinge), 0.9% at 44 mmol/mol and 0.4% at 100 mmol/mol (Gävle), 1.6% at 36 mmol/mol and 1.7% at 82 mmol/mol (Malmö) for BioRad Variant II Turbo, 2.1% at 31.7 mmol/mol and 1.3% at 62.8 mmol/mol for Capillarys 3 Tera, and 1.2% at 43 mmol/mol and 0.5% at 84 mmol/mol for Tosoh G8.
Table 1: Comparison methods, participating sites, number of samples and date of measurement of the samples with the comparison method.
|
Site |
Method (Instrument) |
Measurement principle |
CV at 35-45 and 75-100 mmol/mol respectively |
Number of samples (range, mmol/mol) in the study |
Date of analysis |
|
Gävle |
BioRad Variant Turbo II |
HPLC |
0.9 % and 0.4 % |
75 (27 – 133) |
2016-03-03 |
|
Huddinge |
BioRad Variant Turbo II |
HPLC |
1.9 % and 1.4 % |
72 (31 – 123) |
2016-04-20 |
|
Malmö |
BioRad Variant Turbo II |
HPLC |
1.6 % and 1.7 % |
61 (15 - 126) |
2016-03-06 |
|
Uddevalla |
Abbott HbA1c Architect c8000 |
Enzymatic |
1.5 % and 0.8 % |
60 (28 - 105) |
2016-05-11 |
|
Gothenburg |
In house Mono S® |
HPLC |
1.6 % and 0.8 % |
60 (25 - 83) |
2016-04-21 |
|
Uppsala |
Roche Tina-quant Hemoglobin A1c Gen. 3 Cobas 6000 |
Immunoassay |
1.9 % and 1.5 % |
142 (27 - 100) |
2016-03-02 |
Table 2: Agreement between five different routine methods (Y) and Capillarys 3 Tera (X).
|
Site |
Method (Instrument) |
Fraction of results with deviation less than 3 mmol/mol |
R^2 |
Y = a * X + b |
|
Gävle |
BioRad Variant Turbo II |
89 % |
0.998 |
a = 0.953 b = 3.464 |
|
Huddinge |
BioRad Variant Turbo II |
93 % |
0.990 |
a = 0.923 b = 4.062 |
|
Malmö |
BioRad Variant Turbo II |
80 % |
0.992 |
a = 0.928 b = 5.076 |
|
Uddevalla |
Abbott HbA1c Architect c8000 |
100 % |
0.994 |
a = 0.982 b = 1.064 |
|
Gothenburg |
In house Mono S® |
80 % |
0.965 |
a = 0.916 b = 3.397 |
|
Uppsala |
Roche Tina-quant Hemoglobin A1c Gen. 3 Cobas 6000 |
97 % |
0.994 |
a = 0.982 b = 0.975 |
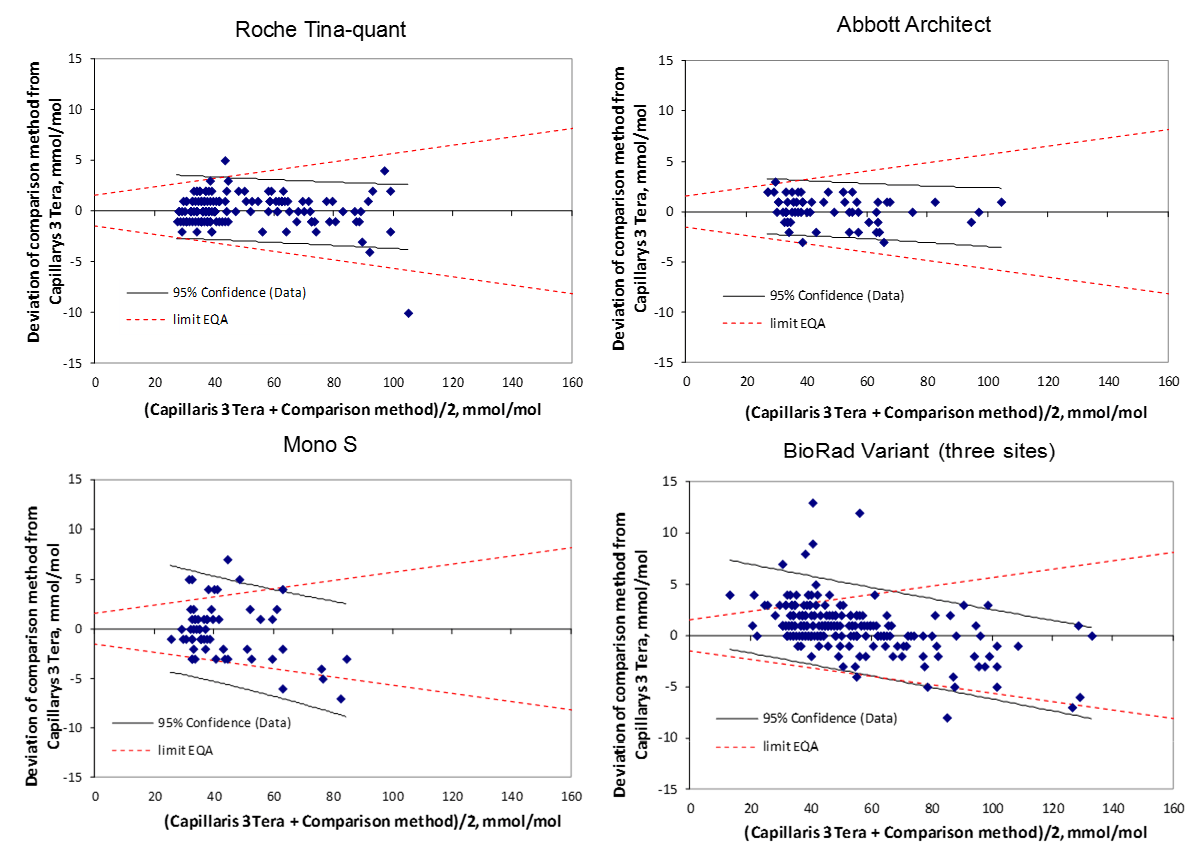
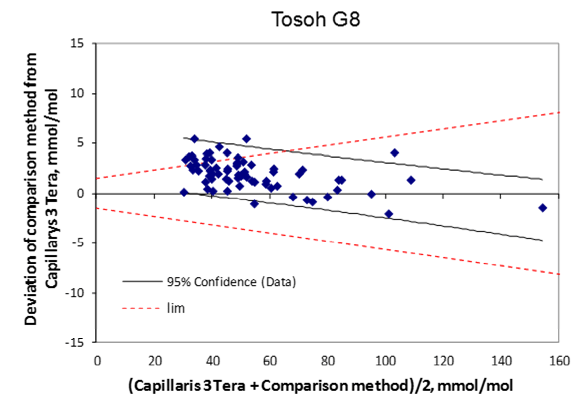
Figure 1A-E: Bland-Altman plots showing the deviation between the compared method and Capillarys 3 Tera (y-axis) and the mean values of the two methods (x-axis). The 95% confidence limits for data are illustrated in the figures. For comparison, the quality goals for Swedish EQA results are indicated by hashed lines.
III Statistical calculations
Statistical analysis was performed utilizing Statistica 4.5 (StatSoft Inc, Tulsa, OK, USA). Linear correlations were calculated by Excel 2000 (Microsoft Corp).
Results
I Cobas 6000
142 patient samples were analyzed on both Cobas 6000 and Capillarys 3 Tera and the comparison showed an agreement between Cobas 6000 and Capillarys 3 Tera (R² = 0.994). Cobas 6000 (y) = 0.982 x Capillarys 3 Tera (x) + 0.975 (Table 1 and Table 2). A deviation plot is shown in (Figure 1a)
II Architect c8000
60 patient samples were analyzed on both Architect c8000 and Capillarys 3 Tera. The equation for the correlation was y = 0.982 x Capillarys 3 Tera + 1.064, R² = 0.994. A deviation plot is shown in (Figure 1b).
III Mono S®
60 patient samples were analyzed on both Mono S® and Capillarys 3 Tera. The equation for the correlation was y = 0.916 x Capillarys 3 Tera + 3.397, R² = 0.965, A deviation plot is shown in (Figure 1c).
IV Bio-Rad, Variant II Turbo
The comparisons were made with 3 Bio-Rad Variant II Turbo instruments in Gävle, Huddinge and Malmö. The comparison with Gävle was with 75 patient samples and the correlation equation obtained was y = 0.953 x Capillarys 3 Tera + 3.464, R² = 0.988. The corresponding equations for Huddinge with 72 samples was y = 0.923 x Capillarys 3 Tera + 4.062, R² = 0.990 and for Malmö with 61 samples y = 0.928 x Capillarys 3 Tera + 5.076, R² = 0.992 (n=61). A deviation plot is shown in (Figure 1d).
V Tosoh G8
71 patient samples were analyzed on both Tosoh and Capillarys 3 Tera. y = 0.963 x Capillarys 3 Tera + 3.895, R² = 0.996, A deviation plot is shown in (Figure 1e).
VI Comparison between different methods
The positive intercepts for the Mono S®, Bio-Rad Variant II Turbo, and Tosoh G8 instrument in comparison with the Capillarys 3 Tera will give slightly higher values in the low range (e.g. below 40 mmol/mol) while the lower slope for the same instruments will give slightly lower values at the high end (Figure 1a-e).
VII Results from the Swedish external quality assurance program
The six EQA samples distributed by Equalis during the first half of 2016 had a mean value of 47.2 mmol/mol (range 39.6 – 55.8 mmol/mol). Equalis uses the Mono S® method to assign target values for the EQA samples. In relation to the target values the Bio-Rad Variant II Turbo instruments gave slightly higher mean values (Figure 2), but the differences were less than 2 mmol/mol for all studied methods. There was a correlation (R2=0.38) between the deviation of the participating laboratories from the Mono S® assigned values in the Equalis surveys and the deviation from the Capillarys 3 Tera results with fresh patient samples (Figure 3).
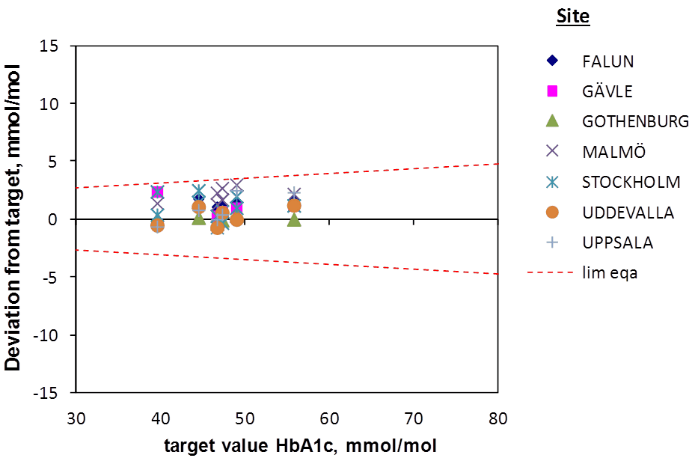
Figure 2: Results in EQA surveys for the seven study sites. All results were within the quality goal illustrated by the hashed line.
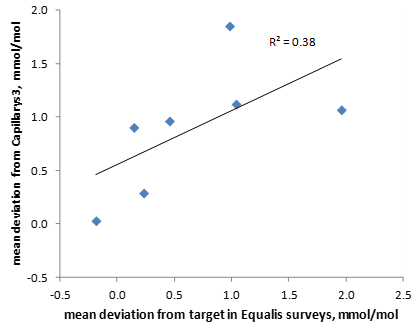
Figure 3: Comparison between the mean deviation from target (Mono S®) in the Equalis surveys for HbA1c and the mean deviation from Capillarys 3 Tera with fresh patient samples for the laboratories participating in the study. The six different EQA samples were run on one, two or three instruments at each site. The mean deviations from Capillarys 3 Tera were based on all samples shown in figure 1 for each site.
VIII Results from comparison of Capillarys 3 Tera and the IFCC reference measurement procedure
The Capillarys 3 Tera device did not participate in the regular EQA surveys. Therefore, five external quality assurance samples used by Equalis for EQA were analyzed in duplicate on the Capillarys 3 Tera. The samples had been stored at -70°C after the use in regular EQA schemes and had also been measured with IFCC reference method (INSTAND, Germany) in addition to the Mono S® assigned values [9]. The quality goal for EQA was fulfilled for duplicate measurements for all 5 samples in relation to the IFCC reference method (Figure 4) and to the Mono S® procedure (data not shown).
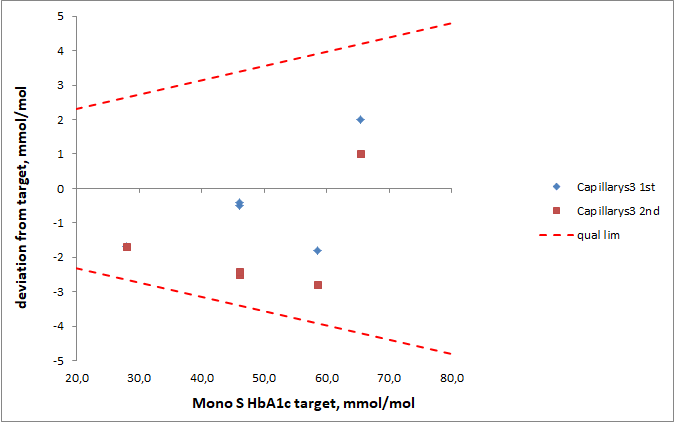
Figure 4: Results obtained from analysis of 5 external quality assurance (EQA) samples in duplicates with Capillarys 3 Tera. The results are presented as deviation between results from the Capillarys 3 Tera and the IFCC reference methods compared with the reference method values for the 5 samples. The accuracy goal is denoted by dashed lines.
Discussion
In the present study we compared HbA1c results from Roche Tina-Quant HbA1c Gen 3, BioRad Variant II Turbo (3 instruments), Tosoh G8, Mono S® and Architect c8000 with results with Capillarys 3 Tera. The comparisons were made as paired instrument comparisons with Capillarys 3 Tera. HbA1c is measured in whole blood. Even if HbA1c has a much better stability than blood cell counts at room temperature or at 4C, the sample stability has to be taken into account when performing method comparisons. This method comparison evaluated eight different instruments at different sites. A consecutive testing strategy would take minimum seven days if we estimate one day per site including shipping and testing. HbA1c is usually not measured by routine laboratories during Saturdays and Sundays in Sweden which means additional days between first and last measurement. Freezing or transferring samples to multiple secondary tubes may also cause handling errors. We believe that it is important to do this type of comparison with fresh patient samples rather than with controls or healthy blood donors. To be able to use fresh patient samples we chose to do paired comparisons. We chose to do the comparison with the reference method on only one instrument for logistic reasons. The methods used in this study were all CE labelled which includes requirements of interference studies. The present study did not include such studies which is a limitation of the study. Another limitation of the paired comparisons is that it is not the same samples that are run on all instruments. The difference in patient selection and number of samples could affect the results of the study and small differences in slope or intercept should be due to these differences. Several different assay principles were compared in the present study. The measurement principle of the Architect method is based on the enzymatic quantification of fructosyl dipeptides by a fructosyl peptide oxidase after digestion of the β chains of HbA1c with a proteinase [11]. The reaction produces hydrogen peroxide which reacts with a substrate. The reaction is measured at 660 nm.
The CAPILLARYS3 Tera HbA1c assay is based on the principle of capillary electrophoresis in free solution.12 Hemoglobin fractions are separated in silica capillaries by their electrophoretic mobility and electroosmotic flow at a high voltage in an alkaline buffer. Hemoglobin fractions are directly detected at 415 nm. The Roche assay is based on immunoturbidimetric determination of HbA1c. Monoclonal antibodies attached to latex particles bind to the β-N-terminal HbA1c fragments. A synthetic polymer with multiple β-N-terminal standard HbA1c copies is used to agglutinate remaining free antibody. The turbidity change measured at 552 nm is inversely related to the concentration of bound HbA1c. The BioRad method is based on chromatographic separation of HbA1c on a cation exchange cartridge. The various forms of hemoglobin exhibit charge differences at the acidic pH of the mobile phase, and thus can be separated on a support that is negatively charged. The separation is achieved by increasing the concentration of buffer B containing sodium perchlorate. Hemoglobin fractions are detected at 415 nm. The Tosoh G8 method is based on chromatographic separation of hemoglobin forms, including HbA1c, on a cation exchange column. The separation is achieved by increasing the concentration of buffer B. The hemoglobin fractions are eluted from the column and the eluted fractions are detected at 415 nm. The Mono S method is also based on cation exchange chromatography combined with detection of eluted fractions at 415 nm. The separation is achieved by increasing the concentration of buffer B. Both Capillarys 3 Tera and Bio-Rad, most recently in the form of the D-100 instrument, has been shown to perform very well for the determination of HbA1c [12].
The best agreements with Capillarys 3 Tera were found for Cobas 6000 and Architect c8000 with intercepts of approximately 1 mmol/mol and slopes of 0.98. We were positively surprised over the very good compatibility between these assays as they represent three completely different assay technologies. Cobas 6000, Architect c8000, Bio-Rad Variant II Turbo, and Tosoh G8 had all strong correlations with Capillarys 3 Tera of (R² 0.988-0.996). This is in agreement with the high accuracy and good reproducibility shown for these instruments in the first CAP survey of 2016 for Cobas 6000, Architect c8000, Tosoh G8 and Bio-Rad, Variant II Turbo(http://www.ngsp.org/CAP/CAP16a.pdf). The Capillary 3 Tera is so new on the market that it was not part of the CAP survey, but its predecessor the Capillarys 2 also had a low CV. Immunological methods have sometimes been reported to be analytically inferior for the measurement of HbA1c, but not in this study. The three Bio-Rad Variant II Turbo instruments had in comparison with Capillarys 3 Tera positive intercepts of 3.5-5 mmol/mol which was partly compensated by a slope of 0.923-0.953 [13, 14]. The Mono S® and Tosoh G8 systems showed similar intercepts and slopes as the Bio-Rad instruments. All studied instruments thus showed a good agreement in the 50-70 mmol/mol range. It seems likely that the manufacturers have focused their efforts to obtain agreement with the international calibrators in this clinically important range rather than at the high or low ends of the HbA1c range. It is important to be aware of these differences in research projects studying non-diabetic individuals with HbA1c within the lower end of the reference interval or diabetes patients with very high HbA1c values. The present study shows that there is a difference between the two instrument groups at the high and low end of the HbA1c range, but it cannot be used to define which of the two instrument groups that are the more correct in these regions.
The Mono S® method was for many years the basis for the national standardization of HbA1c in Sweden. Today, the majority of the Swedish laboratories have replaced Mono S® with other routine methods for HbA1c measurement, but the Mono S® procedure is still used, e.g. for assigning target values for EQA program for HbA1c. By use of the known relation to the IFCC scale, the results are made traceable to the IFCC reference measurement procedure. In the present study the agreement between the results from the routine methods and target values for EQA samples was good, as was the agreement between the routine methods and the Capillarys 3 Tera results for fresh patient samples. We also compared the deviation of the participating laboratories from the Mono S® assigned values in the Equalis surveys with the deviation from the Capillarys 3 Tera results with fresh patient samples. The correlation between these two deviations is a strong indicator that the external quality assurance materials, consisting of pooled left over whole blood patient samples, detect the same kind of method deviations as seen with fresh patient samples.
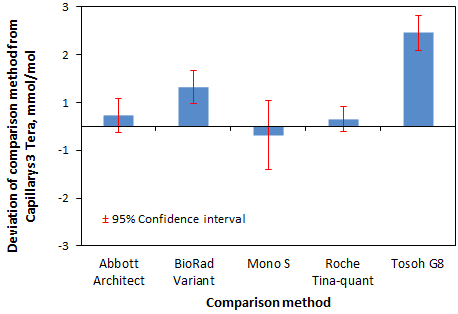
Figure 5: Mean HbA1c deviation in mmol/mol of comparison method from Capillarys 3 Tera with 95% confidence intervals.
The accuracy of the Capillarys 3 Tetra was verified through measurements of samples with target values produced by IFCC reference measurement procedure. The results thus confirm the usefulness of a common traceability for various routine methods to the IFCC reference measurement procedure. A positive bias was observed for results for the Tosoh G8 and the BioRad Variant Turbo results both in relation the Mono S® target in the EQA scheme with pooled whole blood samples and in relation to the Capillarys Tera 3 results for native patient samples (Figure 5). In conclusion, HbA1c is today used as a diagnostic test for diabetes with a cut-off value of 48 mmol/mol according to WHO recommendation [15]. The use of international guidelines emphasizes the importance of co-calibration of HbA1c methods used clinically. The present study showed a good agreement between all studied instruments in the clinically important 50-70 mmol/L range and supports the use of the international cut-off value for the methods studied. The data also supports the use of external quality assurance material to detect method differences for HbA1c.
Acknowledgement
The HbA1c reagents for the Capillarys 3 Tera evaluation were generously provided by ACC Nordic.
Funding
The authors received no financial support for the research, authorship or publication of this article.
Conflicts of Interest
No conflict of interest was declared.
Article Info
Article Type
Research ArticlePublication history
Received: Thu 15, Aug 2019Accepted: Fri 06, Sep 2019
Published: Thu 12, Sep 2019
Copyright
© 2023 Anders Larsson. This is an open-access article distributed under the terms of the Creative Commons Attribution License, which permits unrestricted use, distribution, and reproduction in any medium, provided the original author and source are credited. Hosting by Science Repository.DOI: 10.31487/j.JDMC.2019.01.03
Figures & Tables
Table 1: Comparison methods, participating sites, number of samples and date of measurement of the samples with the comparison method.
|
Site |
Method (Instrument) |
Measurement principle |
CV at 35-45 and 75-100 mmol/mol respectively |
Number of samples (range, mmol/mol) in the study |
Date of analysis |
|
Gävle |
BioRad Variant Turbo II |
HPLC |
0.9 % and 0.4 % |
75 (27 – 133) |
2016-03-03 |
|
Huddinge |
BioRad Variant Turbo II |
HPLC |
1.9 % and 1.4 % |
72 (31 – 123) |
2016-04-20 |
|
Malmö |
BioRad Variant Turbo II |
HPLC |
1.6 % and 1.7 % |
61 (15 - 126) |
2016-03-06 |
|
Uddevalla |
Abbott HbA1c Architect c8000 |
Enzymatic |
1.5 % and 0.8 % |
60 (28 - 105) |
2016-05-11 |
|
Gothenburg |
In house Mono S® |
HPLC |
1.6 % and 0.8 % |
60 (25 - 83) |
2016-04-21 |
|
Uppsala |
Roche Tina-quant Hemoglobin A1c Gen. 3 Cobas 6000 |
Immunoassay |
1.9 % and 1.5 % |
142 (27 - 100) |
2016-03-02 |
Table 2: Agreement between five different routine methods (Y) and Capillarys 3 Tera (X).
|
Site |
Method (Instrument) |
Fraction of results with deviation less than 3 mmol/mol |
R^2 |
Y = a * X + b |
|
Gävle |
BioRad Variant Turbo II |
89 % |
0.998 |
a = 0.953 b = 3.464 |
|
Huddinge |
BioRad Variant Turbo II |
93 % |
0.990 |
a = 0.923 b = 4.062 |
|
Malmö |
BioRad Variant Turbo II |
80 % |
0.992 |
a = 0.928 b = 5.076 |
|
Uddevalla |
Abbott HbA1c Architect c8000 |
100 % |
0.994 |
a = 0.982 b = 1.064 |
|
Gothenburg |
In house Mono S® |
80 % |
0.965 |
a = 0.916 b = 3.397 |
|
Uppsala |
Roche Tina-quant Hemoglobin A1c Gen. 3 Cobas 6000 |
97 % |
0.994 |
a = 0.982 b = 0.975 |
References
- Eeg-Olofsson K, Cederholm J, Nilsson PM, Zethelius B, Svensson AM et al. (2010) New aspects of HbA1c as a risk factor for cardiovascular diseases in type 2 diabetes: an observational study from the Swedish National Diabetes Register (NDR). J Int Med 268: 471-482. [Crossref]
- Lind M, Svensson AM, Kosiborod M (2014) Glycemic control and excess mortality in type 1 diabetes. N Engl J Med 371: 1972-1982.
- Gudbjornsdottir S, Cederholm J, Nilsson PM, Eliasson B (2003) The National Diabetes Register in Sweden: an implementation of the St. Vincent Declaration for Quality Improvement in Diabetes Care. Diab Care 26: 1270-1276. [Crossref]
- Hallgren Elfgren IM, Grodzinsky E, Tornvall E (2016) The Swedish National Diabetes Register in clinical practice and evaluation in primary health care. Prim Health Care Res Dev 17: 549-558. [Crossref]
- Cederholm J, Zethelius B, Nilsson PM, Eeg-Olofsson K, Eliasson B et al. (2009) Effect of tight control of HbA1c and blood pressure on cardiovascular diseases in type 2 diabetes: an observational study from the Swedish National Diabetes Register (NDR). Diab Res Clin Pract 86: 74-81. [Crossref]
- Weykamp C, John WG, Mosca A (2009) A review of the challenge in measuring hemoglobin A1c. J Diabetes Sci Technol 3: 439-445. [Crossref]
- Weykamp C (2013) HbA1c: a review of analytical and clinical aspects. Ann Lab Med 33: 393-400. [Crossref]
- Braga F, Panteghini M (2013) Standardization and analytical goals for glycated hemoglobin measurement. Clin Chem Lab Med 51: 1719-1726. [Crossref]
- Kaiser P, Akerboom T, Molnar P, Reinauer H (2008) Modified HPLC-electrospray ionization/mass spectrometry method for HbA1c based on IFCC reference measurement procedure. Clin Chem 54: 1018-1022. [Crossref]
- Hoelzel W, Weykamp C, Jeppsson JO, Miedema K, Barr JR et al. (2004) IFCC Reference System for Measurement of Hemoglobin A1c in Human Blood and the National Standardization Schemes in the United States, Japan, and Sweden: A Method-Comparison Study. Clin Chem 50: 166-174. [Crossref]
- Jaisson S, Desmons A, Renard B, Chevelle B, Leroy N et al. (2014) Analytical performances of a new enzymatic assay for hemoglobin A1c. Clin Chim Acta 434: 48-52. [Crossref]
- Herpol M, Lanckmans K, Van Neyghem S, Clement P, Crevits S et al. (2016) Evaluation of the Sebia Capillarys 3 Tera and the Bio-Rad D-100 Systems for the Measurement of Hemoglobin A1c. Am J Clin Pathol 146: 67-77. [Crossref]
- Guérin R, Dugré-Brisson S (2016) Evaluation of the long-term imprecision of the Capillarys 2 Flex Piercing® with serial differences in patient Hemoblogin A1c data: A comparison with two common immunoassays. Clin Biochem 49: 502-504. [Crossref]
- Woodworth A, Korpi-Steiner N, Miller JJ, Rao LV, Yundt-Pacheco J et al. (2014) Utilization of assay performance characteristics to estimate hemoglobin A1c result reliability. Clin Chem 60: 1073-1079. [Crossref]
- John WG (2012) Use of HbA1c in the diagnosis of diabetes mellitus in the UK. The implementation of World Health Organization guidance 2011. Diabet Med 29: 1350-1357. [Crossref]