Global Gene Expression Profiling of Body-Mass Index in Middle-Aged Danish Twins
A B S T R A C T
Objective: The body mass index (BMI) measured as weight in relation to height is an important monitor for obesity and diabetes, with individual variation under control by genetic and environmental factors. In transcriptome-wide association studies on BMI, the genetic contribution calls for controlling of genetic confounding that affects both BMI and gene expression. We performed a global gene expression profiling of BMI on peripheral blood cells using monozygotic twins for efficient handling of genetic make-ups.
Methods: We applied a generalized association method to genome-wide gene expression data on 229 pairs of monozygotic twins (age 56-80 years) for detecting diverse patterns of correlation between BMI and gene expression.
Results: We detected seven probes associated with BMI with p<1e-04, among them two probes with p<1e-05 (p=2.83e-06 AAK1; p=7.83e-06 LILRA3). In total, the analysis found 1579 probes with nominal p<0.05. Biological pathway analysis of enriched pathways found 50 KEGG and 45 Reactome pathways (FDR<0.05). The identified top functional pathways included immune function, JAK-STAT signalling, insulin signalling and regulation of energy metabolism.
Conclusion: This transcriptome-wide association study using monozygotic twins and generalized correlation identified differentially expressed genes and a broad spectrum of enriched biological pathways that may implicate metabolic health.
Keywords
BMI, gene expression, twins, generalized correlation
Introduction
The body mass index (BMI) quantifies the amount of tissue mass including muscle, fat and bone in an individual. It is highly associated with cardiovascular disease and diabetes and has profound influences on life quality and mortality [1-3]. In clinical application, BMI is a simple and widely used metric for defining overweight (25≤BMI<30, kg/m²) and obesity (BMI≥30 kg/m²), which are conditions tightly linked to the metabolic syndrome (MetS). Many epidemiological and molecular studies have been conducted to find the genetic and non-genetic (environmental) mechanisms underlying individual BMI variation in order to identify potential causes of MetS and eventually to find strategies for mitigating its burden to public health. Multiple genetic variants have been reported to affect BMI in genome-wide association studies, albeit with the proportion of BMI variation accounted for remaining far from the overall genetic contribution estimated in twin studies, although recent effort based on whole genome sequencing has largely increased the contribution by genomic sequence variations [4, 5]. Instead of focusing on the genetic polymorphisms which are static across life span, analysis of gene expression profiles can directly depict the dynamic activity of functional genes in regulating the variation of BMI, especially when controlling for genetics.
In transcriptome-wide association studies (TWAS), genetic variations can confound the relation between MetS related health conditions and gene expression (through functioning as cis- or trans-eQTLs). This is particularly crucial for BMI giving the high genetic contribution [4]. Compared to the ordinary case-control design using unrelated individuals, the use of twins has been proven a valuable approach in controlling genetic background, due to the shared genetic makeups in twins leveraging enriched statistical power [6, 7]. Moreover, current TWAS assumes linear relationship between gene expression and traits of interest, thus ignoring the diverse patterns of association in biology. By focusing on twins, we have investigated gene expression profiles in peripheral blood cells in association with BMI by introducing a generalized correlation method to capture different patterns (both linear and nonlinear) of association between gene expression and BMI while controlling for genetic confounding.
Methods
I Samples
This study is based on a twin cohort, the Middle Aged Danish Twins (MADT), from the Danish Twin Register [8]. There are in total 229 complete monozygotic twin pairs included in the analysis, 254 male and 204 female twins, with age at sampling ranging from 56 to 80 and BMI from 15.77 to 38.15. Anthropometric measures and whole blood samples were taken over the period from 2008 to 2011. Blood cell counts of 449 individuals were available and the blood cell counts of the other 9 individuals were imputed by the estimate CellCounts function in the R package minfi using DNA methylation data collected on the same blood samples [9, 10].
II Global Gene Expression Analysis
Whole blood samples were collected in PAXgene Blood RNA Tubes (PreAnalytiX GmbH, Hombrechtikon, Switzerland) and total RNA extracted using the PAXgene Blood miRNA kit (QIAGEN) according to the manufacturer’s protocol. Concentration of the extracted RNA was determined using a NanoDrop spectrophotometer ND-8000 (NanoDrop Technologies), and the quality was assessed by the Agilent 2100 Bioanalyzer (Agilent Technologies).
Gene-expression analysis was performed using the Agilent SurePrint G3 Human GE 8×60K Microarray (Agilent Technologies), a dual-colour high-definition array containing 60K high quality probes of 60-mer. Sample labeling and array hybridization were carried out according to the ‘Two-Colour Microarray-Based Gene Expression Analysis – Low Input Quick Amp Labeling’-protocol (Agilent Technologies). Samples were labeled with Cy5 and the reference consisting of a pool of 16 samples was labeled with Cy3. Hybridization, washing, scanning, and quantification were performed according to the array manufacturer's recommendations.
III Data Pre-Processing
The raw intensity data was background-corrected using the NormExp method and was then within-array normalized by Loess normalization method and between-array normalized by quantile normalization [11]. The normalized values were used to calculate log2-transformed Cy5/Cy3 ratios. Missing expression values were imputed by k-nearest neighbors averaging, and replicate probes were collapsed calculating the median. Data pre-processing was performed using the R packages limma [12]. All the probes on the Agilent SurePrint G3 array were re-annotated using GENCODE v.25 gene annotation database (Link).
IV Statistical Analysis
After normalization, we adjusted for covariates including age, sex, cell composition and first two PCs from the PCA (principal component analysis) on the gene expression data. We then applied a generalized measure of association, the generalized correlation coefficient (GCC), to investigate the association between intra-pair difference of BMI and intra-pair difference of expression to control the genetic and shared environmental effects, as proposed by Tan et al. [13]. GCC was computed using a ratio of maximum likelihoods for the marginal distribution and maximum weighted likelihoods for the joint distribution using the R package matie [14]. The mRNA probes with p<0.05 were used for gene set enrichment analysis (GSEA) to detect biological pathways over-represented by the listed probes for functional interpretation [15].
Results
A total of 50599 probes were available on the microarray. We first removed house-keeping probes by calculating the coefficient of variation (CV) as standard deviation divided by mean of expression measurement for each probe. Probes with CV<0.1 were filtered out leaving 37716 probes for subsequent analysis. We identified 2 probes with p<1e-05 (A_33_P3289204 of AAK1 gene, p=2.83e-06; A_23_P79094 of LILRA3 gene, p=7.83e-06), 5 probes with p<1e-04 (A_33_P3234809 of PAX8 gene, p=4.37e-05; A_32_P133767 of C12orf42 gene, p=5.52e-05; A_33_P3364060 of HR gene, p=6.11e-05; A_33_P3213179 of PPP1R3A gene, p=8e-05; A_23_P108280 of CYP4F12 gene, p=9.87e-05) and 1579 probes with p<0.05 (Supplementary Table 1). Table 1 shows the top 20 probes ranked by p values (p<6.24e-04). The Q-Q plot for probes with p<0.05 is shown in (Figure 1). The figure does not display inflated statistical significance although the sample contains highly correlated monozygotic twin pairs. The Manhattan plot for probes with p<0.05 are shown in (Figure 2).
Table 1: Top 20 probes from mRNA analysis. A is the association score or GCC from matie package.
|
Probe ID |
Gene Symbol |
p-value |
A |
|
A_33_P3289204 |
AAK1 |
2.83E-06 |
0.216 |
|
A_23_P79094 |
LILRA3 |
7.83E-06 |
0.207 |
|
A_33_P3234809 |
PAX8 |
4.37E-05 |
0.190 |
|
A_32_P133767 |
C12orf42 |
5.52E-05 |
0.187 |
|
A_33_P3364060 |
HR |
6.11E-05 |
0.186 |
|
A_33_P3213179 |
PPP1R3A |
8E-05 |
0.183 |
|
A_23_P108280 |
CYP4F12 |
9.87E-05 |
0.181 |
|
A_33_P3659808 |
PELP1 |
0.00014 |
0.177 |
|
A_23_P67702 |
ZNF85 |
0.00023 |
0.171 |
|
A_32_P9575 |
MRPL45 |
0.000236 |
0.171 |
|
A_23_P45851 |
HIAT1 |
0.000256 |
0.170 |
|
A_19_P00318014 |
SNHG11 |
0.000285 |
0.169 |
|
A_24_P395621 |
RUNDC1 |
0.000363 |
0.166 |
|
A_33_P3392250 |
FAM178A |
0.000373 |
0.166 |
|
A_33_P3295328 |
CLEC6A |
0.000381 |
0.165 |
|
A_23_P127948 |
ADM |
0.00039 |
0.165 |
|
A_23_P131899 |
SDCBP2 |
0.000417456 |
0.164 |
|
A_23_P329924 |
HCAR2 |
0.000474119 |
0.163 |
|
A_33_P3351189 |
LOC100129603 |
0.000492092 |
0.162 |
|
A_23_P105973 |
SERPINA11 |
0.000623576 |
0.159 |
Table 2: KEGG pathways identified by GSEA over-representation analysis.
|
Gene Set Name |
# Genes in Gene Set (K) |
# Genes in Overlap (k) |
k/K |
p-value |
FDR q-value |
|
KEGG_PATHWAYS_IN_CANCER |
328 |
33 |
0.101 |
8.64E-09 |
1.61E-06 |
|
KEGG_JAK_STAT_SIGNALING_PATHWAY |
155 |
17 |
0.110 |
1.08E-05 |
1.00E-03 |
|
KEGG_INSULIN_SIGNALING_PATHWAY |
137 |
15 |
0.110 |
3.56E-05 |
1.76E-03 |
|
KEGG_DILATED_CARDIOMYOPATHY |
92 |
12 |
0.130 |
3.78E-05 |
1.76E-03 |
|
KEGG_MAPK_SIGNALING_PATHWAY |
267 |
22 |
0.082 |
5.72E-05 |
2.13E-03 |
|
KEGG_AXON_GUIDANCE |
129 |
14 |
0.109 |
7.06E-05 |
2.19E-03 |
|
KEGG_HYPERTROPHIC_CARDIOMYOPATHY_HCM |
85 |
11 |
0.129 |
8.49E-05 |
2.25E-03 |
|
KEGG_LEUKOCYTE_TRANSENDOTHELIAL_MIGRATION |
118 |
13 |
0.110 |
1.09E-04 |
2.53E-03 |
|
KEGG_OLFACTORY_TRANSDUCTION |
389 |
27 |
0.069 |
1.66E-04 |
3.44E-03 |
|
KEGG_NEUROACTIVE_LIGAND_RECEPTOR_INTERACTION |
272 |
21 |
0.077 |
2.06E-04 |
3.84E-03 |
|
KEGG_CARDIAC_MUSCLE_CONTRACTION |
80 |
10 |
0.125 |
2.36E-04 |
3.99E-03 |
|
KEGG_WNT_SIGNALING_PATHWAY |
151 |
14 |
0.093 |
3.74E-04 |
5.14E-03 |
|
KEGG_TIGHT_JUNCTION |
134 |
13 |
0.097 |
3.86E-04 |
5.14E-03 |
|
KEGG_PANCREATIC_CANCER |
70 |
9 |
0.129 |
3.87E-04 |
5.14E-03 |
|
KEGG_NUCLEOTIDE_EXCISION_REPAIR |
44 |
7 |
0.159 |
4.61E-04 |
5.56E-03 |
|
KEGG_LEISHMANIA_INFECTION |
72 |
9 |
0.125 |
4.78E-04 |
5.56E-03 |
|
KEGG_VIRAL_MYOCARDITIS |
73 |
9 |
0.123 |
5.30E-04 |
5.80E-03 |
|
KEGG_T_CELL_RECEPTOR_SIGNALING_PATHWAY |
108 |
11 |
0.102 |
7.05E-04 |
6.84E-03 |
|
KEGG_ARRHYTHMOGENIC_RIGHT_VENTRICULAR_CARDIOMYOPATHY_ARVC |
76 |
9 |
0.118 |
7.15E-04 |
6.84E-03 |
|
KEGG_GLYCOLYSIS_GLUCONEOGENESIS |
62 |
8 |
0.129 |
7.88E-04 |
6.84E-03 |
|
KEGG_INTESTINAL_IMMUNE_NETWORK_FOR_IGA_PRODUCTION |
48 |
7 |
0.146 |
7.93E-04 |
6.84E-03 |
|
KEGG_FOCAL_ADHESION |
201 |
16 |
0.080 |
8.09E-04 |
6.84E-03 |
|
KEGG_CELL_ADHESION_MOLECULES_CAMS |
134 |
12 |
0.090 |
1.29E-03 |
1.04E-02 |
|
KEGG_P53_SIGNALING_PATHWAY |
69 |
8 |
0.116 |
1.60E-03 |
1.11E-02 |
|
KEGG_PYRUVATE_METABOLISM |
40 |
6 |
0.150 |
1.61E-03 |
1.11E-02 |
|
KEGG_MELANOGENESIS |
102 |
10 |
0.098 |
1.62E-03 |
1.11E-02 |
|
KEGG_UBIQUITIN_MEDIATED_PROTEOLYSIS |
138 |
12 |
0.087 |
1.66E-03 |
1.11E-02 |
|
KEGG_REGULATION_OF_ACTIN_CYTOSKELETON |
216 |
16 |
0.074 |
1.72E-03 |
1.11E-02 |
|
KEGG_TGF_BETA_SIGNALING_PATHWAY |
86 |
9 |
0.105 |
1.74E-03 |
1.11E-02 |
|
KEGG_BASAL_CELL_CARCINOMA |
55 |
7 |
0.127 |
1.80E-03 |
1.12E-02 |
|
KEGG_ASTHMA |
30 |
5 |
0.167 |
2.44E-03 |
1.45E-02 |
|
KEGG_LYSINE_DEGRADATION |
44 |
6 |
0.136 |
2.65E-03 |
1.45E-02 |
|
KEGG_HUNTINGTONS_DISEASE |
185 |
14 |
0.076 |
2.67E-03 |
1.45E-02 |
|
KEGG_ADHERENS_JUNCTION |
75 |
8 |
0.107 |
2.73E-03 |
1.45E-02 |
|
KEGG_B_CELL_RECEPTOR_SIGNALING_PATHWAY |
75 |
8 |
0.107 |
2.73E-03 |
1.45E-02 |
|
KEGG_ACUTE_MYELOID_LEUKEMIA |
60 |
7 |
0.117 |
2.99E-03 |
1.54E-02 |
|
KEGG_CITRATE_CYCLE_TCA_CYCLE |
32 |
5 |
0.1562 |
3.27E-03 |
1.65E-02 |
|
KEGG_COLORECTAL_CANCER |
62 |
7 |
0.1129 |
3.60E-03 |
1.76E-02 |
|
KEGG_BASE_EXCISION_REPAIR |
35 |
5 |
0.1429 |
4.87E-03 |
2.32E-02 |
|
KEGG_PURINE_METABOLISM |
159 |
12 |
0.0755 |
5.30E-03 |
2.47E-02 |
|
KEGG_SMALL_CELL_LUNG_CANCER |
84 |
8 |
0.0952 |
5.50E-03 |
2.49E-02 |
|
KEGG_PROXIMAL_TUBULE_BICARBONATE_RECLAMATION |
23 |
4 |
0.1739 |
5.69E-03 |
2.52E-02 |
|
KEGG_ENDOMETRIAL_CANCER |
52 |
6 |
0.1154 |
6.17E-03 |
2.67E-02 |
|
KEGG_METABOLISM_OF_XENOBIOTICS_BY_CYTOCHROME_P450 |
70 |
7 |
0.1 |
7.04E-03 |
2.98E-02 |
|
KEGG_NON_SMALL_CELL_LUNG_CANCER |
54 |
6 |
0.1111 |
7.42E-03 |
3.07E-02 |
|
KEGG_DRUG_METABOLISM_CYTOCHROME_P450 |
72 |
7 |
0.0972 |
8.20E-03 |
3.27E-02 |
|
KEGG_CELL_CYCLE |
128 |
10 |
0.0781 |
8.26E-03 |
3.27E-02 |
|
KEGG_GALACTOSE_METABOLISM |
26 |
4 |
0.1538 |
8.91E-03 |
3.38E-02 |
|
KEGG_GLYCOSAMINOGLYCAN_BIOSYNTHESIS_HEPARAN_SULFATE |
26 |
4 |
0.1538 |
8.91E-03 |
3.38E-02 |
|
KEGG_PHOSPHATIDYLINOSITOL_SIGNALING_SYSTEM |
76 |
7 |
0.0921 |
1.09E-02 |
4.06E-02 |
Table 3: Reactome pathways identified by GSEA over-representation analysis.
|
Gene Set Name |
# Genes in Gene Set (K) |
# Genes in Overlap (k) |
k/K |
p-value |
FDR q-value |
|
REACTOME_IMMUNE_SYSTEM |
933 |
72 |
0.077 |
9.41E-12 |
6.34E-09 |
|
REACTOME_SIGNALING_BY_GPCR |
920 |
65 |
0.071 |
3.38E-09 |
1.14E-06 |
|
REACTOME_GPCR_DOWNSTREAM_SIGNALING |
805 |
58 |
0.072 |
1.18E-08 |
2.66E-06 |
|
REACTOME_ADAPTIVE_IMMUNE_SYSTEM |
539 |
43 |
0.080 |
5.58E-08 |
9.40E-06 |
|
REACTOME_HEMOSTASIS |
466 |
37 |
0.079 |
5.16E-07 |
6.96E-05 |
|
REACTOME_DEVELOPMENTAL_BIOLOGY |
396 |
32 |
0.081 |
2.04E-06 |
2.29E-04 |
|
REACTOME_METABOLISM_OF_LIPIDS_AND_LIPOPROTEINS |
478 |
35 |
0.073 |
6.30E-06 |
5.73E-04 |
|
REACTOME_CELL_CYCLE |
421 |
32 |
0.076 |
7.28E-06 |
5.73E-04 |
|
REACTOME_SIGNALLING_BY_NGF |
217 |
21 |
0.097 |
7.65E-06 |
5.73E-04 |
|
REACTOME_MHC_CLASS_II_ANTIGEN_PRESENTATION |
91 |
12 |
0.132 |
3.39E-05 |
2.28E-03 |
|
REACTOME_CELL_CYCLE_MITOTIC |
325 |
25 |
0.077 |
5.74E-05 |
3.52E-03 |
|
REACTOME_GROWTH_HORMONE_RECEPTOR_SIGNALING |
24 |
6 |
0.250 |
8.73E-05 |
4.90E-03 |
|
REACTOME_TRANSCRIPTIONAL_REGULATION_OF_WHITE_ADIPOCYTE_DIFFERENTIATION |
72 |
10 |
0.139 |
9.67E-05 |
5.01E-03 |
|
REACTOME_G_ALPHA1213_SIGNALLING_EVENTS |
74 |
10 |
0.135 |
1.22E-04 |
5.89E-03 |
|
REACTOME_ANTIGEN_PROCESSING_UBIQUITINATION_PROTEASOME_DEGRADATION |
212 |
18 |
0.085 |
1.80E-04 |
7.56E-03 |
|
REACTOME_TRANSMEMBRANE_TRANSPORT_OF_SMALL_MOLECULES |
413 |
28 |
0.068 |
1.88E-04 |
7.56E-03 |
|
REACTOME_CLASS_I_MHC_MEDIATED_ANTIGEN_PROCESSING_PRESENTATION |
251 |
20 |
0.080 |
1.91E-04 |
7.56E-03 |
|
REACTOME_P75_NTR_RECEPTOR_MEDIATED_SIGNALLING |
81 |
10 |
0.124 |
2.61E-04 |
9.79E-03 |
|
REACTOME_GPCR_LIGAND_BINDING |
408 |
27 |
0.066 |
3.54E-04 |
1.26E-02 |
|
REACTOME_PHASE1_FUNCTIONALIZATION_OF_COMPOUNDS |
70 |
9 |
0.129 |
3.87E-04 |
1.30E-02 |
|
REACTOME_OLFACTORY_SIGNALING_PATHWAY |
328 |
23 |
0.070 |
4.23E-04 |
1.30E-02 |
|
REACTOME_METABOLISM_OF_CARBOHYDRATES |
247 |
19 |
0.077 |
4.23E-04 |
1.30E-02 |
|
REACTOME_SIGNALING_BY_NOTCH |
103 |
11 |
0.107 |
4.71E-04 |
1.38E-02 |
|
REACTOME_AXON_GUIDANCE |
251 |
19 |
0.076 |
5.16E-04 |
1.45E-02 |
|
REACTOME_SIGNALING_BY_ILS |
107 |
11 |
0.103 |
6.51E-04 |
1.76E-02 |
|
REACTOME_INNATE_IMMUNE_SYSTEM |
279 |
20 |
0.072 |
7.41E-04 |
1.85E-02 |
|
REACTOME_NEURONAL_SYSTEM |
279 |
20 |
0.072 |
7.41E-04 |
1.85E-02 |
|
REACTOME_METABOLISM_OF_AMINO_ACIDS_AND_DERIVATIVES |
200 |
16 |
0.080 |
7.67E-04 |
1.85E-02 |
|
REACTOME_PLATELET_HOMEOSTASIS |
78 |
9 |
0.115 |
8.64E-04 |
1.97E-02 |
|
REACTOME_COSTIMULATION_BY_THE_CD28_FAMILY |
63 |
8 |
0.127 |
8.78E-04 |
1.97E-02 |
|
REACTOME_CYTOCHROME_P450_ARRANGED_BY_SUBSTRATE_TYPE |
51 |
7 |
0.137 |
1.15E-03 |
2.49E-02 |
|
REACTOME_MEIOSIS |
116 |
11 |
0.095 |
1.27E-03 |
2.69E-02 |
|
REACTOME_PLATELET_SENSITIZATION_BY_LDL |
16 |
4 |
0.250 |
1.40E-03 |
2.77E-02 |
|
REACTOME_XENOBIOTICS |
16 |
4 |
0.250 |
1.40E-03 |
2.77E-02 |
|
REACTOME_STRIATED_MUSCLE_CONTRACTION |
27 |
5 |
0.185 |
1.50E-03 |
2.88E-02 |
|
REACTOME_NGF_SIGNALLING_VIA_TRKA_FROM_THE_PLASMA_MEMBRANE |
137 |
12 |
0.088 |
1.56E-03 |
2.92E-02 |
|
REACTOME_GLUCOSE_METABOLISM |
69 |
8 |
0.116 |
1.60E-03 |
2.92E-02 |
|
REACTOME_LIPOPROTEIN_METABOLISM |
28 |
5 |
0.179 |
1.77E-03 |
3.15E-02 |
|
REACTOME_RNA_POL_I_RNA_POL_III_AND_MITOCHONDRIAL_TRANSCRIPTION |
122 |
11 |
0.090 |
1.91E-03 |
3.31E-02 |
|
REACTOME_NRAGE_SIGNALS_DEATH_THROUGH_JNK |
43 |
6 |
0.140 |
2.36E-03 |
3.97E-02 |
|
REACTOME_GENERIC_TRANSCRIPTION_PATHWAY |
352 |
22 |
0.063 |
2.42E-03 |
3.99E-02 |
|
REACTOME_PRE_NOTCH_EXPRESSION_AND_PROCESSING |
44 |
6 |
0.136 |
2.65E-03 |
4.26E-02 |
|
REACTOME_CELL_DEATH_SIGNALLING_VIA_NRAGE_NRIF_AND_NADE |
60 |
7 |
0.117 |
2.99E-03 |
4.68E-02 |
|
REACTOME_DNA_REPAIR |
112 |
10 |
0.089 |
3.24E-03 |
4.97E-02 |
|
REACTOME_ACTIVATION_OF_THE_AP1_FAMILY_OF_TRANSCRIPTION_FACTORS |
10 |
3 |
0.300 |
3.32E-03 |
4.97E-02 |
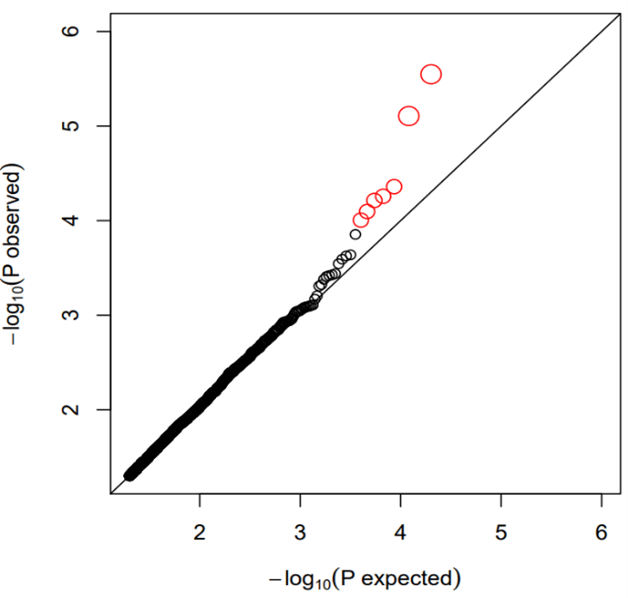
Figure 1: Q-Q plots for single probe analysis (p<0.05 only). The top probes (red) deviate upward from the p values of null hypothesis.
By submitting the genes in Supplementary (Table 1) to GSEA, we identified 50 KEGG (The Kyoto Encyclopedia of Genes and Genomes) pathways with FDR<0.05 (Table 2). Among the top significant pathways are JAK/STAT signaling pathway (FDR=1e-03), insulin signaling pathway (FDR=1.76e-03), MAPK signaling pathway (FDR=2.13e-03), axon guidance (FDR=2.19e-03), etc. Considering the fact that KEGG focuses on intermediary metabolism, we further performed pathway analysis using the Reactome database containing higher-level pathways compiled based on a broad range of species [16]. Table 3 shows the 45 Reactome pathways identified with FDR<0.05. Among them, nine are highly significant with FDR<1e-03 (p<1e-05) such as immune system (FDR=1.34e-09), G protein-coupled receptor (GPCR) signaling pathway (FDR=1.14e-06), hemostasis (FDR=6.96e-05), developmental biology (FDR=2.29e-04), signaling by nerve growth factor (NGF) (FDR=5.73e-04), olfactory signaling (FDR=1.3e-02) etc. Table 3 also contains multiple pathways directly implicated in metabolism including metabolism of lipids and lipoproteins (FDR=5.73e-04), metabolism of carbohydrates (FDR=1.30e-02), glucose metabolism (FDR=2.93e-02) and lipoprotein metabolism (FDR=3.15e-02).
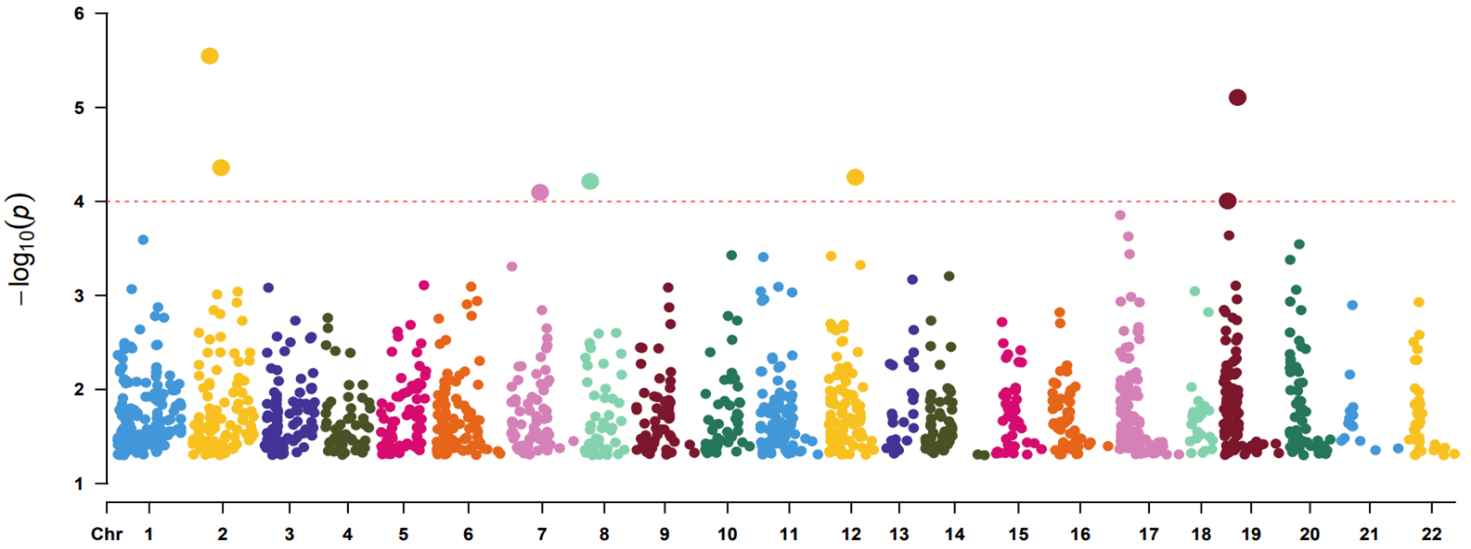
Figure 2: Manhattan plot showing probe significance (p<0.05 only) along each chromosome.
Discussion
The high genetic contribution to BMI variation as estimated in twins, and in family studies, suggests the need to study the relation between transcriptional activity and BMI while controlling for genetics, given the fact that genetic variations could affect both BMI and gene expression [4, 17-19]. Instead of using unrelated samples, focusing on genetically identical individuals (e.g. MZ twins) can control for genetic variations in the study samples. However, traditional statistical testing on dependent samples requires modeling the relatedness in sample clusters using, for example, the mixed effects modeling assigning sample correlation as random effect variables with increased model complexity and reduced power in statistical testing. The application of GCC on twin data provides a simple but efficient way for handling related samples in TWAS. Most importantly, generalized correlation is a non-parametric method by nature meaning that its assessment of correlation between gene expression and BMI was done without imposing any assumption such as the linear relationship in regression modeling. The latter is sensitive to outlier observations in model fitting. As a result, our reported gene expression markers detected by the model-free approach are biologically meaningful and significantly enriched in functional pathways closely implicated in metabolism, although, many other pathways e.g. related to blood cell functioning (immune biology and hemostasis) and neuro function were also enriched.
In (Figure 1), the top probes (red coloured) show upward deviation from p values under the null hypothesis suggesting their non-random association with BMI. In accordance, functional annotation and published literature confirm their biological relevance. In (Table 1), the most significant probe (A_33_P3289204, p=2.83e-06) is from AAK1 gene. The gene has been shown as a positive regulator of the Notch pathway which is a novel regulator of metabolism [20, 21]. Both AAK1 and Notch signaling are implicated in neurological impairments, which have been shown to relate to metabolic disorders [22-24]. The number 2 probe (A_23_P79094, p=7.83e-06) belongs to LILRA3 for which a SNP (rs367070) has been reported to associate with HDL-C [25]. The human LILRA gene family has diverse functions characterized by regulation of inflammation and immune tolerance [26]. The LILRA3 regulated immunity alteration could be involved in obesity, a condition characterized by chronic low-grade inflammation [27]. For the third gene in (Table 1), PAX8, differential DNA methylation was identified to associate with gestational famine exposure and metabolic traits [28]. Other interesting genes linked to top probes of (Table 1) include PPP1R3A whose SNP variation has been associated with risk of type 2 diabetes and CYP4F12 which belongs to the cytochrome P450 4 (CYP4) family implicated in various biological functions including inflammation, cardiovascular health, and cancer [29, 30].
Biological pathway analysis was performed using KEGG and Reactome databases with both revealing significantly enriched functional pathways implicated in metabolic health together with other biological functions. For example, the top pathways in (Table 2) include pathways in cancer and insulin signaling. In the literature, development of insulin resistance and hyperinsulinemia has been shown as a clear link between adipose tissue expansion and etiology of diseases like obesity, type-2 diabetes and cancer [31]. Likewise, the implication of MAPK signaling in obesity-related immune paralysis and cancer has been reviewed very recently [32]. Another top significant pathway, JAK/STAT signaling pathway in (Table 2) is a highly conserved functional pathway required for normal homeostasis which, when dysregulated, contributes to the development of obesity and diabetes [33].
Like the KEGG pathways (Table 2), the importance of immunity is also reflected in the top significant Reactome pathways shown in (Table 3) (immune system with FDR 6.34e-09 and adaptive immune system with FDR 9.40e-06). The phenomenon can be explained by the target tissue used in this study, i.e. whole blood, which comprises of immune cells. Moreover, results in (Table 3) emphasize high implication of GPCR signaling in BMI variation. This is highly interesting as the melanocortin-4 receptor (MC4R), a GPCR embedded in the membranes of nerve cells in the brain's appetite control center, has been shown to provide clues to obesity treatment [34]. Another study has found that pathway of GPCR was overrepresented and it is associated with pediatric obesity [35]. As a potential therapeutic target for intervention in cognitive deficits, the association of GPCR signaling pathway with BMI could reflect the intrinsic connection between cognition and obesity [36, 37]. Table 3 also contains significant pathways directly related to metabolism of lipids, lipoproteins and carbohydrates, etc. which are closely related to obesity development as well as pathways overlapping with (Table 2) including axon guidance reportedly to implicate in early-onset obesity [38], and olfactory signaling/transduction shown to regulate lipid metabolism through neuroendocrine signaling in Caenorhabditis elegans [38, 39]. Methylation of olfactory pathway genes has been associated with dietary intake and obesity features [40].
In summary, by introducing generalized correlation coefficient for assumption-free association analysis and using monozygotic twins to control genetic confounding, this transcriptome-wide association study on BMI using peripheral blood identified differentially expressed genes and their enriched biological pathways implicated in multiple biological functions including immune biology, hemostasis, neural function, cancer, and metabolism. Findings from this study merit replications using independent samples to verify expression markers and functional pathways for characterizing and determining non-genetic etiology of obesity and health conditions.
Statement of Ethics
The survey was approved by The Regional Scientific Ethical Committees for Southern Denmark (S-VF-19980072) and conducted in accordance with the Helsinki II declaration, with informed consent to participate in the survey obtained from all participants.
Funding
This study was jointly supported by the Lundbeck Foundation (grant number R170-2014-1353), the DFF research project 1 from the Danish Council for Independent Research, Medical Sciences (DFF-FSS) (grant number DFF – 6110-00114); the Novo Nordisk Foundation Medical and Natural Sciences Research Grant (grant number NNF13OC0007493). JB is grateful for funding from VILLUM Young Investigator grant nr. 13154 and funding from the BMBF center CLINSPECT-M.
Conflicts of Interest
None.
Article Info
Article Type
Research ArticlePublication history
Received: Tue 27, Oct 2020Accepted: Fri 06, Nov 2020
Published: Fri 04, Dec 2020
Copyright
© 2023 Qihua Tan. This is an open-access article distributed under the terms of the Creative Commons Attribution License, which permits unrestricted use, distribution, and reproduction in any medium, provided the original author and source are credited. Hosting by Science Repository.DOI: 10.31487/j.GG.2020.01.04
Figures & Tables
Table 1: Top 20 probes from mRNA analysis. A is the association score or GCC from matie package.
|
Probe ID |
Gene Symbol |
p-value |
A |
|
A_33_P3289204 |
AAK1 |
2.83E-06 |
0.216 |
|
A_23_P79094 |
LILRA3 |
7.83E-06 |
0.207 |
|
A_33_P3234809 |
PAX8 |
4.37E-05 |
0.190 |
|
A_32_P133767 |
C12orf42 |
5.52E-05 |
0.187 |
|
A_33_P3364060 |
HR |
6.11E-05 |
0.186 |
|
A_33_P3213179 |
PPP1R3A |
8E-05 |
0.183 |
|
A_23_P108280 |
CYP4F12 |
9.87E-05 |
0.181 |
|
A_33_P3659808 |
PELP1 |
0.00014 |
0.177 |
|
A_23_P67702 |
ZNF85 |
0.00023 |
0.171 |
|
A_32_P9575 |
MRPL45 |
0.000236 |
0.171 |
|
A_23_P45851 |
HIAT1 |
0.000256 |
0.170 |
|
A_19_P00318014 |
SNHG11 |
0.000285 |
0.169 |
|
A_24_P395621 |
RUNDC1 |
0.000363 |
0.166 |
|
A_33_P3392250 |
FAM178A |
0.000373 |
0.166 |
|
A_33_P3295328 |
CLEC6A |
0.000381 |
0.165 |
|
A_23_P127948 |
ADM |
0.00039 |
0.165 |
|
A_23_P131899 |
SDCBP2 |
0.000417456 |
0.164 |
|
A_23_P329924 |
HCAR2 |
0.000474119 |
0.163 |
|
A_33_P3351189 |
LOC100129603 |
0.000492092 |
0.162 |
|
A_23_P105973 |
SERPINA11 |
0.000623576 |
0.159 |
Table 2: KEGG pathways identified by GSEA over-representation analysis.
|
Gene Set Name |
# Genes in Gene Set (K) |
# Genes in Overlap (k) |
k/K |
p-value |
FDR q-value |
|
KEGG_PATHWAYS_IN_CANCER |
328 |
33 |
0.101 |
8.64E-09 |
1.61E-06 |
|
KEGG_JAK_STAT_SIGNALING_PATHWAY |
155 |
17 |
0.110 |
1.08E-05 |
1.00E-03 |
|
KEGG_INSULIN_SIGNALING_PATHWAY |
137 |
15 |
0.110 |
3.56E-05 |
1.76E-03 |
|
KEGG_DILATED_CARDIOMYOPATHY |
92 |
12 |
0.130 |
3.78E-05 |
1.76E-03 |
|
KEGG_MAPK_SIGNALING_PATHWAY |
267 |
22 |
0.082 |
5.72E-05 |
2.13E-03 |
|
KEGG_AXON_GUIDANCE |
129 |
14 |
0.109 |
7.06E-05 |
2.19E-03 |
|
KEGG_HYPERTROPHIC_CARDIOMYOPATHY_HCM |
85 |
11 |
0.129 |
8.49E-05 |
2.25E-03 |
|
KEGG_LEUKOCYTE_TRANSENDOTHELIAL_MIGRATION |
118 |
13 |
0.110 |
1.09E-04 |
2.53E-03 |
|
KEGG_OLFACTORY_TRANSDUCTION |
389 |
27 |
0.069 |
1.66E-04 |
3.44E-03 |
|
KEGG_NEUROACTIVE_LIGAND_RECEPTOR_INTERACTION |
272 |
21 |
0.077 |
2.06E-04 |
3.84E-03 |
|
KEGG_CARDIAC_MUSCLE_CONTRACTION |
80 |
10 |
0.125 |
2.36E-04 |
3.99E-03 |
|
KEGG_WNT_SIGNALING_PATHWAY |
151 |
14 |
0.093 |
3.74E-04 |
5.14E-03 |
|
KEGG_TIGHT_JUNCTION |
134 |
13 |
0.097 |
3.86E-04 |
5.14E-03 |
|
KEGG_PANCREATIC_CANCER |
70 |
9 |
0.129 |
3.87E-04 |
5.14E-03 |
|
KEGG_NUCLEOTIDE_EXCISION_REPAIR |
44 |
7 |
0.159 |
4.61E-04 |
5.56E-03 |
|
KEGG_LEISHMANIA_INFECTION |
72 |
9 |
0.125 |
4.78E-04 |
5.56E-03 |
|
KEGG_VIRAL_MYOCARDITIS |
73 |
9 |
0.123 |
5.30E-04 |
5.80E-03 |
|
KEGG_T_CELL_RECEPTOR_SIGNALING_PATHWAY |
108 |
11 |
0.102 |
7.05E-04 |
6.84E-03 |
|
KEGG_ARRHYTHMOGENIC_RIGHT_VENTRICULAR_CARDIOMYOPATHY_ARVC |
76 |
9 |
0.118 |
7.15E-04 |
6.84E-03 |
|
KEGG_GLYCOLYSIS_GLUCONEOGENESIS |
62 |
8 |
0.129 |
7.88E-04 |
6.84E-03 |
|
KEGG_INTESTINAL_IMMUNE_NETWORK_FOR_IGA_PRODUCTION |
48 |
7 |
0.146 |
7.93E-04 |
6.84E-03 |
|
KEGG_FOCAL_ADHESION |
201 |
16 |
0.080 |
8.09E-04 |
6.84E-03 |
|
KEGG_CELL_ADHESION_MOLECULES_CAMS |
134 |
12 |
0.090 |
1.29E-03 |
1.04E-02 |
|
KEGG_P53_SIGNALING_PATHWAY |
69 |
8 |
0.116 |
1.60E-03 |
1.11E-02 |
|
KEGG_PYRUVATE_METABOLISM |
40 |
6 |
0.150 |
1.61E-03 |
1.11E-02 |
|
KEGG_MELANOGENESIS |
102 |
10 |
0.098 |
1.62E-03 |
1.11E-02 |
|
KEGG_UBIQUITIN_MEDIATED_PROTEOLYSIS |
138 |
12 |
0.087 |
1.66E-03 |
1.11E-02 |
|
KEGG_REGULATION_OF_ACTIN_CYTOSKELETON |
216 |
16 |
0.074 |
1.72E-03 |
1.11E-02 |
|
KEGG_TGF_BETA_SIGNALING_PATHWAY |
86 |
9 |
0.105 |
1.74E-03 |
1.11E-02 |
|
KEGG_BASAL_CELL_CARCINOMA |
55 |
7 |
0.127 |
1.80E-03 |
1.12E-02 |
|
KEGG_ASTHMA |
30 |
5 |
0.167 |
2.44E-03 |
1.45E-02 |
|
KEGG_LYSINE_DEGRADATION |
44 |
6 |
0.136 |
2.65E-03 |
1.45E-02 |
|
KEGG_HUNTINGTONS_DISEASE |
185 |
14 |
0.076 |
2.67E-03 |
1.45E-02 |
|
KEGG_ADHERENS_JUNCTION |
75 |
8 |
0.107 |
2.73E-03 |
1.45E-02 |
|
KEGG_B_CELL_RECEPTOR_SIGNALING_PATHWAY |
75 |
8 |
0.107 |
2.73E-03 |
1.45E-02 |
|
KEGG_ACUTE_MYELOID_LEUKEMIA |
60 |
7 |
0.117 |
2.99E-03 |
1.54E-02 |
|
KEGG_CITRATE_CYCLE_TCA_CYCLE |
32 |
5 |
0.1562 |
3.27E-03 |
1.65E-02 |
|
KEGG_COLORECTAL_CANCER |
62 |
7 |
0.1129 |
3.60E-03 |
1.76E-02 |
|
KEGG_BASE_EXCISION_REPAIR |
35 |
5 |
0.1429 |
4.87E-03 |
2.32E-02 |
|
KEGG_PURINE_METABOLISM |
159 |
12 |
0.0755 |
5.30E-03 |
2.47E-02 |
|
KEGG_SMALL_CELL_LUNG_CANCER |
84 |
8 |
0.0952 |
5.50E-03 |
2.49E-02 |
|
KEGG_PROXIMAL_TUBULE_BICARBONATE_RECLAMATION |
23 |
4 |
0.1739 |
5.69E-03 |
2.52E-02 |
|
KEGG_ENDOMETRIAL_CANCER |
52 |
6 |
0.1154 |
6.17E-03 |
2.67E-02 |
|
KEGG_METABOLISM_OF_XENOBIOTICS_BY_CYTOCHROME_P450 |
70 |
7 |
0.1 |
7.04E-03 |
2.98E-02 |
|
KEGG_NON_SMALL_CELL_LUNG_CANCER |
54 |
6 |
0.1111 |
7.42E-03 |
3.07E-02 |
|
KEGG_DRUG_METABOLISM_CYTOCHROME_P450 |
72 |
7 |
0.0972 |
8.20E-03 |
3.27E-02 |
|
KEGG_CELL_CYCLE |
128 |
10 |
0.0781 |
8.26E-03 |
3.27E-02 |
|
KEGG_GALACTOSE_METABOLISM |
26 |
4 |
0.1538 |
8.91E-03 |
3.38E-02 |
|
KEGG_GLYCOSAMINOGLYCAN_BIOSYNTHESIS_HEPARAN_SULFATE |
26 |
4 |
0.1538 |
8.91E-03 |
3.38E-02 |
|
KEGG_PHOSPHATIDYLINOSITOL_SIGNALING_SYSTEM |
76 |
7 |
0.0921 |
1.09E-02 |
4.06E-02 |
Table 3: Reactome pathways identified by GSEA over-representation analysis.
|
Gene Set Name |
# Genes in Gene Set (K) |
# Genes in Overlap (k) |
k/K |
p-value |
FDR q-value |
|
REACTOME_IMMUNE_SYSTEM |
933 |
72 |
0.077 |
9.41E-12 |
6.34E-09 |
|
REACTOME_SIGNALING_BY_GPCR |
920 |
65 |
0.071 |
3.38E-09 |
1.14E-06 |
|
REACTOME_GPCR_DOWNSTREAM_SIGNALING |
805 |
58 |
0.072 |
1.18E-08 |
2.66E-06 |
|
REACTOME_ADAPTIVE_IMMUNE_SYSTEM |
539 |
43 |
0.080 |
5.58E-08 |
9.40E-06 |
|
REACTOME_HEMOSTASIS |
466 |
37 |
0.079 |
5.16E-07 |
6.96E-05 |
|
REACTOME_DEVELOPMENTAL_BIOLOGY |
396 |
32 |
0.081 |
2.04E-06 |
2.29E-04 |
|
REACTOME_METABOLISM_OF_LIPIDS_AND_LIPOPROTEINS |
478 |
35 |
0.073 |
6.30E-06 |
5.73E-04 |
|
REACTOME_CELL_CYCLE |
421 |
32 |
0.076 |
7.28E-06 |
5.73E-04 |
|
REACTOME_SIGNALLING_BY_NGF |
217 |
21 |
0.097 |
7.65E-06 |
5.73E-04 |
|
REACTOME_MHC_CLASS_II_ANTIGEN_PRESENTATION |
91 |
12 |
0.132 |
3.39E-05 |
2.28E-03 |
|
REACTOME_CELL_CYCLE_MITOTIC |
325 |
25 |
0.077 |
5.74E-05 |
3.52E-03 |
|
REACTOME_GROWTH_HORMONE_RECEPTOR_SIGNALING |
24 |
6 |
0.250 |
8.73E-05 |
4.90E-03 |
|
REACTOME_TRANSCRIPTIONAL_REGULATION_OF_WHITE_ADIPOCYTE_DIFFERENTIATION |
72 |
10 |
0.139 |
9.67E-05 |
5.01E-03 |
|
REACTOME_G_ALPHA1213_SIGNALLING_EVENTS |
74 |
10 |
0.135 |
1.22E-04 |
5.89E-03 |
|
REACTOME_ANTIGEN_PROCESSING_UBIQUITINATION_PROTEASOME_DEGRADATION |
212 |
18 |
0.085 |
1.80E-04 |
7.56E-03 |
|
REACTOME_TRANSMEMBRANE_TRANSPORT_OF_SMALL_MOLECULES |
413 |
28 |
0.068 |
1.88E-04 |
7.56E-03 |
|
REACTOME_CLASS_I_MHC_MEDIATED_ANTIGEN_PROCESSING_PRESENTATION |
251 |
20 |
0.080 |
1.91E-04 |
7.56E-03 |
|
REACTOME_P75_NTR_RECEPTOR_MEDIATED_SIGNALLING |
81 |
10 |
0.124 |
2.61E-04 |
9.79E-03 |
|
REACTOME_GPCR_LIGAND_BINDING |
408 |
27 |
0.066 |
3.54E-04 |
1.26E-02 |
|
REACTOME_PHASE1_FUNCTIONALIZATION_OF_COMPOUNDS |
70 |
9 |
0.129 |
3.87E-04 |
1.30E-02 |
|
REACTOME_OLFACTORY_SIGNALING_PATHWAY |
328 |
23 |
0.070 |
4.23E-04 |
1.30E-02 |
|
REACTOME_METABOLISM_OF_CARBOHYDRATES |
247 |
19 |
0.077 |
4.23E-04 |
1.30E-02 |
|
REACTOME_SIGNALING_BY_NOTCH |
103 |
11 |
0.107 |
4.71E-04 |
1.38E-02 |
|
REACTOME_AXON_GUIDANCE |
251 |
19 |
0.076 |
5.16E-04 |
1.45E-02 |
|
REACTOME_SIGNALING_BY_ILS |
107 |
11 |
0.103 |
6.51E-04 |
1.76E-02 |
|
REACTOME_INNATE_IMMUNE_SYSTEM |
279 |
20 |
0.072 |
7.41E-04 |
1.85E-02 |
|
REACTOME_NEURONAL_SYSTEM |
279 |
20 |
0.072 |
7.41E-04 |
1.85E-02 |
|
REACTOME_METABOLISM_OF_AMINO_ACIDS_AND_DERIVATIVES |
200 |
16 |
0.080 |
7.67E-04 |
1.85E-02 |
|
REACTOME_PLATELET_HOMEOSTASIS |
78 |
9 |
0.115 |
8.64E-04 |
1.97E-02 |
|
REACTOME_COSTIMULATION_BY_THE_CD28_FAMILY |
63 |
8 |
0.127 |
8.78E-04 |
1.97E-02 |
|
REACTOME_CYTOCHROME_P450_ARRANGED_BY_SUBSTRATE_TYPE |
51 |
7 |
0.137 |
1.15E-03 |
2.49E-02 |
|
REACTOME_MEIOSIS |
116 |
11 |
0.095 |
1.27E-03 |
2.69E-02 |
|
REACTOME_PLATELET_SENSITIZATION_BY_LDL |
16 |
4 |
0.250 |
1.40E-03 |
2.77E-02 |
|
REACTOME_XENOBIOTICS |
16 |
4 |
0.250 |
1.40E-03 |
2.77E-02 |
|
REACTOME_STRIATED_MUSCLE_CONTRACTION |
27 |
5 |
0.185 |
1.50E-03 |
2.88E-02 |
|
REACTOME_NGF_SIGNALLING_VIA_TRKA_FROM_THE_PLASMA_MEMBRANE |
137 |
12 |
0.088 |
1.56E-03 |
2.92E-02 |
|
REACTOME_GLUCOSE_METABOLISM |
69 |
8 |
0.116 |
1.60E-03 |
2.92E-02 |
|
REACTOME_LIPOPROTEIN_METABOLISM |
28 |
5 |
0.179 |
1.77E-03 |
3.15E-02 |
|
REACTOME_RNA_POL_I_RNA_POL_III_AND_MITOCHONDRIAL_TRANSCRIPTION |
122 |
11 |
0.090 |
1.91E-03 |
3.31E-02 |
|
REACTOME_NRAGE_SIGNALS_DEATH_THROUGH_JNK |
43 |
6 |
0.140 |
2.36E-03 |
3.97E-02 |
|
REACTOME_GENERIC_TRANSCRIPTION_PATHWAY |
352 |
22 |
0.063 |
2.42E-03 |
3.99E-02 |
|
REACTOME_PRE_NOTCH_EXPRESSION_AND_PROCESSING |
44 |
6 |
0.136 |
2.65E-03 |
4.26E-02 |
|
REACTOME_CELL_DEATH_SIGNALLING_VIA_NRAGE_NRIF_AND_NADE |
60 |
7 |
0.117 |
2.99E-03 |
4.68E-02 |
|
REACTOME_DNA_REPAIR |
112 |
10 |
0.089 |
3.24E-03 |
4.97E-02 |
|
REACTOME_ACTIVATION_OF_THE_AP1_FAMILY_OF_TRANSCRIPTION_FACTORS |
10 |
3 |
0.300 |
3.32E-03 |
4.97E-02 |
References
- De Gonzalez AB, Hartge P, Cerhan JR, Flint AJ, Hannan L et al. (2010) Body-mass index and mortality among 1.46 million white adults. N Engl J Med 363: 2211-2219. [Crossref]
- NCD Risk Factor Collaboration (2016) Trends in adult body-mass index in 200 countries from 1975 to 2014: A pooled analysis of 1698 population-based measurement studies with 19.2 million participants. Lancet 387: 1377-1396. [Crossref]
- Gaziano TA, Opie LH (2009) Body-mass index and mortality. Lancet 374: 113-114. [Crossref]
- Hjelmborg JVB, Fagnani C, Silventoinen K, McGue M, Korkeila M et al. (2008) Genetic influences on growth traits of BMI: A longitudinal study of adult twins. Obesity 16: 847-852. [Crossref]
- Wainschtein P, Jain DP, Yengo L, Zheng Z, Shadyab AH et al. (2019) Recovery of trait heritability from whole genome sequence data. BioRxiv.
- Li W, Christiansen L, Hjelmborg J, Baumbach J, Tan Q (2018) On the power of epigenome-wide association studies using a disease-discordant twin design. Bioinformatics 34: 4073-4078. [Crossref]
- Tan Q (2013) Epigenetic epidemiology of complex diseases using twins. Med Epigenet 1: 46-51.
- Gaist D, Bathum L, Skythhe A, Jensen TK, McGue M et al. (2000) Strength and anthropometric measures in identical and fraternal twins: No evidence of masculinization of females with male co-twins. Epidemiology 11: 340-343. [Crossref]
- Aryee MJ, Jaffe AE, Corrada Bravo H, Ladd Acosta C, Feinberg AP et al. (2014) Minfi: A flexible and comprehensive Bioconductor package for the analysis of Infinium DNA methylation microarrays. Bioinformatics 30: 1363-1369. [Crossref]
- Soerensen M, Li W, Debrabant B, Nygaard M, Mengel From J et al. (2019) Epigenome-wide exploratory study of monozygotic twins suggests differentially methylated regions to associate with hand grip strength. Biogerontology 20: 627-647. [Crossref]
- Yang YH, Dudoit S, Luu P, Lin DM, Peng V et al. (2002) Normalization for cDNA microarray data: A robust composite method addressing single and multiple slide systematic variation. Nucleic Acids Res 30: e15. [Crossref]
- Ritchie ME, Silver J, Oshlack A, Holmes M, Diyagama D et al. (2007) A comparison of background correction methods for two-colour microarrays. Bioinformatics 23: 2700-2707. [Crossref]
- Tan Q, Christiansen L, Hjelmborg JVB, Christensen K (2015) Twin methodology in epigenetic studies. J Exp Biol 218: 134-139. [Crossref]
- Murrell B, Murrell D, Murrell H (2016) Discovering general multidimensional associations. PLoS One 11: e0151551. [Crossref]
- Subramanian A, Tomayo P, Mootha VK, Mukherjee S, Ebert BL et al. (2005) Gene set enrichment analysis: A knowledge-based approach for interpreting genome-wide expression profiles. Proc Natl Acad Sci USA 102: 15545-15550. [Crossref]
- Haw R, Hermjakob H, D’Eustachio P, Stein L (2011) Reactome pathway analysis to enrich biological discovery in proteomics data sets. Proteomics 11: 3598-3613. [Crossref]
- Li S, Duan H, Pang Z, Zhang D, Duan H et al. (2013) Heritability of eleven metabolic phenotypes in Danish and Chinese twins: A cross-population comparison. Obesity 21: 1908-1914. [Crossref]
- Skarić Jurić T, Ginsburg E, Kobyliansky E, Malkin I, Narancić NS et al. (2003) Complex segregation analysis of body height, weight and BMI in pedigree data from Middle Dalmatia, Croatia. Coll Antropol 27: 135-149. [Crossref]
- Lee KE, Klein BEK, Klein R (2003) Familial aggregation of components of the multiple metabolic syndrome in the Framingham Heart and Offspring Cohorts: Genetic Analysis Workshop Problem 1. BMC Genet 4: S94. [Crossref]
- Gupta Rossi N, Ortica S, Meas Yedid V, Heuss S, Moretti J et al. (2011) The adaptor-associated kinase 1, AAK1, is a positive regulator of the notch pathway. J Biol Chem 286: 18720-18730. [Crossref]
- Bi P, Kuang S (2015) Notch signaling as a novel regulator of metabolism. Trends Endocrinol Metab 26: 248-255. [Crossref]
- Schubert KO, Föcking M, Prehn JHM, Cotter DR (2012) Hypothesis review: Are clathrin-mediated endocytosis and clathrin-dependent membrane and protein trafficking core pathophysiological processes in schizophrenia and bipolar disorder. Mol Psychiatry 17: 669-681. [Crossref]
- Ables JL, Breunig JJ, Eisch AJ, Rakic P (2011) Not(ch) just development: Notch signalling in the adult brain. Nat Rev Neurosci 12: 269-283. [Crossref]
- O’Brien PD, Hinder LM, Callaghan BC, Feldman EL (2017) Neurological consequences of obesity. Lancet Neurol 16: 465-477. [Crossref]
- Stanley A, Ponde CK, Rajani RM, Ashavaid TF (2017) Association between genetic loci linked to HDL-C levels and Indian patients with CAD: a pilot study. Heart Asia 9: 9-13. [Crossref]
- Hirayasu K, Arase H (2015) Functional and genetic diversity of leukocyte immunoglobulin-like receptor and implication for disease associations. J Hum Genet 60: 703-708. [Crossref]
- Lee H, Lee IS, Choue R (2013) Obesity, Inflammation and Diet. Pediatr Gastroenterol Hepatol Nutr 16: 143-152. [Crossref]
- Finer S, Iqbal MS, Lowe R, Ogunkolade BW, Pervin S et al. (2016) Is famine exposure during developmental life in rural Bangladesh associated with a metabolic and epigenetic signature in young adulthood? A historical cohort study. BMJ Open 6: e011768. [Crossref]
- Sánchez Pozos K, Ortíz López MG, Peña Espinoza BI, Granados Silvestre MLA, Jiménez Jacinto V et al. (2018) Whole-exome sequencing in maya indigenous families: variant in PPP1R3A is associated with type 2 diabetes. Mol Genet Genomics 293: 1205-1216. [Crossref]
- Jarrar YB, Lee SJ (2019) Molecular functionality of cytochrome P450 4 (CYP4) genetic polymorphisms and their clinical implications. Int J Mol Sci 20: 4274. [Crossref]
- Poloz Y, Stambolic V (2015) Obesity and cancer, a case for insulin signaling. Cell Death Dis 6: e2037. [Crossref]
- Donohoe F, Wilkinson M, Baxter M, Brennan DJ (2020) Mitogen-Activated Protein Kinase (MAPK) and Obesity-Related Cancer. Int J Mol Sci 21: 1241. [Crossref]
- Gurzov EN, Stanley WJ, Pappas EG, Thomas HE, Gough DJ (2016) The JAK/STAT pathway in obesity and diabetes. FEBS J 283: 3002-3015. [Crossref]
- Ghamari Langroudi M, Digby GJ, Sebag JA, Millhauser GL, Palomino R et al. (2015) G-protein-independent coupling of MC4R to Kir7.1 in hypothalamic neurons. Nature 520: 94-98. [Crossref]
- Dorajoo R, Ong RTH, Sim X, Wang L, Liu W et al. (2017) The contribution of recently identified adult BMI risk loci to paediatric obesity in a Singaporean Chinese childhood dataset. Pediatr Obes 12: e46-e50. [Crossref]
- Azam S, Haque ME, Jakaria M, Jo SH, Kim IS et al. (2020) G-Protein-Coupled Receptors in CNS: A Potential Therapeutic Target for Intervention in Neurodegenerative Disorders and Associated Cognitive Deficits. Cells 9: 506. [Crossref]
- Smith E, Hay P, Campbell L, Trollor JN (2011) A review of the association between obesity and cognitive function across the lifespan: Implications for novel approaches to prevention and treatment. Obes Rev 12: 740-55. [Crossref]
- Zeltser LM (2019) Axon Guidance Molecules Implicated in Early-Onset Obesity. Trends Neurosci 42: 439-440. [Crossref]
- Mutlu AS, Gao SM, Zhang H, Wang MC (2020) Olfactory specificity regulates lipid metabolism through neuroendocrine signaling in Caenorhabditis elegans. Nat Commun 11: 1450. [Crossref]
- Ramos Lopez O, Riezu Boj JI, Milagro FI, Zulet MA, Santos JL et al. (2019) Associations between olfactory pathway gene methylation marks, obesity features and dietary intakes. Genes Nutr 14: 11. [Crossref]