
Genetic Mutations and Their Clinical Implications in Older Patients with Acute Myeloid Leukemia
A B S T R A C T
Objective:A number of leukemia-associated and patient-specific factors are related to the prognosis in older acute myeloid leukemia (AML) patients. In this study, we focus on the genetic mutations of older patients with AML and their impact on the clinical and prognosis.
Methods: We retrospectively analysed the clinical, cytogenetic and laboratory data of 427 de novo non-M3 AML patients treated in our hospital from January 2000 to March 2014. We compared relevant mutations in 21 genes between AML patients aged 60 years or older and those younger and exposed their prognostic implications. Then clinical curative effect survival rate of patients in two groups was observed after followed-up.
Results: Compared with the younger patients, the elderly had significantly higher incidences of PTPN11, NPM1, RUNX1, ASXL1, TET2, DNMT3A and TP53 mutations but a lower frequency of WT1 mutations. The older patients more frequently had one or more adverse genetic alterations. Multivariate analysis showed that DNMT3A and TP53 mutations were independent poor prognostic factors among the elderly, while NPM1 mutation in the absence of FLT3/ITD was an independent favorable prognostic factor. Furthermore, the status of mutations could well stratify older patients with intermediate-risk cytogenetic into three risk groups.
Conclusion: Older AML patients showed distinct genetic alterations from the younger group. Integration of cytogenetic and molecular mutations can better risk-stratify older AML patients. Development of novel therapies is needed to improve the outcome of older patients with poor prognosis under current treatment.
Keywords
Acute myeloid leukemia (AML), genetic mutation, cytogenetic
Introduction
Acute myelocytic leukemia (AML) is a hematopoietic stem cell originated malignant tumor which threatening the health of humankind. Even the prognosis of young patients has been improved gradually in the last four decades, the survival rate of elder patients remains quite low, and reports regarding the clinical significance about AML gene mutation in aged patients are still very rare [1, 2]. Today, it has been widely accepted that acquired gene mutation is closely related to the occurrence, development and prognosis of AML. Many leukemia related factors can lead to the unsatisfactory prognosis of AML besides the inherent systemic conditions such as accompanied diseases, poor body status, and intolerance of enhanced chemotherapy [3]. Cytogenetic study which has been the instructor for the risk classification and treatment design of AML for a very long time, is the key backbone for the treatment and prognosis of AML [4, 5]. Appelbaum et al. found a higher risk of cytogenetic adverse in aged patients, especially the mutations in chromosome numbers 5, 7 and 17 [3].
Many acquired gene mutations, such as NPM1, CEBPA, RUNX1, WT1, DNMT3A, ASXL1, IDH2 and FLT3 which significantly affect the prognosis, has been found in the AML patients, especially among the one with medium cytogenetic risk [6-17]. But the relationship between gene mutation of aged AML patients and clinical significance still remained less explored. This study might pave the road to targeted therapy of the patients who showed compromised prognosis under current treatment.
Materials and Methods
I Clinical Documents
Clinical, cytogenetic and lab data of 427 patients (with 149 over 60 years old) diagnosed as non-M3 AML for the first time in our hospital from January 2000 till March 2014 were collected. All patients showed no congenital hematopoiesis diseases, history of leukopenia, family history of myelocyte tumor, nor treatment associated AML. Diagnosis and grading of AML patients were carried out under the standard of FAB. The whole experiment has passed the censorship of ethics committee, and informed consent was signed by every patient. 310 of the chosen patients were subjected to standard guided alleviation therapy (Demethyl Roxithromycin 12mg/d for day 1-3, cytarabine 200mg/d for day 1-7). The rest of patients were subjected to placebo or low dose chemical therapy (2/3 dose of standard guided alleviation therapy).
II Cytogenetics
Bone marrow stem cells were obtained through transient non-stimulative culture. Metaphase chromosomes were marked by Trypsin-Giemsa combining technology.
III Analysis of Gene Mutation
21 gene mutations were analysed including category I mutation of FLT3/ITD, FLT3/TKD, NRAS, KRAS, JAK2, KIT, and PTPN11; category II mutation of CEBPA, RUNX1, NPM1, WT1, TP53, and mucoprotein complex gene (including STAG1/2, SMC1A, SMC3, and RAD21), and the mutation of acquired modification gene (including MLL/PTD, ASXL1, IDH1, IDH2, TET2, DNMT3A20) [18-29].
Bone marrow cells were then anti-coagulated by EDTA before the extraction of total RNA by Trizol one step method. Then the RNA was reverse transcribed to cDNA by MMLV reverse transcriptase. Transcription factor enhancer combined factor gene (E2A) was selected as positive internal reference. Gene mutations were analysed by direct gene sequencing. One mutation site could be recognized when the following conditions are satisfied: 1) sequencing peak curve indicates heterozygosis with two single recognizable peaks, and low background; 2) sequencing of forward and backward should both be heterozygosis and in consistency with each other, one negative mutation occurred in two sequencings will be considered non-mutation; positive mutant patients must be tested by PCR amplification of gDNA, and a positive result will be accepted as positive mutation; 3) peak of base group showed a downward tendency in heterozygote when compared the sequencing maps of both heterozygote and homozygote. Abnormal results will be repeated twice to be confirmed.
IV Statistical Analysis
Discrete variables are accurately tested by Fisher. In occasion of abnormal distribution, Mann-Whitney U test will be applied for the comparison of continuous variables and the median of distribution. The affection of clinical prognosis of age, molecular mutation, and other variables is evaluated. Only the patients under routine standard chemical therapy are accepted. Complete remission (CR) is treated as therapeutic effective. Overall survival (OS) is defined as death caused by any reason during the period between the day of the first diagnosis and the day of the last follow up. Disease free survival (DFS) is defined as the time span between CR and detectable relapse or death. Independent prognostic factor of OS and DFS is discussed by multifactor Cox proportional risk regression analysis. The proportional risk hypothesis is based on the multivariate Cox proportional risk regression through pre-regression test of time dependent covariant Cox. Variables include age, leukocyte count as diagnosis, karyotype, mutations of NPM1/ FLT3-ITD, WT1, CEBPA, RUNX1, MLL/ PTD, ASXL1, TET2, IDH2, DNMT3A, and TP53. P<0.05 is considered as statistically significant. All statistical analysis is carried out by SPSS 18.0.
Results
I Comparison of Clinical and Pathological Characteristic Between Older and Younger Patients
217 of the total 427 AML patients are male, 210 are female (Table 1). 156 patients are over 60 years old (older group), with average age of 69.3 (60-90 years old). No significant difference in sex, blood type, and lactic dehydrogenase level exist between older group and younger group (Tables 1 & 2).
Table 1: Clinical features of AML patients stratified by age.
|
|
|
Total(n=427) |
Older patient(n=156) |
Younger patient(n=271) |
P value |
|
Sex |
Male |
217 |
81 |
136 |
0.1923 |
|
|
Female |
210 |
75 |
135 |
|
|
Age |
|
53.2±8.7 |
69.3±5.7 |
41.8±7.4 |
0.2164 |
|
FAB |
M0 |
9 |
5 |
4 |
0.4683 |
|
|
M1 |
110 |
32 |
78 |
0.3272 |
|
|
M2 |
151 |
56 |
95 |
0.1231 |
|
|
M4 |
98 |
37 |
61 |
0.1456 |
|
|
M5 |
30 |
16 |
14 |
0.2783 |
|
|
M6 |
18 |
3 |
15 |
0.3492 |
|
|
Undetermined |
11 |
5 |
6 |
0.4125 |
|
Induction response |
CR |
232 |
31 |
201 |
<0.001 |
|
|
PR/refractory |
58 |
22 |
36 |
0.3472 |
|
|
Induction death |
27 |
15 |
12 |
0.1875 |
|
|
Relapse |
123 |
21 |
102 |
0.3412 |
Table 2: Lab data of AML patients stratified by age.
|
|
|
Mean(n=427) |
Older patient(n=156) |
Younger patient(n=271) |
P value |
|
Lab data |
WBC(/μl) |
20 889 (100–734900) |
21345 (700–738900) |
21 236 (110–535 000) |
0.6751 |
|
|
Hb(g/dl) |
7.9 (3.0–17.0) |
8.2 (3.0–15.0) |
8.0 (3.0–16.0) |
0.4585 |
|
|
Platelet(×1000 /μl) |
42.0 (3.0–950.0) |
43.5 (3.0–625.0) |
44.5 (3.0–756.0) |
0.3456 |
|
|
Blast (/μl) |
8674 (0–512345) |
7568 (0–564135) |
8692 (0–456080) |
0.3934 |
|
|
LDH (U/l) |
837 (240–16 000) |
843 (254.0–16 000) |
905 (250–14500) |
0.5465 |
II Comparison of Cytogenetic Abnormality Between Older Group and Younger Group
Among all, 386 patients’ karyotype data are available, including 143 older patients and 243 younger patients (Table 3). Higher cytogenetic mal-mutation rate was noticed in older group (19.6% vs. 8.6%, P = 0.01), with t (8; 21) (2.8% vs. 15.6%, P<0.001). And higher rates of abnormal of complex chromosomes (13.3% vs. 5.8%, P = 0.002), monosomy 7/7Q deficiency (6.3% vs. 3.3%, P = 0.001), and monosomy 5/5Q deficiency (7.7% vs. 2.1%, P = 0.001) were found in older group, but with a low occurrence of t (7; 11) (0 vs. 2.9%, P = 0.006). No significant difference in simple chromosome abnormality with two or less mutations related to chromosome number 8, 11, 13 and 21 were found between two groups.
Table 3: Association of age with cytogenetic abnormalities.
|
|
|
Total(n=386) |
Older patient(n=143) |
Younger patient(n=243) |
P value |
|
Karyotype |
Favorable |
56 |
6 |
50 |
<0.001 |
|
|
Intermediate |
265 |
112 |
153 |
0.6721 |
|
|
Unfavorable |
61 |
28 |
21 |
0.01 |
|
|
Normal |
191 |
80 |
111 |
0.1250 |
|
|
Simple |
150 |
43 |
107 |
0.0031 |
|
|
Complex |
33 |
19 |
14 |
0.0021 |
|
|
t(8;21) |
42 |
4 |
38 |
<0.001 |
|
|
inv (16) |
15 |
4 |
11 |
0.0489 |
|
|
t(11q23) |
19 |
6 |
13 |
0.0324 |
|
|
t(7;11) |
7 |
0 |
7 |
0.006 |
|
|
− 5/5q − |
14 |
11 |
3 |
0.001 |
|
|
− 7/7q − |
17 |
9 |
8 |
0.001 |
|
|
+8 |
25 |
13 |
12 |
0.3147 |
|
|
+11 |
5 |
3 |
2 |
0.4568 |
|
|
+13 |
3 |
2 |
1 |
0.2314 |
|
|
+21 |
8 |
2 |
6 |
0.1245 |
III Comparison of Molecular Gene Mutations Between Older Group and Younger Group
Complete mutation screening of 21 genes were carried out for the study of difference of gene mutation in the etiopathogenesis of older and younger AML patients. The most common molecular mutations among the population are FLT3/ITD (23.7%), secondly NPM1 (21.8%), DNMT3A (15.0%), TET2 (13.3%), and CEBPA (12.6%). Among older patients, the most common molecular mutations are NPM1 (30.7%), secondly TET2 (26.4%), FLT3 / ITD (23.8%), DNMT3A (21.5%), and RUNX1 (17.2%) (Table 4). Median of diagnosed molecular mutations of older patients is significantly higher than younger patients (2.0 vs. 1.0, P<0.001).
Significant higher mutations rates of PTPN11, NPM1, RUNX1, ASXL1, TET2, DNMT3A, and TP53 were found in older patients compared with younger patients. (7.5% vs. 3.3%, P=0.003; 30.8% vs. 16.2%, P=0.001; 17.0%vs. 11.4%, P=0.008; 19.5% vs. 7.8%, P<0.001; 26.4% vs. 5.5%, P<0.001; 21.4% vs. 11.1%; P=0.002; 15.1% vs. 4.1%, P=0.006). While WT1 mutation was rarely found in older patients over 60 years old (3.1 vs. 8.7%, P=0.005). No significant difference of other genetic alterations was noticed between two groups. The frequency of one or more adverse genetic mutations (including FLT3/ITD, WT1, RUNX1, ASXL1, DNMT3A, and TP53) is higher in older patients (76.3% vs. 45.8%, P<0.001).
Table 4: Distribution of molecular genetic alterations by age.
|
|
|
Patients with alteration(%) |
P value |
||
|
|
|
Whole cohort |
Older patients |
Younger patients |
|
|
FLT3/ITD |
427 |
23.7(101) |
23.9(38) |
23.2(63) |
0.865 |
|
FLT3/TKD |
427 |
7.0(30) |
6.9(11) |
7.0(19) |
0.645 |
|
NRAS |
427 |
13.3(57) |
13.8(22) |
12.9(35) |
0.582 |
|
KRAS |
427 |
3.0(13) |
1.9(3) |
3.7(10) |
0.341 |
|
PTPN11 |
427 |
4.9(21) |
7.5(12) |
3.3(9) |
0.003 |
|
KIT |
427 |
4.7(20) |
4.4(7) |
4.8(13) |
0.423 |
|
JAK2 |
427 |
0.7(3) |
0.6(1) |
0.7(2) |
0.947 |
|
WTI |
427 |
8.0(34) |
3.1(5) |
10.7(29) |
0.0136 |
|
NPM1 |
427 |
21.8(93) |
30.8(49) |
16.2(44) |
0.001 |
|
CEBPA |
427 |
12.6(54) |
5.7(9) |
16.6(45) |
0.0248 |
|
RUNX1 |
427 |
13.6(58) |
17.0(27) |
11.4(31) |
0.008 |
|
MLL/PTD |
427 |
6.3(27) |
5.7(9) |
6.6(18) |
0.458 |
|
ASXL1 |
427 |
12.2(52) |
19.5(31) |
7.8(21) |
P<0.001 |
|
IDH1 |
427 |
5.6(24) |
6.9(11) |
4.8(13) |
0.782 |
|
IDH2 |
427 |
13.1(56) |
16.4(26) |
11.1(30) |
0.241 |
|
TET2 |
427 |
13.3(57) |
26.4(42) |
5.5(15) |
<0.001 |
|
DNMT3A |
427 |
15.0(64) |
21.4(34) |
11.1(30) |
0.002 |
|
TP53 |
427 |
8.2(35) |
15.1(24) |
4.1(11) |
0.006 |
|
Cohesin |
335 |
9.1(39) |
8.8(14) |
9.2(25) |
>0.999 |
IV The Analysis of the Affection of Clinical Prognosis of Gene Mutation in Older Patients by Cox Proportional Risk Model
Cases of standard chemical therapy among older patients were less than younger patients, (61/156, 39.1% vs. 249/271, 91.9%, P<0.001). Within the group, the OS of the patients in standard chemical therapy group was longer than placebo group (median, 11.0 vs. 4.0 months, P<0.001, Figure 1). Among all patients, 310 AML patients were subjected to standard guided remission program, with 232 CR. The CR rate of older group was significantly lower than younger group (19.5% vs. 74.2%, P<0.001, Table 1). In the average 73 months follow up (0.1-180), the OS and DFS of the older group were significantly shorter than younger group (median 11.0 vs. 57.0 months, P<0.001, Figure 2A; median 4.0 vs. 10.0 months, P=0.002, Figure 2B).
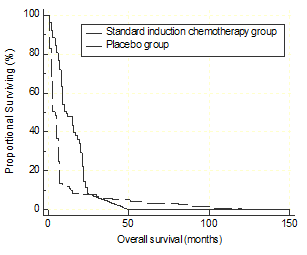
Figure 1: The Kaplan-Meier survival curve for OS in AML patients stratified by having standard induction chemotherapy or not.
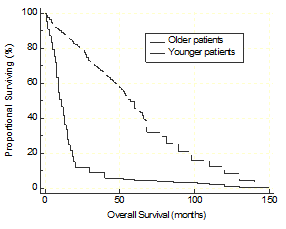
Figure 2A: The Kaplan-Meier survival curve for OS in AML patients stratified by age.
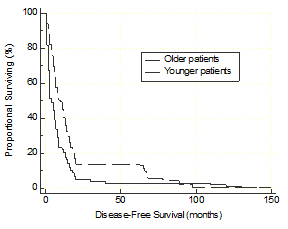
Figure 2B: The Kaplan-Meier survival curve for DFS in AML patients stratified by age.
Age, higher leukocyte count (>450000/μl), and WT1, DNMT3A and TP53 mutations were the adverse prognosis factors revealed by multifactor Cox proportional risk regression analysis among population (Table 5). On the other hand, NPM1+/ FLT3-ITD- and CEBPA double mutation is the independent favorable prognosis factor. DNMT3A and TP53 mutations were independent adverse prognosis factors in the multifactor Cox proportional risk regression analysis of older patients, while NPM1+/ FLT3-ITD- is still a favorable prognosis factor.
Table 5: Multivariable Cox analysis about DFS and OS.
|
|
|
|
DFS |
|
|
|
|
OS |
|
|
|
|
|
PR |
95%CI |
|
P |
|
PR |
95%CI |
|
P |
|
|
|
|
Lower |
Upper |
|
|
|
Lower |
Upper |
|
|
Whole cohort |
Age |
1.486 |
1.023 |
2.314 |
0.002 |
|
2.586 |
1.680 |
3.892 |
0.001 |
|
|
WBC |
1.359 |
1.024 |
2.035 |
0.035 |
|
1.864 |
1.025 |
2.684 |
0.002 |
|
|
Karyotype |
1.567 |
1.068 |
2.984 |
0.028 |
|
1.756 |
0.766 |
3.236 |
0.123 |
|
|
NPM1/FLT3-ITD |
0.246 |
0.168 |
0.650 |
0.006 |
|
0.423 |
0.196 |
0.875 |
0.004 |
|
|
CEBPAdouble-mutation |
0.586 |
0.368 |
0.964 |
0.027 |
|
0.489 |
0.203 |
0.965 |
0.013 |
|
|
RUNX1 |
1.698 |
1.123 |
2.645 |
0.034 |
|
1.796 |
0.864 |
3.125 |
0.059 |
|
|
WT1 |
1.975 |
1.238 |
2.941 |
0.003 |
|
1.925 |
1.029 |
3.258 |
0.042 |
|
|
ASXL1 |
0.998 |
0.621 |
1.789 |
0.758 |
|
1.368 |
0.843 |
2.465 |
0.458 |
|
|
TET2 |
0.996 |
0.635 |
1.645 |
0.861 |
|
1.241 |
0.639 |
1.963 |
0.923 |
|
|
IDH2 |
0.842 |
0.523 |
1.321 |
0.346 |
|
0.654 |
0.351 |
0.944 |
0.013 |
|
|
MLL/PTD |
1.456 |
0.764 |
2.415 |
0.402 |
|
1.325 |
0.582 |
3.359 |
0.421 |
|
|
DNMT3A |
2.014 |
1.314 |
3.014 |
0.001 |
|
2.011 |
1.214 |
3.684 |
<0.001 |
|
|
TP53 |
2.358 |
1.216 |
5.240 |
0.019 |
|
4.982 |
2.017 |
12.092 |
0.001 |
|
Older patients |
|
|
|
|
|
|
|
|
|
|
|
|
WBC |
1.568 |
0.741 |
3.125 |
0.359 |
|
1.945 |
0.782 |
4.285 |
0.123 |
|
|
Karyotype |
0.895 |
0.362 |
3.147 |
0.978 |
|
1.456 |
0.634 |
5.369 |
0.345 |
|
|
NPM1/FLT3-ITD |
0.457 |
0.158 |
1.235 |
0.056 |
|
0.365 |
0.064 |
0.865 |
0.012 |
|
|
CEBPAdouble-mutation |
0.968 |
0.403 |
2.645 |
0.752 |
|
0.571 |
0.150 |
2.654 |
0.356 |
|
|
RUNX1 |
0.965 |
0.456 |
3.687 |
0.552 |
|
1.842 |
0.531 |
4.026 |
0.341 |
|
|
ASXL1 |
1.532 |
0.642 |
3.452 |
0.769 |
|
1.365 |
0.511 |
3.684 |
0.765 |
|
|
TET2 |
1.245 |
0.513 |
2.065 |
0.652 |
|
1.055 |
0.523 |
2.658 |
0.954 |
|
|
IDH2 |
0.965 |
0.180 |
1.245 |
0.069 |
|
0.358 |
0.160 |
1.482 |
0.116 |
|
|
MLL/PTD |
1.647 |
0.597 |
4.639 |
0.486 |
|
2.349 |
0.698 |
9.621 |
0.095 |
|
|
DNMT3A |
1.769 |
0.860 |
3.564 |
0.235 |
|
3.158 |
1.356 |
8.032 |
0.002 |
|
|
TP53 |
2.325 |
0.652 |
10.451 |
0.368 |
|
4.024 |
1.023 |
18.456 |
0.032 |
V Kaplan-Meier Survival Analysis
During the long term follow up post treatment, life quality of the patients with any genetic mutation was worse than those of no genetic mutation (including FLT3/ITD, DNMT3A or TP53). OS and PFS were longer in non-gene mutation group than adverse gene mutation group (median 68.0 vs. 14.0 months, P=0.003, Figure 3A, median 16.0 vs. 6.0 months, P=0.004, Figure 3B). survival rate in non-gene mutation group was significantly higher than adverse gene mutation group after the Log-rank test through Kaplan-Meier survival analysis (χ2=49.7.1, P<0.001; χ2=39.1, P< 0.0001) (Figure 3).
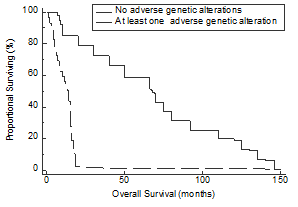
Figure 3A: The Kaplan-Meier survival curve for OS in AML patients stratified by having adverse genetic alterations or not.
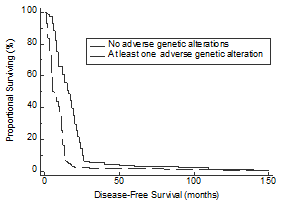
Figure 3B: The Kaplan-Meier survival curve for DFS in AML patients stratified by having adverse genetic alterations or not.
Discussion
Most patients in the studies regarding the prognosis factors of AML were of younger age with less complications and good clinical status, which would be inappropriately to represent all AML patients. In this study, we didn’t set age limitation for the analysis of first diagnosed AML patients, thus compared the difference in gene mutations between older and younger patients and discussed the clinical significance. We found obvious characteristics in clinical biology and genetic mutation of aged patients which predict the prognosis of these patients.
Karyotype is the most powerful prognosis factor of AML. Aged patients accompanied by a higher frequency of cytogenetic adverse risk, such as complex chromosome abnormal or chromosome number 5 and 7 mutation, but abnormal of core-binding factor was rarely seen. For a better risk classification of aged AML patients, ELN professors in Europe first provided the standard classification procedure based on cytogenetics and three gene molecule mutations (FLT3/ITD, NPM1 and CEBPA) [4]. And other related genes were also brought into consideration in the risk classification of AML patients. But the studies about molecular changes and clinical significance of aged AML patients are very limited till now. Adverse prognosis factors RUNX1 and SXL1 gene mutations are more common in aged AML patients with normal cytogenetics. OS is shorter in aged patients with WT1 or TP53 mutations, while CR and OS are better in patients with NPM149 mutation. Ostronlff et al. found that NPM1 mutation contributed to the survival of patients between 55-65 years old who without FLT3/ITD mutation but showed no effect on patients over 65 [30].
This report thoroughly studied 21 gene molecular genetic mutations of aged non-M3 AML patients. We firstly provided the distribution of genetic changes and different results of gene mutations in different age groups of patients. Secondly, the mutation rate of PTPN11, NPM1, RUNX1, ASXL1, TET2, DNMT3A and TP53 was higher in aged patients, while the mutation rate of WT1 was lower. Most gene mutations were more common in aged patients followed by adverse prognosis with the exception of NPM1 mutation. Besides, one or more adverse genetic changes (including FLT3/ITD, WT1, RUNX1, ASXL1, DNMT3A and TP53) were of higher frequency in older patients than younger patients. Not only the higher adverse cytogenetic frequency, aged patients also faced a higher gene mutation rate and adverse prognosis related molecular genetic mutations which unsatisfactory clinical results. Another reason is that they are more prone to the toxic effect of the chemical therapy agent and suffer a higher mortality rate. Taken together, aged AML patients have more obvious clinical biology characteristics, and higher frequency of high risk cytogenetic and gene mutation, with worse prognosis. Integration of cytogenetics and molecular mutation may contribute to the classification of aged patients by different results and risks. This study is of great value for the development of new therapy and the improvement of clinical results of aged patients with adverse prognosis.
Acknowledgments
This work was supported by the National Natural Sciences Foundation of China (No.81670196) and Nantong Science and Technology Project (HS2019003).
Article Info
Article Type
Research ArticlePublication history
Received: Thu 13, Aug 2020Accepted: Wed 21, Oct 2020
Published: Fri 06, Nov 2020
Copyright
© 2023 Xiaohong Xu. This is an open-access article distributed under the terms of the Creative Commons Attribution License, which permits unrestricted use, distribution, and reproduction in any medium, provided the original author and source are credited. Hosting by Science Repository.DOI: 10.31487/j.COR.2020.09.02
Figures & Tables
Table 1: Clinical features of AML patients stratified by age.
|
|
|
Total(n=427) |
Older patient(n=156) |
Younger patient(n=271) |
P value |
|
Sex |
Male |
217 |
81 |
136 |
0.1923 |
|
|
Female |
210 |
75 |
135 |
|
|
Age |
|
53.2±8.7 |
69.3±5.7 |
41.8±7.4 |
0.2164 |
|
FAB |
M0 |
9 |
5 |
4 |
0.4683 |
|
|
M1 |
110 |
32 |
78 |
0.3272 |
|
|
M2 |
151 |
56 |
95 |
0.1231 |
|
|
M4 |
98 |
37 |
61 |
0.1456 |
|
|
M5 |
30 |
16 |
14 |
0.2783 |
|
|
M6 |
18 |
3 |
15 |
0.3492 |
|
|
Undetermined |
11 |
5 |
6 |
0.4125 |
|
Induction response |
CR |
232 |
31 |
201 |
<0.001 |
|
|
PR/refractory |
58 |
22 |
36 |
0.3472 |
|
|
Induction death |
27 |
15 |
12 |
0.1875 |
|
|
Relapse |
123 |
21 |
102 |
0.3412 |
Table 2: Lab data of AML patients stratified by age.
|
|
|
Mean(n=427) |
Older patient(n=156) |
Younger patient(n=271) |
P value |
|
Lab data |
WBC(/μl) |
20 889 (100–734900) |
21345 (700–738900) |
21 236 (110–535 000) |
0.6751 |
|
|
Hb(g/dl) |
7.9 (3.0–17.0) |
8.2 (3.0–15.0) |
8.0 (3.0–16.0) |
0.4585 |
|
|
Platelet(×1000 /μl) |
42.0 (3.0–950.0) |
43.5 (3.0–625.0) |
44.5 (3.0–756.0) |
0.3456 |
|
|
Blast (/μl) |
8674 (0–512345) |
7568 (0–564135) |
8692 (0–456080) |
0.3934 |
|
|
LDH (U/l) |
837 (240–16 000) |
843 (254.0–16 000) |
905 (250–14500) |
0.5465 |
Table 3: Association of age with cytogenetic abnormalities.
|
|
|
Total(n=386) |
Older patient(n=143) |
Younger patient(n=243) |
P value |
|
Karyotype |
Favorable |
56 |
6 |
50 |
<0.001 |
|
|
Intermediate |
265 |
112 |
153 |
0.6721 |
|
|
Unfavorable |
61 |
28 |
21 |
0.01 |
|
|
Normal |
191 |
80 |
111 |
0.1250 |
|
|
Simple |
150 |
43 |
107 |
0.0031 |
|
|
Complex |
33 |
19 |
14 |
0.0021 |
|
|
t(8;21) |
42 |
4 |
38 |
<0.001 |
|
|
inv (16) |
15 |
4 |
11 |
0.0489 |
|
|
t(11q23) |
19 |
6 |
13 |
0.0324 |
|
|
t(7;11) |
7 |
0 |
7 |
0.006 |
|
|
− 5/5q − |
14 |
11 |
3 |
0.001 |
|
|
− 7/7q − |
17 |
9 |
8 |
0.001 |
|
|
+8 |
25 |
13 |
12 |
0.3147 |
|
|
+11 |
5 |
3 |
2 |
0.4568 |
|
|
+13 |
3 |
2 |
1 |
0.2314 |
|
|
+21 |
8 |
2 |
6 |
0.1245 |
Table 4: Distribution of molecular genetic alterations by age.
|
|
|
Patients with alteration(%) |
P value |
||
|
|
|
Whole cohort |
Older patients |
Younger patients |
|
|
FLT3/ITD |
427 |
23.7(101) |
23.9(38) |
23.2(63) |
0.865 |
|
FLT3/TKD |
427 |
7.0(30) |
6.9(11) |
7.0(19) |
0.645 |
|
NRAS |
427 |
13.3(57) |
13.8(22) |
12.9(35) |
0.582 |
|
KRAS |
427 |
3.0(13) |
1.9(3) |
3.7(10) |
0.341 |
|
PTPN11 |
427 |
4.9(21) |
7.5(12) |
3.3(9) |
0.003 |
|
KIT |
427 |
4.7(20) |
4.4(7) |
4.8(13) |
0.423 |
|
JAK2 |
427 |
0.7(3) |
0.6(1) |
0.7(2) |
0.947 |
|
WTI |
427 |
8.0(34) |
3.1(5) |
10.7(29) |
0.0136 |
|
NPM1 |
427 |
21.8(93) |
30.8(49) |
16.2(44) |
0.001 |
|
CEBPA |
427 |
12.6(54) |
5.7(9) |
16.6(45) |
0.0248 |
|
RUNX1 |
427 |
13.6(58) |
17.0(27) |
11.4(31) |
0.008 |
|
MLL/PTD |
427 |
6.3(27) |
5.7(9) |
6.6(18) |
0.458 |
|
ASXL1 |
427 |
12.2(52) |
19.5(31) |
7.8(21) |
P<0.001 |
|
IDH1 |
427 |
5.6(24) |
6.9(11) |
4.8(13) |
0.782 |
|
IDH2 |
427 |
13.1(56) |
16.4(26) |
11.1(30) |
0.241 |
|
TET2 |
427 |
13.3(57) |
26.4(42) |
5.5(15) |
<0.001 |
|
DNMT3A |
427 |
15.0(64) |
21.4(34) |
11.1(30) |
0.002 |
|
TP53 |
427 |
8.2(35) |
15.1(24) |
4.1(11) |
0.006 |
|
Cohesin |
335 |
9.1(39) |
8.8(14) |
9.2(25) |
>0.999 |
Table 5: Multivariable Cox analysis about DFS and OS.
|
|
|
|
DFS |
|
|
|
|
OS |
|
|
|
|
|
PR |
95%CI |
|
P |
|
PR |
95%CI |
|
P |
|
|
|
|
Lower |
Upper |
|
|
|
Lower |
Upper |
|
|
Whole cohort |
Age |
1.486 |
1.023 |
2.314 |
0.002 |
|
2.586 |
1.680 |
3.892 |
0.001 |
|
|
WBC |
1.359 |
1.024 |
2.035 |
0.035 |
|
1.864 |
1.025 |
2.684 |
0.002 |
|
|
Karyotype |
1.567 |
1.068 |
2.984 |
0.028 |
|
1.756 |
0.766 |
3.236 |
0.123 |
|
|
NPM1/FLT3-ITD |
0.246 |
0.168 |
0.650 |
0.006 |
|
0.423 |
0.196 |
0.875 |
0.004 |
|
|
CEBPAdouble-mutation |
0.586 |
0.368 |
0.964 |
0.027 |
|
0.489 |
0.203 |
0.965 |
0.013 |
|
|
RUNX1 |
1.698 |
1.123 |
2.645 |
0.034 |
|
1.796 |
0.864 |
3.125 |
0.059 |
|
|
WT1 |
1.975 |
1.238 |
2.941 |
0.003 |
|
1.925 |
1.029 |
3.258 |
0.042 |
|
|
ASXL1 |
0.998 |
0.621 |
1.789 |
0.758 |
|
1.368 |
0.843 |
2.465 |
0.458 |
|
|
TET2 |
0.996 |
0.635 |
1.645 |
0.861 |
|
1.241 |
0.639 |
1.963 |
0.923 |
|
|
IDH2 |
0.842 |
0.523 |
1.321 |
0.346 |
|
0.654 |
0.351 |
0.944 |
0.013 |
|
|
MLL/PTD |
1.456 |
0.764 |
2.415 |
0.402 |
|
1.325 |
0.582 |
3.359 |
0.421 |
|
|
DNMT3A |
2.014 |
1.314 |
3.014 |
0.001 |
|
2.011 |
1.214 |
3.684 |
<0.001 |
|
|
TP53 |
2.358 |
1.216 |
5.240 |
0.019 |
|
4.982 |
2.017 |
12.092 |
0.001 |
|
Older patients |
|
|
|
|
|
|
|
|
|
|
|
|
WBC |
1.568 |
0.741 |
3.125 |
0.359 |
|
1.945 |
0.782 |
4.285 |
0.123 |
|
|
Karyotype |
0.895 |
0.362 |
3.147 |
0.978 |
|
1.456 |
0.634 |
5.369 |
0.345 |
|
|
NPM1/FLT3-ITD |
0.457 |
0.158 |
1.235 |
0.056 |
|
0.365 |
0.064 |
0.865 |
0.012 |
|
|
CEBPAdouble-mutation |
0.968 |
0.403 |
2.645 |
0.752 |
|
0.571 |
0.150 |
2.654 |
0.356 |
|
|
RUNX1 |
0.965 |
0.456 |
3.687 |
0.552 |
|
1.842 |
0.531 |
4.026 |
0.341 |
|
|
ASXL1 |
1.532 |
0.642 |
3.452 |
0.769 |
|
1.365 |
0.511 |
3.684 |
0.765 |
|
|
TET2 |
1.245 |
0.513 |
2.065 |
0.652 |
|
1.055 |
0.523 |
2.658 |
0.954 |
|
|
IDH2 |
0.965 |
0.180 |
1.245 |
0.069 |
|
0.358 |
0.160 |
1.482 |
0.116 |
|
|
MLL/PTD |
1.647 |
0.597 |
4.639 |
0.486 |
|
2.349 |
0.698 |
9.621 |
0.095 |
|
|
DNMT3A |
1.769 |
0.860 |
3.564 |
0.235 |
|
3.158 |
1.356 |
8.032 |
0.002 |
|
|
TP53 |
2.325 |
0.652 |
10.451 |
0.368 |
|
4.024 |
1.023 |
18.456 |
0.032 |
References
- Howlader N, A Noone, M Krapcho (2013) SEER cancer statistics review, 1975-2010. Bethesda, MD: National Cancer Institute.
- Burnett A, Wetzler M, Löwenberg B (2011) Therapeutic advances in acute myeloid leukemia. J Clin Oncol 29: 487-494. [Crossref]
- Appelbaum FR, Gundacker H, Head DR, Slovak ML, Willman CL et al. (2006) Age and acute myeloid leukemia. Blood 107: 3481-3485. [Crossref]
- Döhner H, Estey EH, Amadori S, Appelbaum FR, Büchner T et al. (2010) Diagnosis and management of acute myeloid leukemia in adults: recommendations from an international expert panel, on behalf of the European Leukemia Net. Blood 115: 453-474. [Crossref]
- Grimwade D, Hills RK, Moorman AV, Walker H, Chatters S et al. (2010) Refinement of cytogenetic classification in acute myeloid leukemia: determination of prognostic significance of rare recurring chromosomal abnormalities among 5876 younger adult patients treated in the United Kingdom Medical Research Council trials. Blood 116: 354-365. [Crossref]
- Mendler JH, Maharry K, Radmacher MD, Mrózek K, Becker H et al. (2012) RUNX1 mutations are associated with poor outcome in younger and older patients with cytogenetically normal acute myeloid leukemia and with distinct gene and MicroRNA expression signatures. J Clin Oncol 30: 3109-3118. [Crossref]
- Ley TJ, Ding L, Walter MJ, McLellan MD, Lamprecht T et al. (2010) DNMT3A mutations in acute myeloid leukemia. New Engl J Med 363: 2424-2433. [Crossref]
- Hou HA, Kuo YY, Liu CY, Chou WC, Lee MC et al. (2012) DNMT3A mutations in acute myeloid leukemia: stability during disease evolution and clinical implications. Blood 119: 559-568. [Crossref]
- Metzeler KH, Becker H, Maharry K, Radmacher MD, Kohlschmidt J et al. (2011) ASXL1 mutations identify a high-risk subgroup of older patients with primary cytogenetically normal AML within the ELN Favorable genetic category. Blood 118: 6920-6929. [Crossref]
- Green CL, Evans CM, Zhao L, Hills RK, Burnett AK et al. (2011) The prognostic significance of IDH2 mutations in AML depends on the location of the mutation. Blood 118: 409-412. [Crossref]
- Marcucci G, Maharry K, Wu YZ, Radmacher MD, Mrózek K et al. (2010) IDH1 and IDH2 gene mutations identify novel molecular subsets within de novo cytogenetically normal acute myeloid leukemia: a Cancer and Leukemia Group B study. J Clin Oncol 28: 2348-2355. [Crossref]
- Hou H, Lin C, Chou W, Liu C, Chen C et al. (2014) Integration of cytogenetic and molecular alterations in risk stratification of 318 patients with de novo non-M3 acute myeloid leukemia. Leukemia 28: 50-58. [Crossref]
- Schlenk RF, Döhner K, Krauter J, Fröhling S, Corbacioglu A et al. (2008) Mutations and treatment outcome in cytogenetically normal acute myeloid leukemia. New Engl J Med 358: 1909-1918. [Crossref]
- Paschka P, Marcucci G, Ruppert AS, Whitman SP, Mrózek K et al. (2008) Wilms’ tumor 1 gene mutations independently predict poor outcome in adults with cytogenetically normal acute myeloid leukemia: a cancer and leukemia group B study. J Clin Oncol 26: 4595-4602. [Crossref]
- Tang JL, Hou HA, Chen CY, Liu CY, Chou WC et al. (2009) AML1/RUNX1 mutations in 470 adult patients with de novo acute myeloid leukemia: prognostic implication and interaction with other gene alterations. Blood 114: 5352-5361. [Crossref]
- Hou HA, Tien HF (2016) Mutations in epigenetic modifiers in acute myeloid leukemia and their clinical utility. Expert Rev Hematol 9: 447-469. [Crossref]
- Chou SC, Tang JL, Hou HA, Chou WC, Hu FC et al. (2014) Prognostic implication of gene mutations on overall survival in the adult acute myeloid leukemia patients receiving or not receiving allogeneic hematopoietic stem cell transplantations. Leuk Res 38: 1278-1284. [Crossref]
- Chou WC, Hou HA, Liu CY, Chen CY, Lin LI et al. (2011) Sensitive measurement of quantity dynamics of FLT3 internal tandem duplication at early time points provides prognostic information. Ann Oncol 22: 696-704. [Crossref]
- Bacher U, Haferlach C, Kern W, Haferlach T, Schnittger S (2008) Prognostic relevance of FLT3-TKD mutations in AML: the combination matters—an analysis of 3082 patients. Blood 111: 2527-2537. [Crossref]
- Hou HA, Kuo YY, Tang JL, Chou WC, Yao M et al. (2014) Clinical implications of the SETBP1 mutation in patients with primary myelodysplastic syndrome and its stability during disease progression. Am J Hematol 89: 181-186. [Crossref]
- Hou H, Chou W, Lin L, Chen CY, Tang JL et al. (2008) Characterization of acute myeloid leukemia with PTPN11 mutation: the mutation is closely associated with NPM1 mutation but inversely related to FLT3/ITD. Leukemia 22: 1075-1078. [Crossref]
- Lin LI, Chen CY, Lin DT, Tsay W, Tang JL et al. (2005) Characterization of CEBPA mutations in acute myeloid leukemia: most patients with CEBPA mutations have biallelic mutations and show a distinct immunophenotype of the leukemic cells. Clin Cancer Res 11: 1372- 1379. [Crossref]
- Hou HA, Huang TC, Lin LI, Liu CY, Chen CY et al. (2010) WT1 mutation in 470 adult patients with acute myeloid leukemia: stability during disease evolution and implication of its incorporation into a survival scoring system. Blood 115: 5222-5231. [Crossref]
- Hou HA, Chou WC, Kuo YY, Liu CY, Lin LI et al. (2015) TP53 mutations in de novo acute myeloid leukemia patients: longitudinal follow-ups show the mutation is stable during disease evolution. Blood Cancer J 5: e331. [Crossref]
- Thol F, Bollin R, Gehlhaar M, Walter C, Dugas M et al. (2014) Mutations in the cohesin complex in acute myeloid leukemia: clinical and prognostic implications. Blood 123: 914-920. [Crossref]
- Chen TC, Hou HA, Chou WC, Tang JL, Kuo YY et al. (2014) Dynamics of ASXL1 mutation and other associated genetic alterations during disease progression in patients with primary myelodysplastic syndrome. Blood Cancer J 4: e177. [Crossref]
- Lin CC, Hou HA, Chou WC, Kuo YY, Liu CY et al. (2014) IDH mutations are closely associated with mutations of DNMT3A, ASXL1 and SRSF2 in patients with myelodysplastic syndromes and are stable during disease evolution. Am J Hematol 89: 137-144. [Crossref]
- Chou W, Lei W, Ko B, Hou HA, Chen CY et al. (2011) The prognostic impact and stability of Isocitrate dehydrogenase 2 mutation in adult patients with acute myeloid leukemia. Leukemia 25: 246-253. [Crossref]
- Chou WC, Chou SC, Liu CY, Chen CY, Hou HA et al. (2011) TET2 mutation is an unfavorable prognostic factor in acute myeloid leukemia patients with intermediate-risk cytogenetics. Blood 118: 3803-3810. [Crossref]
- Ostronoff F, Othus M, Lazenby M, Estey E, Appelbaum FR et al. (2015) Prognostic significance of NPM1 mutations in the absence of FLT3-internal tandem duplication in older patients with acute myeloid leukemia: a SWOG and UK National Cancer Research Institute/Medical Research Council report. J Clin Oncol 33: 1157-1164. [Crossref]