Journals
Feasibility of sagittal T2 mapping of the median nerve in patients with carpal tunnel syndrome
A B S T R A C T
Purpose: To evaluate patients with carpal tunnel syndrome (CTS) by using 3-Tesla magnetic resonance imaging (MRI) sagittal T2 mapping of the median nerve for localization of abnormal regions. Material and Methods: Nine hands of seven patients with CTS and five hands of five healthy volunteers were evaluated using sagittal T2 mapping and axial spoiled gradient-echo (SPGR) images. Three regions of interest (ROIs) at the carpal tunnel (ROI-1 to ROI-3) and one control ROI distal to the carpal tunnel (ROI-C) were defined on the median nerve and T2-ratios at ROI-1 to ROI-3 relative to ROI-C were calculated. The flattening ratio (F-ratio; width/height of the median nerve) was also calculated from the axial SPGR images. Results: On sagittal T2 mapping, the medial nerve of normal volunteers showed constant T2 values at all ROIs. In the patients with CTS, there was large variation in T2 among the ROIs and the region of highest T2 value varied among the patients. T2-ratios at ROI-2 and -3 and the F-ratios along all carpal tunnel levels were significantly higher in the patients with CTS than in the normal volunteers. A significant correlation was found between terminal latency and T2-ratio at ROI-2 but not between terminal latency and F-ratio. Conclusion: Sagittal T2 mapping was feasible for the localization of abnormal T2 regions of the median nerve in patients with CTS.
K E Y W O R D S
carpal tunnel syndrome, median nerve, magnetic resonance imaging, diagnosis, clinical study
I N T R O D U C T I O N
The diagnosis of carpal tunnel syndrome (CTS) has been generally based on clinical features and electrophysiological data; however, localization of the entrapment point in the median nerve and quantification of the severity of the disease has been difficult. Recent advanced magnetic resonance (MR) imaging technology with the use of dedicated microscopy coils has provided high-resolution axial images of the wrist, allowed detailed morphological assessment regarding thickness, the cross-sectional area of the median nerve and has allowed bowing of the flexor retinaculum [1-8]. Although some relationships between those measurements and clinical symptoms have been shown in previous studies, accurate detection of abnormal regions along the median nerve has remained difficult.
Regarding the quantification of signal intensity, measurement of the T2 relaxation time (T2 time) in MR imaging can potentially be used for quantitative evaluation of neuropathy associated with change in fluid dynamics and water content as well as providing sensitive detection of localized abnormal regions adjacent to normal nerve regions [9]. Thus, T2 mapping of nerves may be more sensitive to changes in the chemical composition of the nerve tissue associated with CTS than is morphological MR imaging. The clinical usefulness of T2 mapping has been shown in assessments of the articular cartilage, spinal intervertebral disc and Achilles tendon [10-12]. Although T2 mapping of the median nerve in the axial plane has been reported before, the one in the sagittal direction, which is considered more helpful to localize the most severely damaged nerve region, has never been investigated [13].
The purpose of this study was to evaluate the feasibility of T2 mapping of the median nerve in the sagittal plane along the nerve in patients with CTS.
Material and Methods
Study Population
Nine wrists in seven consecutive patients with electrophysiological evidence of CTS and five wrists in five healthy volunteers were studied. In all patients, full clinical and electrophysiological examination was performed within 1 month before MR imaging examination. The average terminal latency of patients on electrophysiological examinations was 7.6 ms (range, 4.5–12.3 ms), which was longer than the generally accepted normal range (< 4.5 ms) [14]. Five patients had unilateral and two patients had bilateral involvement of CTS. All patients and healthy volunteers were female and the mean age was 60.3 years (range, 35–83 years) and 42.4 years (range, 27–61 years), respectively. There was no significant difference in age between patients and volunteers. Staging of CTS was performed for patients according to the scale proposed by Gelberman et al., as follows: Stage 1 (early CTS) - duration of symptoms < 1 year, no permanent sensory deficit and nerve conduction velocity prolonged by < 2 ms; Stage 2 (intermediate CTS) - permanent paresthesia or numbness and motor latency >3.8 ms; and Stage 3 (advanced CTS) - loss of sensory and/or motor function along with thenar atrophy [15, 16]. All cases had no history of fracture or surgery in the wrist. Seven right wrists and two left wrists were examined. The volunteers had no history of hand numbness or wrist pain and had never undergone hand surgery. All volunteers also received electrophysiological examination and showed the average terminal latency of 2.9 ms (range, 2.8–3.1 m/sec). Four right wrists and one left wrist were examined.
The present study was approved by our institutional review board (No. 08002). All subjects provided informed consent after receiving an explanation of the nature and procedures of the study. The procedures followed were in accordance with the ethical standards of the responsible committee on human experimentation (institutional and national) and with the Helsinki Declaration of 1975, as revised in 2000
MR Imaging
MR imaging was performed on a 3.0-T MR imaging system (General Electric Signa HDx 3.0T scanner; Milwaukee, WI) using a dedicated microscopy surface single-channel coil (50-mm diameter) fixed onto the palmar aspect of the wrist with the patients in the prone position. During image acquisition, the arm was elevated and extended overhead with the forearm in the neutral position and fingers in extension.
After obtaining coronal and axial localizing images, sagittal 2D fast spoiled gradient-echo (SPGR) images (repetition time/echo time, 34/8.9 ms; field of view, 8 cm; matrix, 512 × 512, slice thickness, 2 mm; signal averaging, 5) and sagittal 2D multiple spin-echo images (repetition time, 1500 ms; 8 echoes between 12.9 ms and 103.6 ms; field of view, 8 cm; matrix, 384 × 256; slice thickness, 1 mm; signal averaging, 2) for nerve T2 mapping along the median nerve was acquired (Fig. 1). The axial 2D fast SPGR images (repetition time/echo time, 34/8.9 ms; field of view, 8 cm; matrix, 512 × 512, slice thickness, 2 mm; signal averaging, 5) perpendicular to the sagittal image of the median nerve were obtained from the distal radius beyond the carpal-metacarpal joint.
Data Analysis
Data were analysed using software we developed (Baum version 1.00; Osaka University, Japan). The sagittal T2 map of the median nerve was generated using a single exponential fit from the 2D multiple spin-echo images [17-19]. The median nerve was manually segmented by referring to the intensity profile curve along the median nerve and three regions of interest (ROIs) at the carpal tunnel areas and one control ROI distal to the carpal tunnel area with equal length were defined as follows (Figs. 1A–D). In the carpal tunnel, we identified the level of entrance (L1) as the hook of hamate level and the exit (L3) as the middle of the pisiformis [7]. Between L1 and L3, three ROIs (ROI-1 to ROI-3) with equal length were automatically defined and ROI-C was defined as distal to the carpal tunnel area with equal length. A colour-coded T2 map of the nerve was overlaid on the original mid-sagittal image corresponding to the first echo of the multi echo series. The T2-ratio at ROI-1 to ROI-3 was calculated by dividing the T2 value at each ROI by the T2 value at ROI-C.
The morphological shape of the median nerve was evaluated on three axial 2D fast SPGR images at L1, L3 and L2, which was the middle level of L1 and L3 (Fig. 1D). By using DICOM (digital imaging and communication in medicine) viewer software (Santesoft; Athens, Greece), the flattening ratio (F-ratio) was calculated by the maximal width divided by the height at these three levels (Fig. 2) [7, 8, 15, 20].
Intraclass and interclass correlation coefficients were used to assess intraobserver and interobserver reliability. To examine intraobserver reliability, the T2-ratio at each ROI and F-ratio at each level were measured twice by a single observer (Y.T.) at an interval of 3 weeks and the coefficient of variation (standard deviation / mean ×100 [%]) was calculated in all cases. To examine interobserver reliability, the T2-ratio at each ROI and the F-ratio at each level were measured independently by two observers (Y.T. and T.S.). The reliability was rated as ‘acceptable’ if the result was ≥0.80 [21]. The intraobserver reliabilities for the T2-ratio were 0.89 at ROI-1, 0.98 at ROI-2 and 0.95 at ROI-3 and those for the F-ratio were 0.85 at L1, 0.85 at L2 and 0.85 at L3. The interobserver reliabilities for the T2-ratio were 0.92 at ROI-1, 0.95 at ROI-2 and 0.92 at ROI-3 and those for the F-ratio were 0.83 at L1, 0.83 at L2 and 0.84 at L3.
Statistical Analysis
Differences in the T2-ratio among the three ROIs and F-ratio among the three levels were examined by using Tukey’s test. Differences in the T2-ratio and F-ratio between the volunteers and patients were examined using the nonparametric Mann–Whitney U-test. Correlations between the terminal latency and the T2-ratio at the three ROIs or F-ratio at the three levels were examined by using Pearson’s correlation coefficient. All statistical examinations were performed by using a dedicated statistical package (SPSS 17 for Windows, SPSS Inc., Chicago, IL). A p value < 0.05 was considered to indicate statistical significance.
Results
Clinically, nine wrists of seven patients were Stage 3 and two wrists were Stage 1 on the Gelberman scale. On sagittal T2 mapping, there were large individual variations in the absolute T2 value of the medial nerve among the normal volunteers, ranging from 30 ms to 50 ms at all ROIs. However, a constant T2-ratio was observed among all volunteers, ranging from 0.9 to 1.1 at ROI-1, from 0.9 to 1.0 at ROI-2 and from 0.9 to 1.1 at ROI-3, which indicated that similar T2 values were shown at ROI-1, 2, 3 and C for each volunteer. There were no significant differences in the T2- ratio among ROI-1, 2 and 3 (p = 0.635 to 0.890). For patients, a relatively large variation in the T2-ratio was seen among the ROIs, ranging from 1.0 to 1.5 at ROI-1, from 1.1 to 1.4 at ROI-2 and from 1.0 to 1.3 at ROI-3. The regions of maximal T2-ratio varied among the patients and were ROI-1 in two hands, ROI-2 in four hands and ROI-3 in two hands. One hand had a region of maximal T2-ratio at ROI-1 and ROI-2 (Fig. 3). In only one case, the T2-ratio was constantly high at all ROIs (Case 12, T2-ratio in all ROI = 1.3). There were no significant differences in the T2- ratio among ROI-1, 2 and 3 (p = 0.767 to 0.935). The T2-ratio at ROI-2 and 3 of patients were significantly higher than those in the normal group (p = 0.001 and 0.012, respectively) but not at ROI-1 (p=0.112) (Table 1, Fig. 4).
On axial images, the normal volunteers tended to show a round shape of the median nerve, whereas the CTS patients showed a flat shape of the median nerve along all levels of the carpal tunnel (Table 1, Fig. 2). The F-ratios were significantly higher for the patients than for the normal group at all levels (p= 0.012 for level 1, 0.002 for level 2 and 0.002 for level 3. Table 1, Fig. 5).
There was a significant correlation between terminal latency and the T2-ratio at ROI-2 (R=0.624, p=0.040) but not between terminal latency and the T2-ratio at ROI-1 or ROI-3 (R=0.334, p=0.315 and R=0.490, p=0.126, respectively). There was no significant correlation between terminal latency and F-ratio at all levels (R=0.234, p=0.488 at L1, R=0.289, p=0.389 at L2 and R=0.579, p=0.052).
Figures & Tables

Figure 1: - Steps in image acquisition and analysis. On the first scout locator of a coronal image.
(A) the oblique line (yellow dots line) was defined along the median nerve. On the second scout locator of multiple axial images (B) perpendicular to the aforementioned oblique line, the next imaging plane in the midst of the median nerve was defined (yellow dots line) and sagittal 2D SPGR images and multiple spin echo images of the median nerve from the distal radius beyond the carpal-metacarpal joint (C) were obtained to generate nerve T2 mapping. Three regions of interest (ROI-1 to ROI-3) at the carpal tunnel area and one control ROI (ROI-C) distal to the carpal tunnel area were defined for calculation of nerve T2 values (D). Three high-resolution axial SPGR images (L1 to L3) perpendicular to the sagittal image were obtained to evaluate the morphological shape of the median nerve.
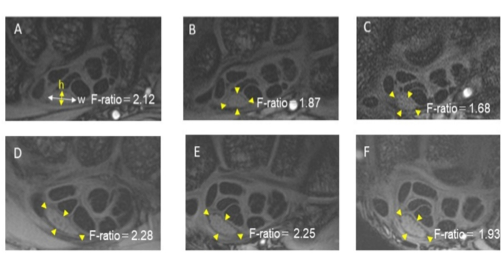
Figure 2: - Representative axial SPGR images. A–C; 27-year-old normal volunteer (A: L1, B: L2, C: L3). D–F; 35-year-old patient with CTS (D: L1, E: L2, F: L3). The flattening ratio (F-ratio) was calculated as the width (w) divided by the height (h) of the median nerve. Yellow arrowheads surround the median nerve.

Figure 3: - Representative mid-sagittal MR T2 mapping images of a normal volunteer and patients. Low T2 values are coloured in green or blue, whereas high T2 values are coloured in red. (A) 27-year-old female. A normal volunteer; the medial nerve showing relatively constant T2 values at all ROIs. (B) 50-year-old female. Patient with stage 3 CTS; high T2-ratio between ROI-2 and ROI-3. (C) 35-year-old female. Patient with stage 3 CTS; high T2-ratio at ROI-1. (D) 80-year-old female. Patient with stage 3 CTS; high T2-ratio at ROI-2.

Figure 4: - A box-and-whisker plot of the T2-ratio at each level. ns; not significant p = 0.112, *; p=0.001, **; p=0.012

Figure 5: - A box-and-whisker plot of the F-ratio at each level. *; p=0.012, **; p=0.002, ***; p=0.002
Table 1. T2-ratios and F-ratios of normal volunteers and patients with carpal tunnel syndrome
|
Case |
Gender |
Side |
|
T2-ratio |
|
F-ratio |
|
|
Terminal |
||||
|
ROI-1 |
ROI-2 |
ROI-3 |
|
L1 |
L2 |
L3 |
|
||||||
|
Normal volunteers |
|
|
|
|
|
|
|
|
|
|
|||
|
1 |
F |
R |
1.1 |
1.0 |
1.1 |
2.1 |
1.9 |
1.6 |
2.9 |
||||
|
2 |
F |
R |
1.0 |
1.0 |
0.9 |
1.6 |
1.5 |
1.7 |
3.1 |
||||
|
3 |
F |
R |
1.0 |
1.0 |
1.0 |
1.6 |
1.6 |
1.6 |
3.0 |
||||
|
4 |
F |
R |
0.9 |
0.9 |
1.0 |
1.5 |
1.4 |
1.9 |
2.8 |
||||
|
5 |
F |
R |
1.1 |
1.0 |
1.0 |
1.0 |
1.3 |
1.6 |
2.8 |
||||
|
Ave |
|
|
1.02 |
0.98 |
1.00 |
1.56 |
1.54 |
1.68 |
2.92 |
||||
|
SD |
|
|
0.07 |
0.04 |
0.06 |
0.35 |
0.21 |
0.12 |
0.12 |
||||
|
Patients with CTS |
|
|
|||||||||||
|
6 |
F |
R |
1.1 |
1.3 |
1.2 |
2.3 |
2.1 |
2.4 |
4.5 |
||||
|
7 |
F |
R |
1.0 |
1.2 |
1.1 |
2.2 |
2.0 |
2.1 |
12.3 |
||||
|
8 |
F |
L |
1.4 |
1.2 |
1.1 |
1.2 |
2.1 |
2.1 |
10.4 |
||||
|
R |
1.2 |
1.4 |
1.3 |
2.8 |
1.9 |
2.2 |
7.46 |
||||||
|
9 |
F |
R |
1.5 |
1.2 |
1.1 |
2.2 |
2.2 |
1.9 |
4.88 |
||||
|
10 |
F |
R |
1.0 |
1.1 |
1.2 |
2.4 |
2.2 |
2.5 |
- |
||||
|
L |
1.0 |
1.1 |
1.0 |
2.3 |
2.9 |
1.9 |
4.71 |
||||||
|
11 |
F |
R |
1.2 |
1.1 |
1.2 |
2.3 |
2.3 |
2.5 |
- |
||||
|
12 |
F |
R |
1.3 |
1.3 |
1.3 |
2.3 |
1.9 |
2.2 |
9 |
||||
|
Ave |
|
|
1.19 |
1.21 |
1.17 |
2.22 |
2.18 |
2.20 |
7.61 |
||||
|
SD |
|
|
0.17 |
0.10 |
0.09 |
0.40 |
0.29 |
0.22 |
2.86 |
||||
ROI = region of interest, CTS = carpal tunnel syndrome, - = undetectable, Ave=average, SD=standard deviation
T2-ratio was significantly higher in patients with CTS than in normal volunteers in ROI-2and ROI-3 (p=0.001 and 0.012, respectively), but not inROI-1 (p=0.112).
F-ratio was significantly higher in patients with CTS than in normal volunteers at L1, 2 and 3 (p=0.012, 0.002 and 0.002, respectively)
D i s c u s s i o n
In diagnosis of CTS, electrodiagnostic evaluation has been widely used; the sensitivities and specificities of median motor conduction time range from 60% to 74% and 95% to 99%, respectively [20, 22]. However, recent clinical studies with validated outcome assessments have demonstrated that subjective symptoms of CTS do not correlate well with electrophysiological data [23, 24]. In fact, >10% of CTS patients with significant symptoms have presented with normal electrophysiology and these cases might be treated as other peripheral nerve system abnormalities, such as cervical radiculopathy [25]. In addition, determination of entrapment localization in the median nerve is often difficult. Some failure cases of CTS with persistent symptoms after operative treatment have been caused by insufficient release of carpal tunnel at the incorrect location or incomplete length of the carpal retinaculum [26]. Therefore, reliable examinations of the severity of the disease and localization of the entrapment point in the median nerve have been required.
MRI, with its superior ability to detect soft tissue abnormalities, has been suggested as an ideal diagnostic adjunct to evaluate the soft tissues within the carpal tunnel. In previous studies, the cross-sectional area of the median nerve was evaluated on axial MR images to estimate the severity of compression morphologically [7, 15, 20]. Uchiyama et al. reported that flattening of the median nerve was more significant at the distal transverse carpal ligament than at the other levels and the flattening ratio in severe CTS patients was greater than that in the control group at the levels in the carpal tunnel [7]. These results were similar to our result, which showed that normal volunteers had a relatively round shape of the median nerve, whereas all CTS patients had a flat shape of the median nerve, with a significant difference in the F-ratio. Cha et al. demonstrated using axial MRI that the median nerve T2 values measured at the proximal and distal carpal tunnel levels were significantly higher in the CTS patients than in the controls [13].
There have been few reports regarding sagittal images of the median nerve, presumably because of the difficulty in localization of the nerve. Cudlip et al. reported that sagittal images were effective in precisely demonstrating the site and severity of nerve compression [15]. In these previous investigations, relationships between those morphological assessments and clinical symptoms were shown, but neurological disorders associated with CTS were not directly investigated.
In our study, the median nerve could be clearly visualized in the sagittal direction with successful demonstration of nerve T2 mapping in all patients. Nerve T2 values remained constant through the carpal tunnel in normal volunteers, as other studies have revealed [3, 6]. Interestingly, localization of most abnormal T2 regions in the median nerve differed among patients. Cudlip et al. reported that T2 signal intensity increased in proximal nerves in 27 of 30 patients, and loss of nerve signal in the distal carpal tunnel occurred in 26 of 30 patients [15]. Mesgarzadeh et al. reported that the increased signal intensity extended from the swollen part of the median nerve at the proximal end of the carpal tunnel to as far distally as the metacarpal bases [27]. These results were partly similar to our results; 60% of the cases had the highest T2-ratio in the proximal and middle of the carpal tunnel.
T2-weighted MRI shows that normal nerve signals are mostly isointense; however, a high signal intensity is likely to develop when the nerve is damaged or degenerated [28, 29]. The aetiology of idiopathic CTS may be attributed to an incompatibility between the median nerve and carpal tunnel [30]. Consequently, the intracarpal tunnel pressure increases and disturbance of circulation to the nerve occurs. Longstanding epineurial edema leads to invasion of fibroblasts and subsequent formation of constricting scar tissue inside the nerve [30, 31]. Swelling of the nerve trunk proximal to the compression site is assumed because of an increase in the amount of endoneurial connective tissue, edema in the epineurium and endoneurial space and obstruction of axoplasmic flow. Sunderland stated that compression of the median nerve from any cause can result in obstruction of venous return from the nerve, increased capillary pressure and edema [32]. Edema of the nerve would explain its swelling and increased signal intensity with T2 weighting. Some authors agree that preoperative high signal intensity of the median nerve may be a meaningful finding for idiopathic CTS because it decreases after surgical decompression of the nerve [3, 8, 15, 33]. Therefore, an increased T2-ratio in our study is assumed to be closely associated with pathological nerve change due to CTS. Localized high T2 area in the sagittal T2 mapping may be indicative of the most critical area, which should be decompressed during surgery. In our study, the T2-ratio at the middle and proximal segments of the carpal tunnel and F-ratio at all levels were significantly higher in the patient group than in the control group. A significant correlation was found between terminal latency and T2-ratio at the middle of the carpal tunnel but not between terminal latency and F-ratio. This might suggest that sagittal T2 mapping reflecting nerve pathological change can be a more sensitive index for CTS than is the F-ratio for measuring morphological change.
The present study had several limitations, including the retrospective study design, relatively small number of objectives and use of only preoperative values without comparing with postoperative values. Further studies to determine if an elevated nerve T2 would be decreased along with improvement of symptoms after CTS surgery is required. However, we believe that the information obtained in this study will improve our diagnosis of the carpal tunnel syndrome and aid development of a more systematic decision-making approach in the selection of appropriate surgical treatment.
Conflict of Interests
The authors declare that they have no conflict of interest.
Acknowledgements
The authors acknowledge the assistance during parts of the experimental procedure from Youichi Yamazaki, PhD and Kenya Murase, PhD, from the Department of Medical Physics & Engineering, Osaka University Graduate School of Medicine.
Article Info
Article Type
Research ArticlePublication history
Received: Tue 20, Mar 2018Accepted: Fri 06, Apr 2018
Published: Thu 12, Apr 2018
Copyright
© 2023 Takashi Nishii. This is an open-access article distributed under the terms of the Creative Commons Attribution License, which permits unrestricted use, distribution, and reproduction in any medium, provided the original author and source are credited. Hosting by Science Repository.DOI: 10.31487/j.RDI.2018.10.003
Author Info
Corresponding Author
Takashi NishiiDepartment of Orthopaedic Surgery, Osaka General Medical Center, Sumiyoshi-ku, Osaka, Japan
Figures & Tables
Figure legends
Fig. 1: - Steps in image acquisition and analysis. On the first scout locator of a coronal image.
(A) the oblique line (yellow dots line) was defined along the median nerve. On the second scout locator of multiple axial images (B) perpendicular to the aforementioned oblique line, the next imaging plane in the midst of the median nerve was defined (yellow dots line) and sagittal 2D SPGR images and multiple spin echo images of the median nerve from the distal radius beyond the carpal-metacarpal joint (C) were obtained to generate nerve T2 mapping. Three regions of interest (ROI-1 to ROI-3) at the carpal tunnel area and one control ROI (ROI-C) distal to the carpal tunnel area were defined for calculation of nerve T2 values (D). Three high-resolution axial SPGR images (L1 to L3) perpendicular to the sagittal image were obtained to evaluate the morphological shape of the median nerve.
Fig. 2: - Representative axial SPGR images. A–C; 27-year-old normal volunteer (A: L1, B: L2, C: L3). D–F; 35-year-old patient with CTS (D: L1, E: L2, F: L3). The flattening ratio (F-ratio) was calculated as the width (w) divided by the height (h) of the median nerve. Yellow arrowheads surround the median nerve.
Fig. 3: - Representative mid-sagittal MR T2 mapping images of a normal volunteer and patients. Low T2 values are coloured in green or blue, whereas high T2 values are coloured in red. (A) 27-year-old female. A normal volunteer; the medial nerve showing relatively constant T2 values at all ROIs. (B) 50-year-old female. Patient with stage 3 CTS; high T2-ratio between ROI-2 and ROI-3. (C) 35-year-old female. Patient with stage 3 CTS; high T2-ratio at ROI-1. (D) 80-year-old female. Patient with stage 3 CTS; high T2-ratio at ROI-2.
Fig. 4: - A box-and-whisker plot of the T2-ratio at each level. ns; not significant p = 0.112, *; p=0.001, **; p=0.012
Fig. 5: - A box-and-whisker plot of the F-ratio at each level. *; p=0.012, **; p=0.002, ***; p=0.002
Table 1. T2-ratios and F-ratios of normal volunteers and patients with carpal tunnel syndrome
|
Case |
Gender |
Side |
|
T2-ratio |
|
F-ratio |
|
|
Terminal |
||||
|
ROI-1 |
ROI-2 |
ROI-3 |
|
L1 |
L2 |
L3 |
|
||||||
|
Normal volunteers |
|
|
|
|
|
|
|
|
|
|
|||
|
1 |
F |
R |
1.1 |
1.0 |
1.1 |
2.1 |
1.9 |
1.6 |
2.9 |
||||
|
2 |
F |
R |
1.0 |
1.0 |
0.9 |
1.6 |
1.5 |
1.7 |
3.1 |
||||
|
3 |
F |
R |
1.0 |
1.0 |
1.0 |
1.6 |
1.6 |
1.6 |
3.0 |
||||
|
4 |
F |
R |
0.9 |
0.9 |
1.0 |
1.5 |
1.4 |
1.9 |
2.8 |
||||
|
5 |
F |
R |
1.1 |
1.0 |
1.0 |
1.0 |
1.3 |
1.6 |
2.8 |
||||
|
Ave |
|
|
1.02 |
0.98 |
1.00 |
1.56 |
1.54 |
1.68 |
2.92 |
||||
|
SD |
|
|
0.07 |
0.04 |
0.06 |
0.35 |
0.21 |
0.12 |
0.12 |
||||
|
Patients with CTS |
|
|
|||||||||||
|
6 |
F |
R |
1.1 |
1.3 |
1.2 |
2.3 |
2.1 |
2.4 |
4.5 |
||||
|
7 |
F |
R |
1.0 |
1.2 |
1.1 |
2.2 |
2.0 |
2.1 |
12.3 |
||||
|
8 |
F |
L |
1.4 |
1.2 |
1.1 |
1.2 |
2.1 |
2.1 |
10.4 |
||||
|
R |
1.2 |
1.4 |
1.3 |
2.8 |
1.9 |
2.2 |
7.46 |
||||||
|
9 |
F |
R |
1.5 |
1.2 |
1.1 |
2.2 |
2.2 |
1.9 |
4.88 |
||||
|
10 |
F |
R |
1.0 |
1.1 |
1.2 |
2.4 |
2.2 |
2.5 |
- |
||||
|
L |
1.0 |
1.1 |
1.0 |
2.3 |
2.9 |
1.9 |
4.71 |
||||||
|
11 |
F |
R |
1.2 |
1.1 |
1.2 |
2.3 |
2.3 |
2.5 |
- |
||||
|
12 |
F |
R |
1.3 |
1.3 |
1.3 |
2.3 |
1.9 |
2.2 |
9 |
||||
|
Ave |
|
|
1.19 |
1.21 |
1.17 |
2.22 |
2.18 |
2.20 |
7.61 |
||||
|
SD |
|
|
0.17 |
0.10 |
0.09 |
0.40 |
0.29 |
0.22 |
2.86 |
||||
ROI = region of interest, CTS = carpal tunnel syndrome, - = undetectable, Ave=average, SD=standard deviation
T2-ratio was significantly higher in patients with CTS than in normal volunteers in ROI-2and ROI-3 (p=0.001 and 0.012, respectively), but not inROI-1 (p=0.112).
F-ratio was significantly higher in patients with CTS than in normal volunteers at L1, 2 and 3 (p=0.012, 0.002 and 0.002, respectively)
References
1. Farooki S, Ashman CJ, Yu JS, Abduljalil A, Chakeres D (2002) In vivo high-resolution MR imaging of the carpal tunnel at 8.0 tesla. Skeletal Radiol 31: 445-450. [Crossref]
2. Maurer J, Bleschkowski A, Tempka A, Felix R (2000) High-resolution MR imaging of the carpal tunnel and the wrist. Application of a 5-cm surface coil. Acta Radiol 41: 78-83.
3. Allmann KH, Horch R, Uhl M, Gufler H, Altehoefer C, et al. (1997) MR imaging of the carpal tunnel. Eur J Radiol 25: 141-145. [Crossref]
4. Bower JA, Stanisz GJ, Keir PJ (2006) An MRI evaluation of carpal tunnel dimensions in healthy wrists: Implications for carpal tunnel syndrome. Clin Biomech (Bristol, Avon) 21: 816-825. [Crossref]
5. Gambarota G, Veltien A, Klomp D, Van Alfen N, Mulkern RV, et al. (2007) Magnetic resonance imaging and T2 relaxometry of human median nerve at 7 Tesla. Muscle & nerve 36: 368-373. [Crossref]
6. Kleindienst A, Hamm B, Lanksch WR (1998) Carpal tunnel syndrome: staging of median nerve compression by MR imaging. J Magn Reson Imaging 8: 1119-1125. [Crossref]
7. Uchiyama S, Itsubo T, Yasutomi T, Nakagawa H, Kamimura M, et al. (2005) Quantitative MRI of the wrist and nerve conduction studies in patients with idiopathic carpal tunnel syndrome. J Neurol Neurosurg Psychiatry 76: 1103-1108. [Crossref]
8. Britz GW, Haynor DR, Kuntz C, Goodkin R, Gitter A, et al. (1995) Carpal tunnel syndrome: correlation of magnetic resonance imaging, clinical, electrodiagnostic, and intraoperative findings. Neurosurgery 37: 1097-1103. [Crossref]
9. Koltzenburg M, Bendszus M (2004) Imaging of peripheral nerve lesions. Current opinion in neurology 17: 621-626. [Crossref]
10. Dunn TC, Lu Y, Jin H, Ries MD, Majumdar S (2004) T2 relaxation time of cartilage at MR imaging: comparison with severity of knee osteoarthritis. Radiology 232: 592-598. [Crossref]
11. Wang YX, Zhao F, Griffith JF, Mok GS, Leung JC, et al. (2013) T1rho and T2 relaxation times for lumbar disc degeneration: an in vivo comparative study at 3.0-Tesla MRI. European radiology 23: 228-234. [Crossref]
12. Juras V, Apprich S, Szomolanyi P, Bieri O, Deligianni X, et al. (2013) Bi-exponential T2 analysis of healthy and diseased Achilles tendons: an in vivo preliminary magnetic resonance study and correlation with clinical score. European radiology 23: 2814-2822. [Crossref]
13. Cha JG, Han JK, Im SB, Kang SJ (2014) Median nerve T2 assessment in the wrist joints: preliminary study in patients with carpal tunnel syndrome and healthy volunteers. J Magn Reson Imaging 40: 789-795. [Crossref]
14. Akelman E (2004) Carpal Tunnel Syndrome. In: Berger RW, Weiss A-PC, eds. Hand Surgery Vol 1. Philadelphia: Lippincott Williams & Wilkins: 867-885.
15. Cudlip SA, Howe FA, Clifton A, Schwartz MS, Bell BA (2002) Magnetic resonance neurography studies of the median nerve before and after carpal tunnel decompression. J Neurosurg 96: 1046-1051. [Crossref]
16. Gelberman RH, Rydevik BL, Pess GM, Szabo RM, Lundborg G (1998) Carpal tunnel syndrome. A scientific basis for clinical care. Orthop Clin North Am 19: 115-124. [Crossref]
17. Mosher TJ, Dardzinski BJ (2004) Cartilage MRI T2 relaxation time mapping: overview and applications. Semin Musculoskelet Radiol 8: 355-368. [Crossref]
18. Nishii T, Kuroda K, Matsuoka Y, Sahara T, Yoshikawa H (2008) Change in knee cartilage T2 in response to mechanical loading. J Magn Reson Imaging 28: 175-180. [Crossref]
19. Nishii T, Tanaka H, Sugano N, Sakai T, Hananouchi T, et al. (2008) Evaluation of cartilage matrix disorders by T2 relaxation time in patients with hip dysplasia. Osteoarthritis Cartilage 16: 227-233. [Crossref]
20. Jarvik JG, Yuen E, Kliot M (2004) Diagnosis of carpal tunnel syndrome: electrodiagnostic and MR imaging evaluation. Neuroimaging Clin N Am 14: 93-102. [Crossref]
21. Landis JR, Koch GG (1977) The measurement of observer agreement for categorical data. Biometrics 33: 159-174. [Crossref]
22. Jablecki CK, Andary MT, So YT, Wilkins DE, Williams FH (1993) Literature review of the usefulness of nerve conduction studies and electromyography for the evaluation of patients with carpal tunnel syndrome. AAEM Quality Assurance Committee. Muscle & nerve 16: 1392-1414. [Crossref]
23. Mackinnon SE (2002) Pathophysiology of nerve compression. Hand Clin 18: 231-241. [Crossref]
24. Padua L, Padua R, Aprile I, D'Amico P, Tonali P (2002) Carpal tunnel syndrome: relationship between clinical and patient-oriented assessment. Clin Orthop Relat Res 395: 128-134. [Crossref]
25. Wright SA, Liggett N (2003) Nerve conduction studies as a routine diagnostic aid in carpal tunnel syndrome. Rheumatology (Oxford) 42: 602-603. [Crossref]
26. Neuhaus V, Christoforou D, Cheriyan T, Mudgal CS (2012) Evaluation and treatment of failed carpal tunnel release. The Orthopedic clinics of North America 43: 439-447. [Crossref]
27. Mesgarzadeh M, Schneck CD, Bonakdarpour A, Mitra A, Conaway D (1989) Carpal tunnel: MR imaging. Part II. Carpal tunnel syndrome. Radiology 171: 749-754. [Crossref]
28. Dailey AT, Tsuruda JS, Filler AG, Maravilla KR, Goodkin R, et al. (1997) Magnetic resonance neurography of peripheral nerve degeneration and regeneration. Lancet 350: 1221-1222. [Crossref]
29. Teresi LM, Hovda D, Seeley AB, Nitta K, Lufkin RB (1989) MR imaging of experimental demyelination. AJR Am J Roentgenol 152: 1291-1298. [Crossref]
30. Lundborg G (1988) Intraneural microcirculation. The Orthopedic clinics of North America 19: 1-12. [Crossref]
31. Gelberman RH, Hergenroeder PT, Hargens AR, Lundborg GN, Akeson WH (1981) The carpal tunnel syndrome. A study of carpal canal pressures. J Bone Joint Surg Am 63: 380-383. [Crossref]
32. Sunderland S (1976) The nerve lesion in the carpal tunnel syndrome. J Neurol Neurosurg Psychiatry 39: 615-626. [Crossref]
33. Pierre-Jerome C, Bekkelund SI, Mellgren SI, Nordstrom R (1997) Quantitative MRI and electrophysiology of preoperative carpal tunnel syndrome in a female population. Ergonomics 40: 642-649. [Crossref]