F-FDG Uptake Is Predictive of Poor Survival After Surgery for Large-CellNeuroendocrine-Carcinomas of The Lung: A Bicentric Analysis
F-FDG Uptake Is Predictive of Poor Survival After Surgery for Large-CellNeuroendocrine-Carcinomas of The Lung: A Bicentric Analysis
A B S T R A C T
Introduction: Large cell neuroendocrine carcinoma (LCNEC) represents a relatively rare and poorly studied entity whose management is not clearly established. The aim of this study was to explore the relationship between preoperative 18F-FDG-PET results, pathological features and long-term survival in a large surgical cohort of LCNEC.
Methods: From 06/08 to 06/17, the clinical, radiometabolic, pathological and surgical aspects of 121 LCNEC-patients surgically treated in 2 tertiary centers were retrieved. A Cox regression model was used to identify predictors of survival and Kaplan-Meier method to summarize overall survivals.
Results: Mean age and male/female ratio were 63.4±8.3 and 3:1, respectively. The main clinical, radiometabolic and surgical characteristics are reported in Tab.1. Most patients were active/former smokers and presented symptoms at diagnosis. 18FDG-PET/Scan was performed in 65 patients (53.7%) with a mean SUVmax of 10.1 (SD±4.6). Higher SUVmax values (SUVmax >10) were detected in tumors with larger size (p=0.004), advanced p-Stages (p=0.019), presenting necrosis (p=0.077) and with positive staining for CD56 (p=0.025) and TTF-1 (0.063). After surgery (R0 in 91% of cases), 52 (43%) patients had pStage-I while about 35% of patients presented with N1-2 disease. Median, 3-yrs and 5-yrs overall survival was 40 months, 52.2% and 44.6%, respectively. At univariate analysis, the survival was significantly influenced by SUVmax values (p=0.009) and by the presence of vascular invasion at pathological examination (p=0.024). Multivariate analysis showed as the FDG-SUVmax was the only independent variable affecting long-term survival (HR:2.86;C.E.: 1.09-7.47;p=0.032).
Conclusions: Patients underwent surgical resection for LCNEC of the lung experienced a poor prognosis (5-yrs survival = 44.6% in this study). High-level FDG accumulation (SUVmax >10) correlates with pathological features and results to be independently predictive of poor survival after surgery. This parameter should be taking into account when planning the best strategy of care.
Keywords
large cell neuroendocrine carcinoma, F-FDG, survival, lung cancer
Introduction
Among lung cancers, large cell neuroendocrine carcinoma (LCNEC) represents a relatively rare entity whose ideal management is not clearly established yet. These poorly-differentiated neuroendocrine tumors (NETs), previously classified as “high grade” malignancies in contrast to low grade NETs (carcinoids), are composed of large cells but sometimes exhibit molecular signature of small cell lung carcinoma (SCLC) [1]. They usually are associated with a poor prognosis even if a combined approach consisting in tumor resection and appropriate systemic treatment could improve survival as reported in surgical series of the last-decade, leading to oncological results close to those of other operated non-small cell lung carcinomas (NSCLC) [2-5]. However, the identification of preoperative prognostic factor in order to clarify surgical eligibility criteria as well as to define adjuvant treatment indications remains one of the major challenges in the multimodal management of this uncommon entity [6,7]. In this setting, the role of Fluorine-18 Fluorodeoxyglucose Positron Emission Tomography (18F-FDG-PET) in predicting pathological features and long-term survival is still undefined. The aim of this study was to explore the relationship between preoperative 18F-FDG-PET results, pathological features and long-term survival in a large surgical cohort of LCNEC.
Table 1: Clinical, Radiological and Pathological Features of the Population
|
Variable |
Value |
|
Population, n |
121 |
|
Age Mean, SD |
74.9±10.6 |
|
Sex n, % |
|
|
Male |
90 (74.4) |
|
Female |
31 (25.6) |
|
Smoking History n, % |
|
|
Y |
109 (90.1) |
|
N |
12 (9.9) |
|
Paraneoplastic Syndrome n, % |
|
|
Y |
7 (5.8) |
|
N |
114 (94.2) |
|
Symptoms at Presentation n,% |
|
|
Y |
72 (59.5) |
|
N |
49 (40.5) |
|
18FDG-PET/Scan n, % |
|
|
Y |
65 (53.7) |
|
N |
56 (46.3) |
|
Intervention Type n, % |
|
|
Pneumectomy |
13 (10.7) |
|
Bilobectomy |
2 (1.7) |
|
Lobectomy |
86 (71.0) |
|
Sleeve-Lobectomy |
3 (2.4) |
|
Typical Segmentectomy |
7 (5.8) |
|
Wedge Resection |
5 (4.1) |
|
Exploratory thoracotomy |
5 (4.1) |
|
pT n, % |
|
|
1 |
52 (43.0) |
|
2 |
40 (33.1) |
|
3 |
18 (14.9) |
|
4 |
11 (9.1) |
|
pN n, %^ |
|
|
0 |
78 (64.4) |
|
1 |
16 (13.2) |
|
2 |
27 (22.3) |
|
pSTAGE |
|
|
IA |
38 (31.5) |
|
IB |
14 (11.6) |
|
IIA |
9 (7.4) |
|
IIB |
18 (14.9) |
|
IIIA |
24 (19.8) |
|
IIIB |
9 (7.4) |
|
IVA |
9 (7.4) |
|
Tumor Size Mean (cm) |
3.3 |
|
Resection Status n, % |
|
|
R0 |
110 (90.9) |
|
R1 |
11 (9.1) |
|
(Neo)CHT n, %^ |
|
|
Y |
55 (45.5) |
|
N |
66 (54.5) |
|
Radiotherapy n, %^ |
|
|
Y |
25 (20.6) |
|
N |
96 (79.8) |
^ missing data
Materials and Methods
From June 2008 to June 2017, the clinical, radiometabolic, pathological and surgical aspects of 121 consecutive LCNEC-patients treated in 2 tertiary centers were retrospectively reviewed. Patients without pathological confirmation based on histology were excluded from the analysis. The Promoting Center (IRCCS-Arcispedale Santa Maria Nuova-Reggio Emilia) selected the other institution considering its high-volume and certain homogeneity of treatment that substantially agreed on the “management policy “of this pathology. Before undertaking our data analysis, IRB approval (Protocol_Number: 2018/0075167) was obtained for the research use of retrospectively collected data (observational) stemming from standard clinical practice. Data related to age, gender, smoking history, radiological and radiometabolic evaluation, TNM status, type of treatment, surgical notes and pathological/immunohistochemical features were reviewed and recorded (Table 1).
I Diagnostic work-up
Despite minimal differences between centers, the pre-operative work up examination was essentially the same, this resulting substantially the same performed in NSCLC-patients and reported in [8]. 18F-FDG-PET/CT-scan was performed in the majority of the cases (65 of 121, 53.7%), according to local practices and especially when radiometabolic results could be useful in the multisciplinary evaluation of a multimodal approach.
II Surgical Technique and Pathological Evaluation
Despite some unavoidable variability in the surgical technique among the two centers involved, the surgical policy adopted when planning the pulmonary resection extension was based on similar assumptions as indicated below:
1) parenchymal resection to a lesser extent than a lobectomy was considered oncologically inappropriate and was never performed in “clinically fit” patients;
2) sub-lobar resection (segmentectomy or wedge resection) was indicated only in patients judged “clinically unfit” for lobar resection;
3) lymph node dissection (lobe-specific or complete) was performed in all cases, and the mediastinal tissue encompassing the lymph nodes was dissected and removed systematically within typical anatomical landmarks.
Surgical-pathological stage was (re)assigned according to the 7thTNM classification system and the resection was considered complete (R0) according to the criteria purposed by the International Association for the Study of Lung Cancer Staging Committee and data from patients observed and treated before its introduction into clinical practice have been updated to cohere with this classification system and to obtain homogeneous staging information throughout the entire cohort [9]. A centralized blind pathological revision of the samples was performed by an expert pathologist specializing in lung pathology (M.M.) to avoid any variations in the pathological diagnosis and to achieve substantial concordance with the histopathological characteristics of the samples evaluated. The revision was performed according to the revised 2015 World Health Organization classification for LCNEC on which the following diagnostic criteria are based [10].
Based on histological features of neuroendocrine morphology including rosettes and peripheral palisading patterns, neuroendocrine features were confirmed by immunohistochemistry (IHC) expression of at least one neuroendocrine marker (synaptophysin [SYN], chromogranin-A [CGA], and CD56). Notably, enrolled samples included histologically mixed LCNEC (tumors with morphologically identifiable ADC or SQCC component) where included only when LCNEC presented as the dominant type ≥90%. Representative paraffin blocks were selected on base of H&E staining. Three-μm thick FFPE slides were stained using a Leica BOND Autostainer according to the manufacturer’s instructions. Tissue sections were analyzed by immunohistochemistry with following primary antibodies: TTF-1 (1:200, mouse monoclonal, clone: 8G7G3/1; Dako, Danmark), Ki67 (1:150, mouse monoclonal; clone MIB1; Dako Danmark), CD56 (1:100, mouse monoclonal, clone:123C3; Dako, Danmark), Synaptophysin(1:50, mouse monoclonal, clone:DAK-SYNAP, Dako, Danmark), chromogranin A (1:200, mouse monoclonal, clone:DAK-A3, Dako, Danmark).
III Postoperative treatment and follow-up
Adjuvant platinum-based chemotherapy and/or radiotherapy were given under the care of referring oncologists. The clinical records from outpatient clinics and correspondence with the patient’s referring physician provided information on the health status of the patient. Follow-up data were available for all of the patients.
IV Statistical Analysis
Categorical variables were compared using Fisher’s exact test or Chi-square test, and continuous variables were compared using the Mann–Whitney U test. Overall survival (OS) was defined as the period from the date of resection or biopsy to the date of death. Since there were no post-operative data regards of 10 patients, OS analysis was performed on 111 LCNEC cases. Patients who were alive at the time of last follow-up were censored.
OS was analyzed by the Kaplan-Meier plots and the log-rank test was used to calculate the significance between groups. The prognostic factors for OS were analyzed using univariate and multivariate COX proportional hazard model. The two-sided significance level was set at p < 0.05. Data were analyzed using the Statistical Package for the Social Sciences Version 23.0 Software (SPSS, Inc., Chicago, IL) and the survival curve was drawn with GraphPad Prism 5.01 (GraphPad Software, San Diego, CA).
Results
The main clinical, radiometabolic, surgical and pathological features are summarized in (Table 1). Mean age and male/female ratio were 63.4±8.3 and 3:1, respectively. Most patients (about 90%) were active/former smokers and presented with symptoms at diagnosis (more than 50%). Lobectomy was the most common surgical procedure (~70%) followed by pneumonectomy and anatomical segmentectomy. Extended resection to adjacent organs (chest wall in 19 cases, pericardium in 4, and diaphragm in 2) was performed in 25 (20.6%) cases and radical resection was achieved in more than 90% of cases despite 5 explorative thoracotomies. At pathological stage, about 2/3 of patients had a T1-T2 tumors while a N1/N2 involvement was found in about 35% of patients (Table 1). At microscopic evaluation, the number of mitoses was high (> 2/10 HPF) in most part of surgical specimens with more than 80% of them showing areas of necrosis. At immunohistochemical staining (data not shown), surgical specimens were positive for CgA in 83.5% and for TTF-1 in 67.7% of cases. Chemotherapy was administered before or after surgery in about half of cases while post-operative radiotherapy was indicated and performed in 20% of them.
Table 2: Correlation between 18FDG-SUVMax-T and pathological features
|
Variables |
|
#pts |
SUVMax Mean |
p |
|
Tumor-Size |
≤3.3 |
34 |
8.0 |
0.004 |
|
|
>3.3 |
31 |
11.2 |
|
|
|
|
|
|
|
|
pT |
>2 |
38 |
10.9 |
0.004 |
|
|
≤2 |
27 |
7.7 |
|
|
|
|
|
|
|
|
pN |
≥1 |
21 |
10.5 |
0.359 |
|
|
≤1 |
44 |
9.4 |
|
|
|
|
|
|
|
|
p-Stage Group |
≥2 |
36 |
11.3 |
0.019 |
|
|
<2 |
29 |
8.6 |
|
|
|
|
|
|
|
|
Vascular Invasion^ |
Y |
31 |
10.0 |
0.523 |
|
|
N |
17 |
9.2 |
|
|
|
|
|
|
|
|
Mitosis N |
<2/10HPF |
8 |
7.7 |
0.203 |
|
|
>2/10HPF |
57 |
10.5 |
|
|
|
|
|
|
|
|
Necrosis |
Y |
57 |
10.5 |
0.077 |
|
|
N |
8 |
6.3 |
|
|
|
|
|
|
|
|
CD56^ |
P |
23 |
9.8 |
0.025 |
|
|
N |
4 |
15.3 |
|
|
|
|
|
|
|
|
CgA^ |
P |
45 |
10.0 |
0.603 |
|
|
N |
12 |
10.8 |
|
|
|
|
|
|
|
|
TTF1^ |
P |
40 |
9.5 |
0.063 |
|
|
N |
12 |
11.8 |
|
|
|
|
|
|
|
|
Ki67(%)^ |
≥50% |
30 |
12.8 |
0.05 |
|
|
<50% |
22 |
8.8 |
|
^missing data
I Inter-relationship between Radiometabolic Results and Pathological features
18FDG-PET/Scan was performed in 65 patients (53.7%) with a mean SUVmax of 10.1 (SD±4.6). When correlating the radiometabolic results (SUVmax values) with pathological features (Table 2), the Chi-squared test revealed as higher SUVmax values were detected in tumors with larger (≥~3cm) size (SUVmax: 11.2 vs 8, p=0.004), advanced (I vs II-IV) Stages (SUVmax: 11.3 vs 8.6, p=0.019), presenting high levels (>50%) of ki-67 (SUVmax: 12.8 vs 8.8, p=0.05) or necrosis (SUVmax: 10.5 vs 6.3, p=0.077) at pathological evaluation. No significant association was observed according to N-status and presence of vascular invasion at specimen evaluation. Moreover, we observed a similar correlation between SUVmax values and negative staining for CD56 (p=0.025) and (borderline) TTF-1 (0.063).
II Survival Results
Median, 3-yrs and 5-yrs overall survival was 40 months, 52.2% and 44.6%, respectively (Fig.1A), with a mean follow-up of 71 months (range 11–103 months). At univariate analysis performed on 111 patients (Tab.3), we observed a trend of association between the long-term survival and pStage with 5-yrs survival of 53.8% in pStage-I vs 35.9% in pStage II/III/IV (p=0.06, Fig. 1B). A stronger association was found exploring long-term survival and the presence of vascular invasion at pathological examination (61.0% vs 33.5%, p=0.024; Fig. 1C) and even more SUVmax values (p=0.009; Fig. 1D). No other prognostic factors were observed (Table 3). Multivariable analysis showed as the FDG-SUVmax was the only independent variable affecting long-term survival (HR:2.86;C.E.: 1.09-7.47;p=0.032).
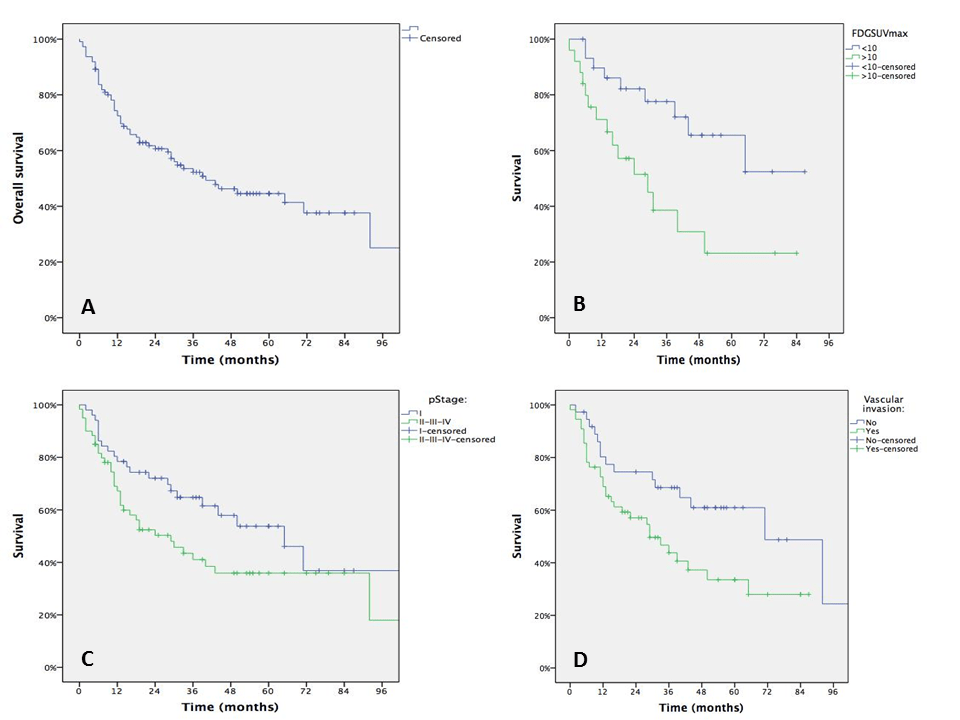
Figure 1: Kaplan-Meyer Survival Curves of the overall population (A), according to SUVmax values (B), pStage (C) and the presence of vascular emboli (D).
Table 3: Survival results: univariate analysis
|
|
# pt |
% 5y |
Median (months) |
Conf. Interval (95%) |
p Value |
|
OS |
111 |
44.6 |
40 |
22-58 |
- |
|
Gender |
|
|
|
|
|
|
Male |
85 |
48.9 |
44 |
14-74 |
0.195 |
|
Female |
26 |
27.6 |
29 |
5-53 |
|
|
|
|
|
|
|
|
|
Smoking History |
|
|
|
|
|
|
Y |
94 |
46.2 |
44 |
14-74 |
0.459 |
|
N |
7 |
51.4 |
. |
. |
|
|
|
|
|
|
|
|
|
18FDG PET |
|
|
|
|
|
|
Y |
57 |
46.5 |
50 |
26-74 |
0.296 |
|
N |
54 |
41.9 |
30 |
9-51 |
|
|
|
|
|
|
|
|
|
18FDG SuvMax (Cathegorical) |
|
|
|
|
|
|
<9.7 |
34 |
65.5 |
. |
. |
|
|
>9.7 |
28 |
23.2 |
29 |
14-44 |
0.009 |
|
|
|
|
|
|
|
|
Tumor Size (Cathegorical) |
|
|
|
|
|
|
<3.3 |
58 |
55.7 |
65 |
39-91 |
0.104 |
|
>3.3 |
53 |
39.5 |
33 |
10-56 |
|
|
|
|
|
|
|
|
|
pT |
|
|
|
|
|
|
1 |
51 |
58.4 |
92 |
38-146 |
0.136 |
|
2 |
37 |
46.0 |
50 |
18-83 |
|
|
3 |
15 |
39.2 |
33 |
8-58 |
|
|
4 |
8 |
14.6 |
13 |
11-15 |
|
|
|
|
|
|
|
|
|
pN |
|
|
|
|
|
|
0 |
73 |
44.9 |
44 |
23-65 |
0.766 |
|
1 |
14 |
53.9 |
92 |
32-152 |
|
|
2 |
24 |
47.7 |
30 |
. |
|
|
|
|
|
|
|
|
|
pStageGrouped |
|
|
|
|
|
|
I |
51 |
53.8 |
65 |
39-90 |
0.06 |
|
II-III-IV |
60 |
35.9 |
29 |
13-44.8 |
|
|
|
|
|
|
|
|
|
Vascular Invasion^ |
|
|
|
|
|
|
Y |
55 |
33.5 |
29 |
14-44 |
0.024 |
|
N |
37 |
61.0 |
71 |
38-104 |
|
|
|
|
|
|
|
|
|
Mitosis Number |
|
|
|
|
|
|
<2/10HPF |
18 |
45.6 |
43 |
. |
0.691 |
|
>2/10HPF |
93 |
44.9 |
40 |
17-63 |
|
|
|
|
|
|
|
|
|
Necrosis |
|
|
|
|
|
|
Y |
90 |
43.2 |
40 |
21-59 |
0.496 |
|
N |
21 |
54.4 |
71 |
19-124 |
|
|
|
|
|
|
|
|
|
ImmunohCD56^ |
|
|
|
|
|
|
P |
30 |
48.1 |
40 |
0-83 |
0.880 |
|
N |
4 |
37.5 |
24 |
0-58 |
|
|
|
|
|
|
|
|
|
ImmunohCgA^ |
|
|
|
|
|
|
P |
87 |
48.0 |
50 |
19-81 |
0.352 |
|
N |
12 |
18.8 |
31 |
17-45 |
|
|
|
|
|
|
|
|
|
ImmunohSynaptop^ |
|
|
|
|
|
|
P |
15 |
54.2 |
. |
. |
0.529 |
|
N |
7 |
21.4 |
24 |
9-39 |
|
|
|
|
|
|
|
|
|
ImmunohTTF1^ |
|
|
|
|
|
|
P |
61 |
51.0 |
65 |
39-91 |
0.079 |
|
N |
29 |
36.2 |
29 |
0-62 |
|
|
|
|
|
|
|
|
|
Ki67^ |
|
|
|
|
|
|
<50% |
40 |
45.0 |
43 |
0-81 |
0.461 |
|
>50% |
62 |
52.9 |
. |
. |
|
|
|
|
|
|
|
|
|
(Neo)Chemotherapy |
|
|
|
|
|
|
Y |
72 |
41.7 |
31 |
12-50 |
0.392 |
|
N |
39 |
49.7 |
50 |
22-78 |
|
|
|
|
|
|
|
|
|
Radiotherapy |
|
|
|
|
|
|
Y |
22 |
47.0 |
31 |
. |
0.755 |
|
N |
89 |
45.2 |
43 |
16-70 |
|
^ data missing
Discussion
In this study, we observed that surgical resection may allow relatively favorable survivals (5yrs-OS=44.6%) in selected LCNEC patients. Independently from the choice of adjuvant chemotherapy regimen, when indicated, it corroborates results of most surgical teams showing 5-year survivals around 50%, in completely resected patients. Interestingly, we showed that FDG-uptake was the only factor independently predicting overall-survival. What is most striking here is the high prognostic value of tumor radiometabolic assessment at 18F-FDG-PET/CT-scan (hazard-ratio=3.01) which was statistically stronger than usually reported factors such as p-stage, age, nodal status or type of adjuvant treatment [11, 12]. Although PET-CT is well known as diagnostic tool for predicting the histopathological nature of pulmonary lesions and differentiating benign or low-grade from intermediate or high-grade tumors, its prognostic impact within a specific subtype of NETs was rarely described [13]. Herein we observed a direct correlation between FDG-uptake and Ki67 expression and presence of necrosis; on the other hand the number of mitoses and the presence of vascular emboli did not influence the FDG uptake in our cohort of LCNEC patients. Therefore, we can hypothesize that 18F-FDG-PET/CT allows a proper evaluation of disease biological behavior and substantially reflects processes likely involved in cells proliferation, metastatic potential, sensitivity to systemic treatments, and/or anticancer adaptive immunity. In fact, radiometabolic features of at PET-CT evaluation have been previously associated with PD-L1 expression of LCNECs, which also represents a key biomarker for predicting aggressiveness and response to treatments of NSCLCs, above all in the era of immune check-point inhibitors (ICIs) [14, 15].
Another debated issue of LCNEC multimodal management is the relevance, efficacy, and type of adjuvant chemotherapy. In metastatic and non-resectable LCNECs, numerous molecular targets were investigated for developing systemic therapies [16]. In locally treated LCNEC patients, the choice of adjuvant regimen is, most of the time, binary and performed in analogy to NSCLC or SCLC according to pathological analysis of resected specimen and medical team policy. In our study, we failed to evidence any significant benefit of (neo)adjuvant chemotherapy in term of survival, probably because of the relatively small number of patients but this may also result from a too standardized, and non-customized, administrated regimen, which could theoretically be performed thanks to the analysis of “large” surgical specimens. Besides its above-discussed contribution in the setting of an increasing interest for ICI treatment of LCNECs, 18F-FDG-PET/CT might be useful in choosing the appropriate adjuvant therapy.
Conclusion
18F-FDG-PET/CT represents a relevant predictive factor of pathological features as well as long-term survival in a selected subset of LCNECs patients. While it stays as an efficient tool for eligibility to surgical resection, further analyses are needed to evaluate its usefulness in the choice of adjuvant or systemic treatments including immunotherapies.
Acknowledgment
None.
Conflicts of Interest
None declared
Funding
None.
Article Info
Article Type
Research ArticlePublication history
Received: Sun 23, Jun 2019Accepted: Mon 08, Jul 2019
Published: Fri 30, Aug 2019
Copyright
© 2023 Ludovic Fournel. This is an open-access article distributed under the terms of the Creative Commons Attribution License, which permits unrestricted use, distribution, and reproduction in any medium, provided the original author and source are credited. Hosting by Science Repository.DOI: 10.31487/j.JSO.2019.03.01
Author Info
Corresponding Author
Ludovic FournelUnit of Thoracic Surgery, Cochin Hospital, Paris-Center University hospitals, AP-HP, Paris Descartes University, Paris, France
Figures & Tables
Table 1: Clinical, Radiological and Pathological Features of the Population
|
Variable |
Value |
|
Population, n |
121 |
|
Age Mean, SD |
74.9±10.6 |
|
Sex n, % |
|
|
Male |
90 (74.4) |
|
Female |
31 (25.6) |
|
Smoking History n, % |
|
|
Y |
109 (90.1) |
|
N |
12 (9.9) |
|
Paraneoplastic Syndrome n, % |
|
|
Y |
7 (5.8) |
|
N |
114 (94.2) |
|
Symptoms at Presentation n,% |
|
|
Y |
72 (59.5) |
|
N |
49 (40.5) |
|
18FDG-PET/Scan n, % |
|
|
Y |
65 (53.7) |
|
N |
56 (46.3) |
|
Intervention Type n, % |
|
|
Pneumectomy |
13 (10.7) |
|
Bilobectomy |
2 (1.7) |
|
Lobectomy |
86 (71.0) |
|
Sleeve-Lobectomy |
3 (2.4) |
|
Typical Segmentectomy |
7 (5.8) |
|
Wedge Resection |
5 (4.1) |
|
Exploratory thoracotomy |
5 (4.1) |
|
pT n, % |
|
|
1 |
52 (43.0) |
|
2 |
40 (33.1) |
|
3 |
18 (14.9) |
|
4 |
11 (9.1) |
|
pN n, %^ |
|
|
0 |
78 (64.4) |
|
1 |
16 (13.2) |
|
2 |
27 (22.3) |
|
pSTAGE |
|
|
IA |
38 (31.5) |
|
IB |
14 (11.6) |
|
IIA |
9 (7.4) |
|
IIB |
18 (14.9) |
|
IIIA |
24 (19.8) |
|
IIIB |
9 (7.4) |
|
IVA |
9 (7.4) |
|
Tumor Size Mean (cm) |
3.3 |
|
Resection Status n, % |
|
|
R0 |
110 (90.9) |
|
R1 |
11 (9.1) |
|
(Neo)CHT n, %^ |
|
|
Y |
55 (45.5) |
|
N |
66 (54.5) |
|
Radiotherapy n, %^ |
|
|
Y |
25 (20.6) |
|
N |
96 (79.8) |
^ missing data
Table 2: Correlation between 18FDG-SUVMax-T and pathological features
|
Variables |
|
#pts |
SUVMax Mean |
p |
|
Tumor-Size |
≤3.3 |
34 |
8.0 |
0.004 |
|
|
>3.3 |
31 |
11.2 |
|
|
|
|
|
|
|
|
pT |
>2 |
38 |
10.9 |
0.004 |
|
|
≤2 |
27 |
7.7 |
|
|
|
|
|
|
|
|
pN |
≥1 |
21 |
10.5 |
0.359 |
|
|
≤1 |
44 |
9.4 |
|
|
|
|
|
|
|
|
p-Stage Group |
≥2 |
36 |
11.3 |
0.019 |
|
|
<2 |
29 |
8.6 |
|
|
|
|
|
|
|
|
Vascular Invasion^ |
Y |
31 |
10.0 |
0.523 |
|
|
N |
17 |
9.2 |
|
|
|
|
|
|
|
|
Mitosis N |
<2/10HPF |
8 |
7.7 |
0.203 |
|
|
>2/10HPF |
57 |
10.5 |
|
|
|
|
|
|
|
|
Necrosis |
Y |
57 |
10.5 |
0.077 |
|
|
N |
8 |
6.3 |
|
|
|
|
|
|
|
|
CD56^ |
P |
23 |
9.8 |
0.025 |
|
|
N |
4 |
15.3 |
|
|
|
|
|
|
|
|
CgA^ |
P |
45 |
10.0 |
0.603 |
|
|
N |
12 |
10.8 |
|
|
|
|
|
|
|
|
TTF1^ |
P |
40 |
9.5 |
0.063 |
|
|
N |
12 |
11.8 |
|
|
|
|
|
|
|
|
Ki67(%)^ |
≥50% |
30 |
12.8 |
0.05 |
|
|
<50% |
22 |
8.8 |
|
^missing data
Table 3: Survival results: univariate analysis
|
|
# pt |
% 5y |
Median (months) |
Conf. Interval (95%) |
p Value |
|
OS |
111 |
44.6 |
40 |
22-58 |
- |
|
Gender |
|
|
|
|
|
|
Male |
85 |
48.9 |
44 |
14-74 |
0.195 |
|
Female |
26 |
27.6 |
29 |
5-53 |
|
|
|
|
|
|
|
|
|
Smoking History |
|
|
|
|
|
|
Y |
94 |
46.2 |
44 |
14-74 |
0.459 |
|
N |
7 |
51.4 |
. |
. |
|
|
|
|
|
|
|
|
|
18FDG PET |
|
|
|
|
|
|
Y |
57 |
46.5 |
50 |
26-74 |
0.296 |
|
N |
54 |
41.9 |
30 |
9-51 |
|
|
|
|
|
|
|
|
|
18FDG SuvMax (Cathegorical) |
|
|
|
|
|
|
<9.7 |
34 |
65.5 |
. |
. |
|
|
>9.7 |
28 |
23.2 |
29 |
14-44 |
0.009 |
|
|
|
|
|
|
|
|
Tumor Size (Cathegorical) |
|
|
|
|
|
|
<3.3 |
58 |
55.7 |
65 |
39-91 |
0.104 |
|
>3.3 |
53 |
39.5 |
33 |
10-56 |
|
|
|
|
|
|
|
|
|
pT |
|
|
|
|
|
|
1 |
51 |
58.4 |
92 |
38-146 |
0.136 |
|
2 |
37 |
46.0 |
50 |
18-83 |
|
|
3 |
15 |
39.2 |
33 |
8-58 |
|
|
4 |
8 |
14.6 |
13 |
11-15 |
|
|
|
|
|
|
|
|
|
pN |
|
|
|
|
|
|
0 |
73 |
44.9 |
44 |
23-65 |
0.766 |
|
1 |
14 |
53.9 |
92 |
32-152 |
|
|
2 |
24 |
47.7 |
30 |
. |
|
|
|
|
|
|
|
|
|
pStageGrouped |
|
|
|
|
|
|
I |
51 |
53.8 |
65 |
39-90 |
0.06 |
|
II-III-IV |
60 |
35.9 |
29 |
13-44.8 |
|
|
|
|
|
|
|
|
|
Vascular Invasion^ |
|
|
|
|
|
|
Y |
55 |
33.5 |
29 |
14-44 |
0.024 |
|
N |
37 |
61.0 |
71 |
38-104 |
|
|
|
|
|
|
|
|
|
Mitosis Number |
|
|
|
|
|
|
<2/10HPF |
18 |
45.6 |
43 |
. |
0.691 |
|
>2/10HPF |
93 |
44.9 |
40 |
17-63 |
|
|
|
|
|
|
|
|
|
Necrosis |
|
|
|
|
|
|
Y |
90 |
43.2 |
40 |
21-59 |
0.496 |
|
N |
21 |
54.4 |
71 |
19-124 |
|
|
|
|
|
|
|
|
|
ImmunohCD56^ |
|
|
|
|
|
|
P |
30 |
48.1 |
40 |
0-83 |
0.880 |
|
N |
4 |
37.5 |
24 |
0-58 |
|
|
|
|
|
|
|
|
|
ImmunohCgA^ |
|
|
|
|
|
|
P |
87 |
48.0 |
50 |
19-81 |
0.352 |
|
N |
12 |
18.8 |
31 |
17-45 |
|
|
|
|
|
|
|
|
|
ImmunohSynaptop^ |
|
|
|
|
|
|
P |
15 |
54.2 |
. |
. |
0.529 |
|
N |
7 |
21.4 |
24 |
9-39 |
|
|
|
|
|
|
|
|
|
ImmunohTTF1^ |
|
|
|
|
|
|
P |
61 |
51.0 |
65 |
39-91 |
0.079 |
|
N |
29 |
36.2 |
29 |
0-62 |
|
|
|
|
|
|
|
|
|
Ki67^ |
|
|
|
|
|
|
<50% |
40 |
45.0 |
43 |
0-81 |
0.461 |
|
>50% |
62 |
52.9 |
. |
. |
|
|
|
|
|
|
|
|
|
(Neo)Chemotherapy |
|
|
|
|
|
|
Y |
72 |
41.7 |
31 |
12-50 |
0.392 |
|
N |
39 |
49.7 |
50 |
22-78 |
|
|
|
|
|
|
|
|
|
Radiotherapy |
|
|
|
|
|
|
Y |
22 |
47.0 |
31 |
. |
0.755 |
|
N |
89 |
45.2 |
43 |
16-70 |
|
^ data missing
References
- Scoazec JY (2019) Lung and digestive neuroendocrine neoplasms. From WHO classification to biomarker screening: Which perspectives? Ann Endocrinol (Paris) 80: 163-165. [Crossref]
- Fournel L, Falcoz PE, Alifano M, Charpentier MC, Boudaya MS et al. (2013) Surgical management of pulmonary large cell neuroendocrine carcinomas: a 10-year experience. Eur J Cardiothorac Surg 43: 111-114. [Crossref]
- Kim KW, Kim HK, Kim J, Shim YM, Ahn MJ et al. (2017) Outcomes of Curative-Intent Surgery and Adjuvant Treatment for Pulmonary Large Cell Neuroendocrine Carcinoma. World J Surg 41: 1820-1827. [Crossref]
- Rieber J, Schmitt J, Warth A, Muley T, Kappes J, Eichhorn F et al. (2015) Outcome and prognostic factors of multimodal therapy for pulmonary large-cell neuroendocrine carcinomas. Eur J Med Res 20: 64. [Crossref]
- Grand B, Cazes A, Mordant P, Foucault C, Dujon A et al. (2013) High grade neuroendocrine lung tumors: pathological characteristics, surgical management and prognostic implications. Lung Cancer 81: 404-409. [Crossref]
- Makino T, Mikami T, Hata Y, Otsuka H, Koezuka S et al. (2016) Comprehensive Biomarkers for Personalized Treatment in Pulmonary Large Cell Neuroendocrine Carcinoma: A Comparative Analysis with Adenocarcinoma. Ann Thorac Surg 102: 1694-1701. [Crossref]
- Derks J, van Suylen RJ, Thunnissen E, den Bakker M, Groen H et al. (2017) Why we should improve current practice of diagnosing and treating pulmonary large cell neuroendocrine carcinomas in patients with advanced disease. Eur Respir J 50. [Crossref]
- Lococo F, Galeone C, Formisano D, Bellafiore S, Filice A et al. (2017) 18F-fluorodeoxyglucose positron emission tomographic scan in solid-type p-stage-I pulmonary adenocarcinomas: what can produce false-negative results? Eur J Cardiothorac Surg 51: 667-673. [Crossref]
- Rami-Porta R, Wittekind C, Goldstraw P (2005) Complete resection in lung cancer surgery: proposed definition. Lung Cancer 49: 25-33. [Crossref]
- Travis WD, Brambilla E, Burke AP, Marx A, Nicholson AG (2015) World Health Organization, International Agency for Research on Cancer, International Association for the Study of Lung Cancer, International Academy of Pathology. Pathology and Genetics of Tumours of the Lung, Pleura, Thymus and Heart. IARC Press.
- Filosso PL, Rena O, Guerrera F, Moreno Casado P, Sagan D et al. (2015) Clinical management of atypical carcinoid and large-cell neuroendocrine carcinoma: a multicentre study on behalf of the European Association of Thoracic Surgeons (ESTS) Neuroendocrine Tumours of the Lung Working Group†. Eur J Cardiothorac Surg 48: 55-64. [Crossref]
- Hermans BCM, Derks JL, Thunnissen E, van Suylen RJ, den Bakker MA et al. (2019) Prevalence and prognostic value of PD-L1 expression in molecular subtypes of metastatic large cell neuroendocrine carcinoma (LCNEC). Lung Cancer 130: 179-186. [Crossref]
- Lococo F, Cesario A, Paci M, Filice A, Versari A et al. (2014) PET/CT assessment of neuroendocrine tumors of the lung with special emphasis on bronchial carcinoids. Tumour Biol 35: 8369-8377. [Crossref]
- Takada K, Toyokawa G, Okamoto T, Baba S, Kozuma Y et al. (2017) Metabolic characteristics of programmed cell death-ligand 1-expressing lung cancer on 18 F-fluorodeoxyglucose positron emission tomography/computed tomography. Cancer Med 6: 2552-2561. [Crossref]
- Kim HS, Lee JH, Nam SJ, Ock CY, Moon JW et al. (2018) Association of PD-L1 Expression with Tumor-Infiltrating Immune Cells and Mutation Burden in High-Grade Neuroendocrine Carcinoma of the Lung. J Thorac Oncol 13: 636-648. [Crossref]
- Tsoukalas N, Baxevanos P, Aravantinou-Fatorou E, Tolia M, Galanopoulos M et al. (2018) Advances on systemic treatment for lung neuroendocrine neoplasms. Ann Transl Med 6: 146. [Crossref]