Evaluation of Immunologic Function of Peripheral Blood Monocytes from Schizophrenic Patients in Response to Toxoplasma Gondii
A B S T R A C T
Background: It has been suggested that the function of myeloid immune cells, especially macrophages in schizophrenia patients (SCZ), is impaired. Considering the role of macrophages in induction of inflammatory responses, the purpose of this study is to examine the response of monocyte-derived macrophages (MDM) of schizophrenia patients to Toxoplasma gondii (T. gondii) challenge.
Materials and Methods: MDMs were generated from 20 SCZ and 10 healthy controls (HC). The cells were exposed to T. gondii. The Cytokine (IL-10, IL-12, IL-6, and TNF-α) and nitric oxide (NO) productions were measured. The expression of miR146a and miR155 was examined using qPCR.
Results: The level of NO was significantly higher in the supernatant of MDMs of SCZ compared with the HC (P≤0.05) in response to T. gondii. There was no difference in cytokine (IL-10, IL-12, IL-6, and TNF-α) production of SCZ compared to the controls. The effect of miR-155/ miR-146a on inflammatory cytokine production was confirmed using anti-miRNAs. There were no significant effect in miR-155/ miR-146a expression of macrophages of schizophrenia patients to T. gondii compared to control.
Conclusion: In this study, although the cytokine response and the amount of miR-155/ miR-146a expression of macrophages to T. gondii was not significantly different between the schizophrenia patients and the healthy subjects, the significant differences in the production of nitric oxide strengthen the hypothesis of the functional failure of these cells.
Keywords
Schizophrenia, T. gondii, monocyte, miR-155, miR-146a
Introduction
Schizophrenia (SCZ) is a neurodevelopmental disorder with a complex etiology that includes genetics and environmental factors [1, 2]. The contributing factors work by affecting the immune system, which appears as changes in the level of immunology markers in blood, cerebrospinal fluid and brain tissue of schizophrenia patients [3, 4]. The dysfunction of brain macrophages and peripheral monocytes has been hypothesized (microglial hypothesis) to be involved in the development of the disease [5]. Macrophages are important cells of the immune system that are differentiated from monocytes and play a pivotal role in the elimination of pathogens, modulation of adaptive immunity, induction of inflammation or tissue repair, and work as scavengers for clearing dead cells and waste molecules [6].
However, macrophages have been considered in schizophrenia due to the induction of cytokine-mediated neurodegenerative inflammation and participation in neuronal synapses formation through cell-cell contact [7-9] . One of the ways for schizophrenia to be treated is the recovery of a correct immune system through the direction of anti-inflammatory macrophages or reduction of their induced inflammation. Non-steroidal anti-inflammatory medications (NSAIDs) with both analgesic and anti-inflammatory activities are administered to reduce inflammation [10-12].
However, NSAIDs like ibuprofen, diclofenac, naproxen sodium, and acetylsalicylic acid that act through cyclooxygenase-1 and 2 inhibition have a controversial role in macrophage function, especially if administered chronically [13-15]. In addition, macrophages display a spectrum of diverse phenotypes depending on environmental conditions like chronic inflammation [16]. For example, in Type 2 diabetes, the M1 macrophage is induced, which prevents insulin secretion through the IL-1β production, so IL-1R antagonists and anti-IL-1β-neutralizing antibodies will have a therapeutic effect [17]. In the case of atherosclerosis that is induced by M1 macrophages, the induction of PPAR-γ as a regulatory factor for macrophage lipid metabolism and inflammatory responses will be effective [18]. Therefore, the exact recognition of the phenotypic and functional characteristics of the macrophages of schizophrenic patients will help to find the correct way to control their function. Various studies have characterized the brain microglia or peripheral blood monocytes of schizophrenic people in the aspects of cell surface marker, phagocytosis, cytokine production, chemokine/complement receptors, and neural interaction [19-21].
Considering that the stimulation of macrophages with pathogen-associated molecular patterns or an infectious agent is one of the best methods for evaluating their function, in this study, we encountered schizophrenic macrophages with Toxoplasma gondii (T. gondii) and compared their immune response with the normal group. Toxoplasma gondii is among the infectious agents that causes neurodegenerative diseases and is a prime candidate of schizophrenia development [22]. For this purpose, PBMC isolated monocytes were differentiated to macrophages and infected with T. gondii. The Cytokine and nitric oxide responses were measured. In addition, regarding the role of microRNA in schizophrenia development and macrophage polarization, the miR-146a and miR-155 expression and their effect on cytokine production by infected macrophages were assessed [23].
Materials and Methods
I Subjects
This study was conducted at the Roozbeh Hospital affiliated with the Tehran University of Medical Sciences (Tehran, Iran) in 2016. Blood samples were derived from 20 schizophrenia patients and 10 healthy controls. The schizophrenia diagnosis was confirmed by psychiatrists using the Diagnostic and Statistical Manual of Mental Disorders (DSM-IV). All participants signed an informed consent form prior to any involvement. The sample size was based on the lowest number of patients that could provide statistical analysis and evaluation of similar studies [24, 25]. The inclusion criteria for the healthy controls were: (i) no family history of mental disorder; (ii) no antidepressant, antipsychotic, or mood-stabilizing drugs during the last one month; and (iii) normal C-reactive protein (CRP) level and erythrocyte sedimentation rate (ESR) value. The exclusion criteria for both the patient and the control group were as follows: (i) use of any non-psychotropic drugs interfering with immune function; (ii) acute infections and allergic/inflammatory responses for at least one month prior to blood sampling; (iii) chronic medical illnesses known to be accompanied by changes in immune functions such as autoimmune disorders, inflammatory bowel disease, and acquired immunodeficiency syndrome; and (iv) alcohol and drug abuse. All participants were non-smokers and non-obese. This study was approved by the Medical Ethics Committee of the Tarbiat Modares University.
II Generation of MDMs
Peripheral blood mononuclear cells (PBMCs) were isolated by performing a Ficoll-Paque™ PLUS gradient (GE Healthcare, UK) according to the standard protocol, and subsequently, monocytes were isolated from the PBMCs using anti-CD14 magnetic beads (Miltenyi Biotec GmbH, Germany) according to the manufacturer’s protocol. Cell purity was determined by flow cytometry using directly conjugated anti-CD14 antibodies (DakoCytomation) and the mean CD14positive cells were 94%. To obtain the macrophages from the monocytes, CD14+ cells were immediately washed and seeded at 5×10⁵ cells per well of 4-well plates for each sample. The monocytes were cultured in a complete RPMI 1640 medium supplemented with 10% heat-inactivated fetal calf serum (HyClone Laboratories, Logan, UT) and 5% heat-inactivated normal human AB serum (Sanquin, the Netherlands), 100 U/mL penicillin, 100 mg/mL streptomycin, 2 mM L-glutamine, and incubated at 37ᵒC, 5% CO2 for seven days [26].
III Parasites
Tachyzoites of the virulent RH strain of T. gondii were harvested from the peritoneal fluid of the BALB/c mouse, five days after the intraperitoneal injection of tachyzoites. The suspended parasite was collected by centrifugation of the peritoneal fluid at 2000 rpm, 10 min, 4°C. After washing the obtained parasite with RPMI-1640 (Gibco) medium, the number and viability of tachyzoites were determined by the Trypan blue exclusion in a hemocytometric chamber.
IV Cells Stimulation and In Vitro Study Groups
MDM culture from both the healthy subjects and schizophrenia patients was divided into two groups, control and T. gondii stimulated, respectively. After seven days, the culture of the monocyte and macrophages of the test groups were infected with the tachyzoites of T. gondii at 1:5 ratio for 12 hours. According to the preliminary study, at that time an average of 95% of the macrophages would be infected with at least one T. gondii. At the end of the macrophage-T. gondii incubation time, all the macrophages of the control and test groups were washed and replaced with fresh media. Twenty-four hours post incubation at 37ᵒC, 5% CO2, the medium was harvested to measure the secretion of cytokines/ nitric oxide and the cells were lysed for total RNA extraction. All treatments were done in triplicate.
V Cytokine Measurement
Twenty-four hours post in vitro treatment of the MDMs with the parasite, the supernatant of both the control and the test groups were collected and stored at −20oC until use. The IL-10, IL-12, IL-6, and TNF-α concentrations were measured by the ELISA method using R&D systems-kits (Minneapolis, MN, USA) according to the manufacturer's instructions. The ELISA assay was performed in triplicate for each sample and the cytokine concentrations were calculated using standard curves.
VI Nitric oxide Measurement
Twenty-four hours post in vitro treatment of the MDMs with the parasite, the supernatant of both the control and test groups were collected and analyzed for nitric oxide (NO) production. For this purpose, 100ml of the Griess reagent was added to 100ml of the supernatant. The absorbance of the developed color was read at 540 nm. NO concentrations were calculated using a standard solution of sodium nitrite (Merck) prepared in culture media. All in vitro treatments were analyzed in triplicate and data reported as mean ± SD.
VII Transfection with miR-146a and miR-155 Inhibitors
To determine the effective role of mir-146a and miR-155 on the MDMs’ response in T. gondii infection, a microRNAs inhibition assay was used. The MDMs were prepared from the healthy control. The MDMs of each case were cultured at 5×10⁵ cells per wells and divided into three in vitro study groups that were transfected with: LNA anti-155(50 nM), LNA anti-146a(50 nM), and scramble siRNA(50 nM). All groups were transfected 24 hours before infecting the MDMs with toxoplasma, using the Lipofectamine 2000 transfection reagent (Invitrogen) in the OptiMEM medium (Gibco) according to the manufacturer's protocol. Scrambled siRNA does not target any known miRNA in the macrophage. The MiRCURY LNA™ microRNA inhibitor and scramble siRNA were purchased from EXIQON, Denmark. The LNA anti-miRs and scramble sequences that were used are shown in (Table 1). Twenty-four hours after the LNA anti-miRs and scramble transfection, the medium was replaced with fresh RPMI containing 10% FBS. Simultaneously with the replacement, the wells of the samples were infected with T. gondii for 12 h (ratio of 5 parasites per cell). Twelve hours after stimulation, the medium was replaced with fresh RPMI containing 10% heat-inactivated fetal calf serum and 5% heat-inactivated normal human AB serum, 100 U/mL penicillin, 100 mg/mL streptomycin, and 2 mM L-glutamine. Twenty-four hours later, the medium was harvested to measure the secretion of cytokines and the cells were lysed for total RNA isolation according to the methods described above.
Table 1: Oligonucleotide sequences of the primers designed for miRNA measurement.
|
Oligonucleotide name |
Product name |
Sequence (5′—3′) |
Product by |
|
hsa-miR-155-5p |
Forward primer |
CCGTTAATGCTAATCGTGA |
Macrogen |
|
Reverse primer |
GAGCAGGGTCCGAGGT |
||
|
probe |
FAM-AGGGGTGTCGTATGCAGTGC-BHQ1 |
||
|
RT |
GTCGTATGCAGAGCAGGGTCCGAGGTATTCGCACTGCATACGACACCCCT |
||
|
MiRCURY LAN Inhibitor |
CCTATCACGATTAGCATT |
Exiqon |
|
|
hsa-miR-146a-5p |
Forward primer |
CCGATGAGAACTGAATTCC |
Macrogen |
|
Reverse primer |
GAGCAGGGTCCGAGGT |
||
|
probe |
FAM -TGGGTTGTCGTATGCAGTGC-BHQ1 |
||
|
RT |
GTCGTATGCAGAGCAGGGTCCGAGGTATTCGCACTGCATACGACAACCCA |
||
|
MiRCURY LAN Inhibitor |
ACCCATGGAATTCAGTTCTC |
Exiqon |
|
|
has-SNORD-47 |
Forward primer |
ATCACTGTAAAACCGTTCCA |
Macrogen |
|
Reverse primer |
GAGCAGGGTCCGAGGT |
||
|
probe |
FAM-TGATTCTGAGGTTGTCGTATGCA-BHQ1 |
||
|
RT |
GTCGTATGCAGAGCAGGGTCCGAGGTATTCGCACTGCATACGACAACCTC |
||
|
Scramble siRNA |
Scramble siRNA |
GTGTAACACGTCTATACGCCCA |
Exiqon |
VIII miR-146a and miR-155 Quantitation
The total RNA was extracted from the MDM cells of the test and control groups by a Trizol reagent (Gibco BRL) according to the manufacturer’s instructions. The total RNA concentration and purity were determined with the NanoDrop 2000 (Thermo Scientific, MA) and stored at −80ᵒC until the cDNA synthesis was performed. About 10 ng total RNA in a final volume of 20 μL, were reversely transcribed into cDNA using the Thermo Scientific Revert Aid First Strand cDNA Synthesis Kit (#K1622) as described in the manufacturer’s protocol. Real-time PCR reactions were performed in duplicates in a final volume of 20 μL containing 10 μL Real Q PCR 2x Master Mix for Probe, High ROX (Ampliqon, Denmark), 0.2 μL Special Probe, 1μL primer mix (2 pmol/mL), and 5 ng of cDNA. Oligonucleotides were synthesized by Macrogen (South Korea) and are shown in (Table 1). Real-time PCR was performed on the Step One Plus Real-Time PCR System (Applied Biosystems) in two steps with the following thermal settings: 15 min at 95°C for initial enzyme activation followed by 40 amplification cycles (each 15 seconds at 95°C, 30 seconds at 60°C with fluorescent detection). The relative expression levels were normalized (2Δct) to RNU47 as the endogenous control and analyzed using the REST® 2009 software, which compares target and control samples using 2000 iterations [27].
IX Statistical Analyses
The one-way Analysis of Variance (ANOVA) was used to compare the supernatant levels of cytokines and NO between the experimental groups. The data are presented as mean ± SE. The differences between the mean values were considered significant when P<0.05. The data were analyzed using the GraphPad Prism 5.0 software (Graph Prism Inc., San Diego, Ca). The relative expression levels were normalized (2Δct) to RNU47 as the endogenous control and analyzed using the REST® 2009 software, which compares target and control samples using 2000 iterations [27, 28].
Table 2: Clinical and demographic characteristics of patient and control groups.
|
Groups Parameters |
Patient N=20 |
Control N=10 |
p value |
|
Sex (M/F) |
20(10/10) |
10(5/5) |
0.930 |
|
Age (years, mean ± SD) |
34.02±5.81 |
33.52±5.23 |
0.523 |
|
Age of onset (years, mean ± SD) |
24.30±4.29 |
|
0.000 |
|
Duration of illness (years, mean ± SD) |
4.35±2.81 |
|
|
|
Positive symptoms (mean ± SD) |
15.48±5.32 |
|
0.000 |
|
Negative symptoms (mean ± SD) |
14.61±5.09 |
|
0.002 |
|
General psychopathology (mean ± SD) |
30.65±6.23 |
|
0.000 |
Results
I Demographic Data
Table 2 shows the demographic characteristics of the patient and control groups. Our results showed that the mean duration of illness was 4.35±2.81 years in the patient group. The positive and negative symptoms of the schizophrenia groups were assessed using a Positive and Negative Syndrome Scale (PANSS) [29].
II Inflammatory Cytokine Production in Response to T. gondii
Forty-eight hours after the encounter of both schizophrenia and control MDMs with T. gondii, the level of IL-6, TNF-α, and IL-12 were measured by ELISA. Our results showed that there was no significant difference in the defined cytokine production between the schizophrenia and control groups before and after the T. gondii challenge, although the schizophrenia cases demonstrated a higher amount of TNF-α production. After the T. gondii challenge, the mean cytokine production of the schizophrenia patients were induced significantly (P≤0.05) from 140.6 ± 24.6 pg/ml (IL-6), 68.81 ± 11.63 pg/ml (TNF-α), and 12.6 ± 1.49 pg/ml (IL-12) to 43.12 ± 7.36 pg/ml, 24.3 ± 4.15 pg/ml, and 5.58 ± 1.6 pg/ml, respectively. A similar increase pattern was obtained in the cytokine level of the control group’s MDMs in response to the T. gondii (Figure 1). In addition, a small increase was observed in the level of IL-10 production in both the schizophrenia and control MDMs in response to the T. gondii, which was not statistically different (Figure 1, A-D).
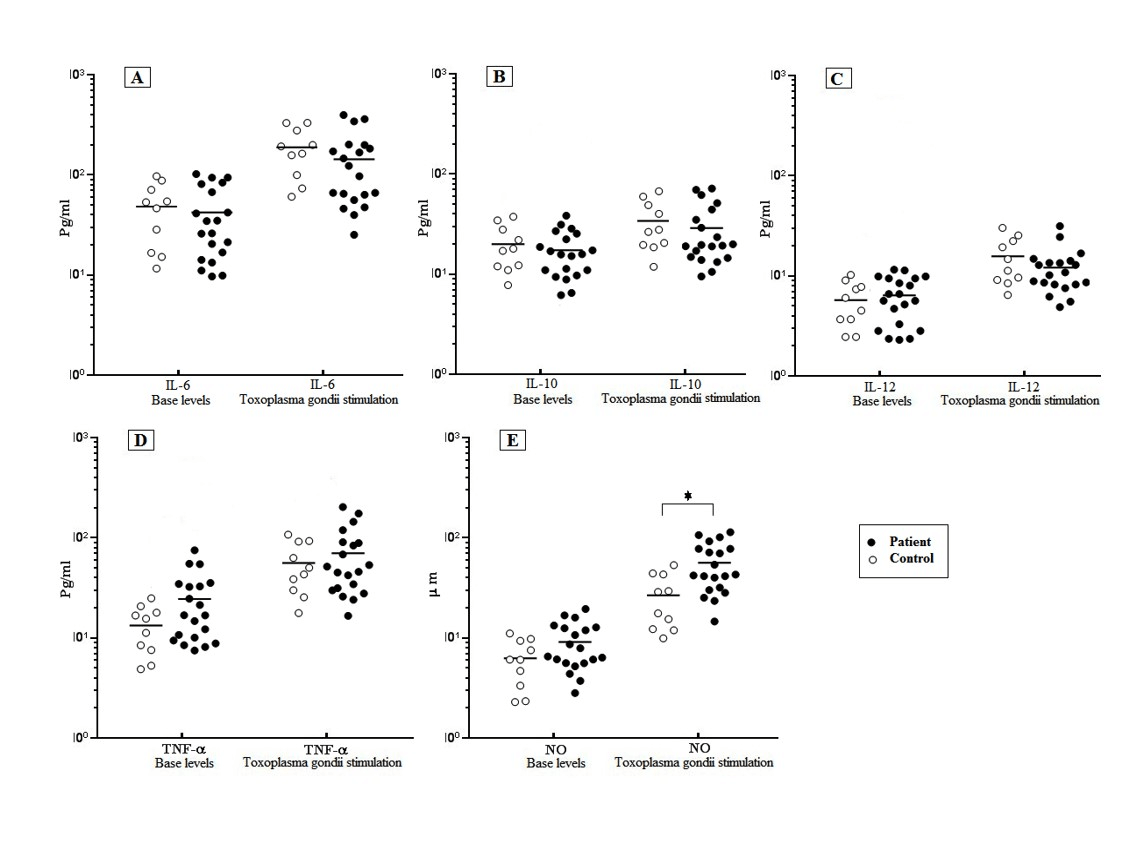
Figure 1: Level of cytokines response of MDMs of schizophrenia patients and controls in response to T. gondii stimulation.
T. gondii challenge significantly induced the level of IL-6 compared to Basel level in control groups (P = 0.0013) and patients (P =0.0013) (A).No significant increase in level of IL-10 in control and patient group after T. gondii challenge (B). Increased level of TNF-α and IL-12 compared to Basel level were observed, in control groups (P = 0.042) (P =0.008) and patients (P=0.008) (P =0.009), respectively (C, D) NO secretion was significantly higher in the patient group(47.1 ± 5.66 μ/m) as compared to the healthy control (27.18 ± 5.06 μ/m) after T. gondii stimulation (P=0.01) , (E). It was no significant difference in terms of levels of IL-6, TNF-α, IL-12 and IL-10 between the patient and control groups after T. gondii challenge (A-D). The data represent the means ± SE.
III Nitric Oxide Production in Response to T. gondii
The results showed a significantly increased level of NO from 9.31 ± 1.08 μM to 47.1 ± 5.66 μM in the MDMs of the schizophrenia patients in response to the T. gondii challenge. A significantly increased level of NO (27.18 ± 5.06 μ/m) was observed in the control group after the T. gondii challenge compared to the basal level of 6.51 ± 1.03 μM. The NO secretion was significantly (P≤0.05) higher in the patient group (47.1 ± 5.66 μ/m) as compared to the healthy control (27.18 ± 5.06 μ/m) after the T. gondii stimulation ( Figure 1 E).
IV miR-146a and miR-155 Effects on MDMs Cytokines Production
To determine the effect of miR-146a and miR-155 on the MDMs’ cytokine production in response to the T. gondii infection, the MDMs of healthy subjects were transfected with anti-miR-146a LNA, anti-miR-155 LNA, and Scramble siRNA, 24 hours before the T. gondii infection. Forty-eight hours post infection, a significant reduction in both micro RNAs was confirmed by the Real-time PCR analysis, and the supernatant was assessed for cytokine production. According to the obtained results, the infected MDMs showed a significant (P≤0.05) increase in the IL-6 (307.1 ± 48.53 pg/ml) and TNF-α (247.4 ± 18.53 pg/ml) levels in the presence of the anti-miR-146a LNA compared to the IL-6 (189.8 ± 17.22 pg/ml) and TNF-α (59.1 ± 13.91 pg/ml) production in the Scramble treated groups. The MDMs’ treatment with anti-miR-146a LNA had no significant effect on the IL-10 and IL-12 production.
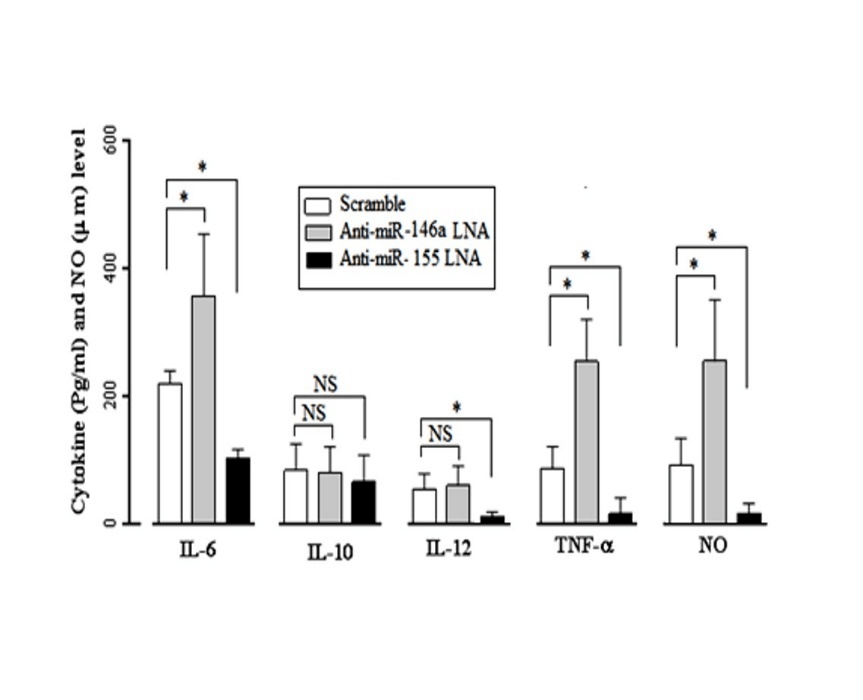
Figure 2: Changes in the expression of IL-6, IL-10, IL- 12, TNF-α and NO in Toxoplasma-stimulated in the miR-146a and miR-155-inhibited MDMs. In infecting MDMs with toxoplasma, IL-6 levels in the presence of anti-miR-146a LNA (307.1 ± 48.53 pg/ml) show a significant increase (P=0.04) compared to Scramble's presence (189.8 ± 17.22 pg/ml) and TNF-α levels in the presence of anti-miR-146a LNA (247.4 ± 18.53 pg/ml) show a significant increase (P=0.045) compared to Scramble's presence (59.1 ± 13.91 pg/ml), while presence of anti-miR-146a LNA no significant effect on the production of IL-10 and IL-12. Conversely in infecting MDMs with toxoplasma, anti-miR-155 LNA significant decrease IL-6 (75.66 ± 9.04 pg/ml), IL-12 (6.52 ± 1.81 pg/ml), and TNF-α (16.67 ± 3.24 pg/ml) compared to Scramble's presence IL-6 (189.8 ± 17.22 pg/ml), IL-12 (17.81 ± 3.01 pg/ml) and TNF-α (59.1 ± 13.91 pg/ml) (For all P< 0.05) and presence of anti-miR-155 LNA no significant effect on the production of IL-10 in MDMs response. NO levels in the presence of anti-miR-146a LNA (212.1 ± 33.4 μ/m) show a significant increase (P=0.031)
Conversely, the anti-miR-155 LNA treated MDMs showed a significant (P≤0.05) decrease in the IL-6 (75.66 ± 9.04 pg/ml), IL-12 (6.52 ± 1.81 pg/ml), and TNF-α (16.67 ± 3.24 pg/ml) production compared to the Scramble treated groups with higher IL-6 (189.8 ± 17.22 pg/ml), IL-12 (17.81 ± 3.01 pg/ml), and TNF-α (59.1 ± 13.91 pg/ml) production. The anti-miR-155 LNA had no significant effect on the IL-10 production of the T. gondii infected MDMs (Figure 2).
V miR-146a and miR-155 effect on Nitric oxide Production
The NO levels in the presence of anti-miR-146a LNA (212.1 ± 33.4 μ/m) showed a significant increase (P=0.031) compared to the Scramble treated groups (47.51±26.15 μ/m). Conversely, the NO levels in the presence of anti-miR-155 LNA (14.11 ± 9.53 μ/m) showed a significant decrease (P=0.012) compared to the Scramble's presence (47.51±26.15 μ/m) in the healthy MDMs in response to the T. gondii (Figure 2).
VI miR-146a and miR-155 Expression in Response to T. gondii
The expression of miR-146a and miR-155 by MDMs has been reported in (Figure 2). Our results showed that the miR-146a and miR-155 expression was significantly (P≤0.05) up-regulated in response to the T. gondii challenge in the control (9.7 and 9.6 fold) and schizophrenia patients (10.3 and 8.6), respectively. No significant difference was observed between the patients and control (Figure 3).
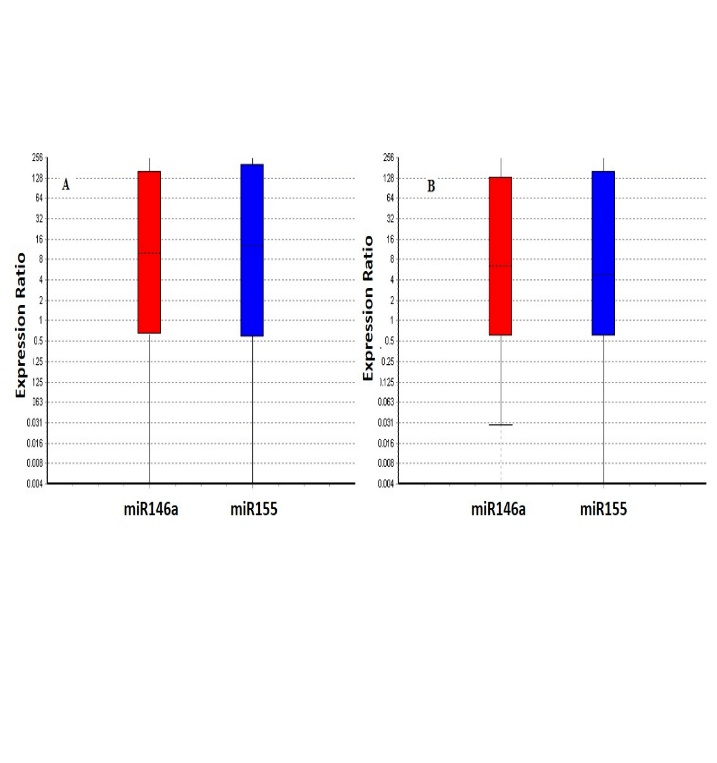
Figure 3: Relative expression of miR-155 and miR-146a in control (A) and patients (B) after toxoplasma stimulation. Our results showed that, miR-155 and miR-146a expression was significantly upregulated in response to T. gondii challenge in the patients and control (all ≤ 0.05), but no statistically significant difference was found between patients and controls . Boxes represent the interquartile range, or the middle 50% of observations. The dotted line represents the median gene expression. Whiskers represent the minimum and maximum observations.
Discussion
Schizophrenia is a chronic mental illness that affects approximately 1% of the general population worldwide [30]. It is a heterogeneous disorder and is considered a multifactorial disease including prenatal infection, obstetric complications, genetic vulnerabilities, and Immunologic disorders [31-33]. One of the more recent hypotheses proposes that an aberrant function of the immune system is associated with schizophrenia [34]. The impaired functioning of the myeloid immune cells in schizophrenic patients has attracted much attention over the past years. Macrophages, as a myeloid cell in the immune system, play an important role in the formation and direction of innate and adaptive immune responses. miRNAs can elicit a broad effect on inflammatory gene expression and thus, have important implications for inflammation. The expression of miR-146a and miR-155 contributes to the regulation of the inflammatory response [35]. Several studies have defined the pivotal role of miR-146a and miR-155 in the function of macrophages [36].
In this study, monocytes were taken from both schizophrenia patients and the control and were found to be macrophages in vitro [37]. We screened the MDMs of schizophrenia patients for (1) the expression of miR146a and miR155 and (2) the production of TNF-α, IL-10, IL-12, IL-6, and nitric oxide (NO) in macrophages in response to T. gondii compared with healthy controls. Also, we examined the effects of miR-146a and miR-155 on the production of IL-6, TNF-α, IL-12, IL-10, and nitric oxide (NO) responses to T. gondii in the MDMs in healthy individuals. According to our information, this is the first study to investigate the response of schizophrenic macrophages to living intracellular pathogens. Our data demonstrated that the T. gondii infection significantly induced the expression of miR-146a and miR-155 in the MDMs of patients and controls. Previous studies have shown that MicroRNAs play an important role in the immune response processes under normal and pathological conditions [38].
Moreover, we did not detect significant alterations in the expression level of miR-155 and miR-146a between the patients and controls. Also, our data demonstrated that the miR-155 increased the IL-12, TNF-α, IL-6, and NO production, and the miR-155 decreased the TNF-α, IL-6, and NO production in macrophages after the T. gondii infection. These findings suggest that miR-146a and miR-155 act as a crucial element in modulating the macrophage's response to the T. gondii infection.
Some previous studies have shown that miR-146a modulates the production of proinflammatory cytokines in dendritic cells, and a decrease in the expression of miR-146a leads to an excessive increase in the production of IL-6 and TNF-α [39-41]. MiR-146a attenuates iNOS and NO production in infected macrophages with intracellular bacteria [42]. MiR-155 is required for IL-12 expression and enhances the expression of NO and proinflammatory cytokine in macrophages after a lipopolysaccharide challenge [43, 44]. miR-155 direct the inflammatory responses through by targeting TNF-α , transcription factor PU.1, SH2 domain-containing inositol 5-phosphatase 1 (SHIP1) and suppressor of cytokine signaling 1 (SOCS1) while the miR-146a affects TNFR-associated factor 6 (TRAF6), Interleukin-1 receptor-associated kinase 1and 2 (IRAK1and IRAK2) and Interferon regulatory factor 3 and 5( IRF3 and IRF5) [36].
Based on our findings, it is suggested that in the face of an increased expression of miR-146a and miR-155 in the T. gondii stimulated macrophage, the role of miR-155 is dominant. The T. gondii infection activates the MDM cells (in patients and controls), leading to the transcription of inflammatory cytokines, which result in the activation of the immune response against this pathogen. Except for a significant change in the level of NO after the MDMs’ stimulation with T. gondii, we did not detect significant alterations in the secretion of IL-6, TNF-α, IL-12, and IL-10 responses between the patients and controls.
The results of this study on cytokines is consistent with the study of Paul R. Ormel et al (37) while not consistent with the results of some other studies [45]. The result of our study. In this research we found a significant increase in NO in schizophrenic patients. It suggests that the NO response to stimuli might be affected in schizophrenia patients, although more research is needed in this area. Nitric oxide (NO) is an intermediary gaseous cellular messenger in cell communication in the brain that increases the release of dopamine, acetylcholine, and glutamate[46].
The role of NO in the brain is multifunctional. NO regulates the proliferation, functions, and fates of neural stem cells, and affects adult neurogenesis [47, 48]. It also plays a pivotal role in neural differentiation, long-term potential (LTP) changes in the shape of synapses, memory, and learning [49-52]. Some studies have suggested that NO in the central nervous system (CNS) is cytoprotective at physiological concentrations and has a cytotoxic effect at higher levels [53-55]. The pathologic NO is known as one of the main mediators in brain damage, including glutamate neurotoxicity, hypoxic-ischemic injury, oxidative stress, and neurodegeneration [56, 57]. Some studies have suggested the possibility of nitric oxide interference in the pathophysiology of some psychiatric disorders such as bipolar disorder, depression, and schizophrenia [58, 59].There are different studies on the serum levels of NO metabolites in schizophrenia with contradictory results [60-63].
However, the present study has two features. The first one is that the function of monocytes is examined in cell culture conditions, not in the serum that is affected by medication, (65) psychosocial stress (66), and sleep disturbances (67, 68). Second, the function of monocytes has been investigated in response to an external stimulus such as Toxoplasma, which can show the true orientation of macrophage function.
In summary, in this study, we did not detect significant alterations in IL-6, TNF-α, IL-12, and IL-10 between schizophrenia patients and controls after the stimulation of MDMs with T. gondii except than NO. This suggests that NO may be involved in the pathogenesis of schizophrenia, which needs more investigation.
In addition, although inducible nitric oxide synthase gene is one of the targets of miR155, no difference in its expression were observed between healthy person and schizophrenia. Therefore, considering the effectiveness of miRNAs in the diagnosis and treatment of diseases, determination of the level of other miRNAs that are involved in nitric oxide induction will be useful in schizophrenia patients.
Acknowledgments
We wish to express our gratitude to the participants and their families. We also appreciate the contributions of Dr. Hamid Reza Naghavi (Tehran University of Medical Sciences, Tehran, Iran) and Dr. Afra Khosravi (Ilam University of Medical Sciences, Ilam, Iran). We also wish to thank all the medical staff of Roozbeh Hospital for their cooperation.
Conflicts of Interest
None.
Highlights
• The level of NO was significantly higher in the supernatant of MDMs of schizophrenia compared with the control after stimulation with T. gondii.
• Cytokine production in the supernatant of MDMs of schizophrenia had no significant difference compared with the control after stimulation with T. gondii.
• The expression of miR-155 and miR-146a showed no significant difference between schizophrenia and control in response to T. gondii.
Article Info
Article Type
Research ArticlePublication history
Received: Mon 06, Jan 2020Accepted: Mon 03, Feb 2020
Published: Wed 12, Feb 2020
Copyright
© 2023 Ahmad Zavaran Hosseini . This is an open-access article distributed under the terms of the Creative Commons Attribution License, which permits unrestricted use, distribution, and reproduction in any medium, provided the original author and source are credited. Hosting by Science Repository.DOI: 10.31487/j.CEI.2020.01.05
Figures & Tables
Table 1: Oligonucleotide sequences of the primers designed for miRNA measurement.
|
Oligonucleotide name |
Product name |
Sequence (5′—3′) |
Product by |
|
hsa-miR-155-5p |
Forward primer |
CCGTTAATGCTAATCGTGA |
Macrogen |
|
Reverse primer |
GAGCAGGGTCCGAGGT |
||
|
probe |
FAM-AGGGGTGTCGTATGCAGTGC-BHQ1 |
||
|
RT |
GTCGTATGCAGAGCAGGGTCCGAGGTATTCGCACTGCATACGACACCCCT |
||
|
MiRCURY LAN Inhibitor |
CCTATCACGATTAGCATT |
Exiqon |
|
|
hsa-miR-146a-5p |
Forward primer |
CCGATGAGAACTGAATTCC |
Macrogen |
|
Reverse primer |
GAGCAGGGTCCGAGGT |
||
|
probe |
FAM -TGGGTTGTCGTATGCAGTGC-BHQ1 |
||
|
RT |
GTCGTATGCAGAGCAGGGTCCGAGGTATTCGCACTGCATACGACAACCCA |
||
|
MiRCURY LAN Inhibitor |
ACCCATGGAATTCAGTTCTC |
Exiqon |
|
|
has-SNORD-47 |
Forward primer |
ATCACTGTAAAACCGTTCCA |
Macrogen |
|
Reverse primer |
GAGCAGGGTCCGAGGT |
||
|
probe |
FAM-TGATTCTGAGGTTGTCGTATGCA-BHQ1 |
||
|
RT |
GTCGTATGCAGAGCAGGGTCCGAGGTATTCGCACTGCATACGACAACCTC |
||
|
Scramble siRNA |
Scramble siRNA |
GTGTAACACGTCTATACGCCCA |
Exiqon |
Table 2: Clinical and demographic characteristics of patient and control groups.
|
Groups Parameters |
Patient N=20 |
Control N=10 |
p value |
|
Sex (M/F) |
20(10/10) |
10(5/5) |
0.930 |
|
Age (years, mean ± SD) |
34.02±5.81 |
33.52±5.23 |
0.523 |
|
Age of onset (years, mean ± SD) |
24.30±4.29 |
|
0.000 |
|
Duration of illness (years, mean ± SD) |
4.35±2.81 |
|
|
|
Positive symptoms (mean ± SD) |
15.48±5.32 |
|
0.000 |
|
Negative symptoms (mean ± SD) |
14.61±5.09 |
|
0.002 |
|
General psychopathology (mean ± SD) |
30.65±6.23 |
|
0.000 |
T. gondii challenge significantly induced the level of IL-6 compared to Basel level in control groups (P = 0.0013) and patients (P =0.0013) (A).No significant increase in level of IL-10 in control and patient group after T. gondii challenge (B). Increased level of TNF-α and IL-12 compared to Basel level were observed, in control groups (P = 0.042) (P =0.008) and patients (P=0.008) (P =0.009), respectively (C, D) NO secretion was significantly higher in the patient group(47.1 ± 5.66 μ/m) as compared to the healthy control (27.18 ± 5.06 μ/m) after T. gondii stimulation (P=0.01) , (E). It was no significant difference in terms of levels of IL-6, TNF-α, IL-12 and IL-10 between the patient and control groups after T. gondii challenge (A-D). The data represent the means ± SE.
References
- Owen M J, N Craddock, M C O'Donovan (2010) Suggestion of roles for both common and rare risk variants in genome-wide studies of schizophrenia. Arch Gen Psychiatry 67: 667-673. [Crossref]
- van Os J, G Kenis, B P Rutten (2010) The environment and schizophrenia. Nature 468: 203-212. [Crossref]
- Trepanier M O, K E Hopperton, R Mizrahi, N Mechawar, R P Bazinet (2016) Postmortem evidence of cerebral inflammation in schizophrenia: a systematic review. Mol Psychiatry 21: 1009-1026. [Crossref]
- Coughlin J M, Y Wang, E B Ambinder, R E Ward, I Minn et al. (2016) In vivo markers of inflammatory response in recent-onset schizophrenia: a combined study using [(11)C]DPA-713 PET and analysis of CSF and plasma. Transll Psychiatry 6: e777. [Crossref]
- Upthegrove Rachel (2014) The immune system and schizophrenia: An update for clinicians. Vol 20.
- Epelman S, K J Lavine, G J Randolph (2014) Origin and functions of tissue macrophages. Immunity 41: 21-35. [Crossref]
- Manu P, C U Correll, M Wampers, A J Mitchell, M Probst et al. (2014) Markers of inflammation in schizophrenia: association vs. causation. World Psychiatry 13: 189-192. [Crossref]
- Gaskill Peter J, Loreto Carvallo, Eliseo A Eugenin, Joan W Berman (2012) Characterization and function of the human macrophage dopaminergic system: implications for CNS disease and drug abuse. J Neuroinflammation 9: 203. [Crossref]
- Bolego C, A Cignarella, B Staels, G Chinetti-Gbaguidi (2013) Macrophage function and polarization in cardiovascular disease: a role of estrogen signaling? Arterioscler Thromb Vasc Biol 33: 1127-1134. [Crossref]
- Hussain M, A Javeed, M Ashraf, N Al-Zaubai, A Stewart et al. (2012) Non-steroidal anti-inflammatory drugs, tumour immunity and immunotherapy. Pharmacol Res 66: 7-18. [Crossref]
- Sommer I E, L de Witte, M Begemann, R S Kahn (2012) Nonsteroidal anti-inflammatory drugs in schizophrenia: ready for practice or a good start? A meta-analysis. J Clin Psychiatry 73: 414-419. [Crossref]
- Andrade C (2016) Anti-inflammatory strategies in the treatment of schizophrenia. Expert Rev Clin Pharmacol 9: 161-163. [Crossref]
- Na Y R, Y N Yoon, D Son, D Jung, G J Gu et al. (2015) Consistent inhibition of cyclooxygenase drives macrophages towards the inflammatory phenotype. PLoS One 10 : e0118203. [Crossref]
- Prechel M Margaret, Charley Ding, Remy L Washington, Meghan S Kolodziej, M Rita Young (2000) In Vivo Indomethacin Treatment Causes Microgial Activation in Adult Mice. Neurochem Res 25: 357-362. [Crossref]
- Aid SR Langenbach, F Bosetti (2008) Neuroinflammatory response to lipopolysaccharide is exacerbated in mice genetically deficient in cyclooxygenase-2. J Neuroinflammation 5: 17. [Crossref]
- Parisi L, E Gini, D Baci, M Tremolati, M Fanuli et al. (2018) Macrophage Polarization in Chronic Inflammatory Diseases: Killers or Builders? J Immunol Res 2018: 8917804. [Crossref]
- Galván-Peña, Silvia Luke A J O’Neill (2014) Metabolic Reprograming in Macrophage Polarization. Front Immunol 5: 420. [Crossref]
- Bouhlel M A, B Derudas, E Rigamonti, R Dievart, J Brozek et al. (2007) PPARgamma activation primes human monocytes into alternative M2 macrophages with anti-inflammatory properties. Cell Metab 6: 137-143. [Crossref]
- Fillman S G, N Cloonan, V S Catts, L C Miller, J Wong et al. (2013) Increased inflammatory markers identified in the dorsolateral prefrontal cortex of individuals with schizophrenia. Mol Psychiatry 18: 206-214. [Crossref]
- Wohleb E S, J C Delpech (2017) Dynamic cross-talk between microglia and peripheral monocytes underlies stress-induced neuroinflammation and behavioral consequences. Prog Neuropsychopharmacol Biol Psychiatry 79: 40-48. [Crossref]
- Brown G C, J J Neher (2014) Microglial phagocytosis of live neurons. Nat Rev Neurosci 15: 209-216. [Crossref]
- Esshili A, S Thabet, A Jemli, F Trifa, A Mechri et al. (2016) Toxoplasma gondii infection in schizophrenia and associated clinical features. Psychiatry Res 245: 327-332. [Crossref]
- Liu G, E Abraham (2013) MicroRNAs in immune response and macrophage polarization. Arterioscler Thromb Vasc Biol 33: 170-177. [Crossref]
- Zeng L, M J Lindstrom, J A Smith (2011) Ankylosing spondylitis macrophage production of higher levels of interleukin-23 in response to lipopolysaccharide without induction of a significant unfolded protein response. Arthritis Rheum 63: 3807-3817. [Crossref]
- Brennand K, J N Savas, Y Kim, N Tran, A Simone et al. (2014) Phenotypic differences in hiPSC NPCs derived from patients with schizophrenia. Mol Psychiatry 20: 361-368. [Crossref]
- Lemaire Julien, Ghada Mkannez, Fatma Z Guerfali, Cindy Gustin, Hanène Attia (2013) MicroRNA Expression Profile in Human Macrophages in Response to Leishmania major Infection. PLoS Negl Trop Dis 7: e2478. [Crossref]
- Pfaffl MW, Horgan GW, Dempfle L (2002) Relative expression software tool (REST) for group-wise comparison and statistical analysis of relative expression results in real-time PCR. Nucleic Acids Res 30: e36. [Crossref]
- Livak K J, T D Schmittgen (2001) Analysis of relative gene expression data using real-time quantitative PCR and the 2(-Delta Delta C(T)) Method. Methods 25: 402-408. [Crossref]
- Emsley R, J Rabinowitz, M Torreman (2003) The factor structure for the Positive and Negative Syndrome Scale (PANSS) in recent-onset psychosis. Schizophr Res 61: 47-57. [Crossref]
- Perala J, J Suvisaari, S I Saarni, K Kuoppasalmi, E Isometsa et al. (2007) Lifetime prevalence of psychotic and bipolar I disorders in a general population. Arch Gen Psychiatry 64: 19-28. [Crossref]
- Markham J A, J I Koenig (2011) Prenatal stress: role in psychotic and depressive diseases. Psychopharmacol (Berl) 214: 89-106. [Crossref]
- Bersani Giuseppe, Quartini Adele, G Manuali, Angela Iannitelli, D Pucci et al. (2009) Influence of obstetric complication severity on brain morphology in schizophrenia: An MR study. 51: 363-371. [Crossref]
- De Lisi, Lynn E (2009) Searching for the true genetic vulnerability for schizophrenia. Genome Med 1: 14. [Crossref]
- Sekar A, A R Bialas, H de Rivera, A Davis, T R Hammond et al. (2016) Schizophrenia risk from complex variation of complement component 4. Nature 530: 177-183. [Crossref]
- Doxaki Christina, Sotirios C Kampranis, Aristides G Eliopoulos, Charalampos Spilianakis, Christos Tsatsanis (2015) Coordinated Regulation of miR-155 and miR-146a Genes during Induction of Endotoxin Tolerance in Macrophages. J Immunol 195: 5750-5761. [Crossref]
- Testa Ugo, Elvira Pelosi, Germana Castelli, Catherine Labbaye (2017) miR-146 and miR-155: Two Key Modulators of Immune Response and Tumor Development. Noncoding RNA 3 (3). [Crossref]
- Ormel Paul R, Hans C van Mierlo, Manja Litjens, Miriam E van Strien, Elly M Hol et al. (2017) Characterization of macrophages from schizophrenia patients. NPJ Schizophrenia 3: 41. [Crossref]
- Paladini Laura, Linda Fabris, Giulia Bottai, Carlotta Raschioni, George A Calin et al. (2016) Targeting microRNAs as key modulators of tumor immune response. J Exp Clin Cancer Res 35: 103. [Crossref]
- Park H , X Huang, C Lu, M S Cairo, X Zhou (2015) MicroRNA-146a and microRNA-146b regulate human dendritic cell apoptosis and cytokine production by targeting TRAF6 and IRAK1 proteins. J Biol Chem 290: 2831-2841. [Crossref]
- Zhao J L, D S Rao, M P Boldin, K D Taganov, R M O'Connell et al. (2011) NF-kappaB dysregulation in microRNA-146a-deficient mice drives the development of myeloid malignancies. Proc Natl Acad Sci U S A 108: 9184-9189. [Crossref]
- Boldin Mark, Konstantin D Taganov, Dinesh Rao, Lili Yang, Jimmy Zhao et al. (2011) miR-146a is a significant brake on autoimmunity, myeloproliferation, and cancer in mice. J Exp Med 208: 1189-1201. [Crossref]
- Li M, J Wang, Y Fang, S Gong, M Li et al. (2016) MicroRNA-146a promotes mycobacterial survival in macrophages through suppressing nitric oxide production. Sci Rep 6: 23351. [Crossref]
- Lind E F, D G Millar, D Dissanayake, J C Savage, N K Grimshaw et al. (2015) miR-155 Upregulation in Dendritic Cells Is Sufficient To Break Tolerance In Vivo by Negatively Regulating SHIP1. J Immunol 195: 4632-4640. [Crossref]
- Cardoso A L, J R Guedes, L Pereira de Almeida, M C Pedroso de Lima (2012) miR-155 modulates microglia-mediated immune response by down-regulating SOCS-1 and promoting cytokine and nitric oxide production. Immunology 135: 73-88. [Crossref]
- Miller B J, P Buckley, W Seabolt, A Mellor, B Kirkpatrick (2011) Meta-analysis of cytokine alterations in schizophrenia: clinical status and antipsychotic effects. Biol Psychiatry 70: 663-671. [Crossref]
- Zarrindast M R, M M Shendy, S Ahmadi (2007) Nitric oxide modulates state dependency induced by lithium in an inhibitory avoidance task in mice. Behav Pharmacol 18: 289-295. [Crossref]
- Gibbs SM (2003) Regulation of neuronal proliferation and differentiation by nitric oxide. Mol Neurobiol 27: 107–120. [Crossref]
- Bechade C, O Pascual, A Triller, A Bessis (2011) Nitric oxide regulates astrocyte maturation in the hippocampus: involvement of NOS2. Mol Cell Neurosci 46: 762-769. [Crossref]
- Nicotera Pierluigi, Emanuela Bonfoco, Bernhard Brüne (1995) Mechanisms for nitric oxide-induced cell death: Involvement of apoptosis. Adv Neuroimmunol 5: 411-420. [Crossref]
- Zarrindast M R, E Askari, A Khalilzadeh, N Nouraei (2006) Morphine state-dependent learning sensitization and interaction with nitric oxide. Pharmacology 78: 66-71. [Crossref]
- Wang J H, G Y Ko, P T Kelly (1997) Cellular and molecular bases of memory: synaptic and neuronal plasticity. J Clin Neurophysiol 14: 264-293. [Crossref]
- Rezayof A, A Zare-Chahoki, M R Zarrindast, Y Rassouli (2010) Inhibition of dorsal hippocampal nitric oxide synthesis potentiates ethanol-induced state-dependent memory in mice. Behav Brain Res 209: 189-195. [Crossref]
- Morris G, M Berk, H Klein, K Walder, P Galecki et al. (2017) Nitrosative Stress, Hypernitrosylation, and Autoimmune Responses to Nitrosylated Proteins: New Pathways in Neuroprogressive Disorders Including Depression and Chronic Fatigue Syndrome. Mol Neurobiol 54: 4271-4291. [Crossref]
- Calabrese V, C Mancuso, M Calvani, E Rizzarelli, D A Butterfield et al. (2007) Nitric oxide in the central nervous system: neuroprotection versus neurotoxicity. Nat Rev Neurosci 8: 766-775. [Crossref]
- Guix F X, I Uribesalgo, M Coma, F J Munoz (2005) The physiology and pathophysiology of nitric oxide in the brain. Prog Neurobiol 76: 126-152. [Crossref]
- Lu Qing, Valerie A Harris, Ruslan Rafikov, Xutong Sun, Sanjiv Kumar et al. (2015) Nitric oxide induces hypoxia ischemic injury in the neonatal brain via the disruption of neuronal iron metabolism. Redox Bio 6: 112-121. [Crossref]
- Zheng W, C M Chong, H Wang, X Zhou, L Zhang et al. (2016) Artemisinin conferred ERK mediated neuroprotection to PC12 cells and cortical neurons exposed to sodium nitroprusside-induced oxidative insult. Free Radic Biol Med 97: 158-167. [Crossref]
- Andreazza A C, M Kauer-Sant'anna, B N Frey, D J Bond, F Kapczinski et al. (2008) Oxidative stress markers in bipolar disorder: a meta-analysis. J Affect Disord 111: 135-144. [Crossref]
- Maia-de-Oliveira J P, C Trzesniak, I R Oliveira, M J Kempton, T M Rezende et al. (2012) Nitric oxide plasma/serum levels in patients with schizophrenia: a systematic review and meta-analysis. Rev Bras Psiquiatr 34: S149-S155. [Crossref]
- Das I, N S Khan, B K Puri, S R Hirsch (1996) Elevated endogenous nitric oxide synthase inhibitor in schizophrenic plasma may reflect abnormalities in brain nitric oxide production. Neurosci Lett 215: 209-211. [Crossref]
- Suzuki Eiji, Toshio Nakaki, Makoto Nakamura, Hitoshi Miyaoka (2003) Plasma nitrate levels in deficit versus non-deficit forms of schizophrenia. J Psychiatry Neurosci 28: 288-292. [Crossref]
- Taneli F, S Pirildar, F Akdeniz, B S Uyanik, Z Ari (2004) Serum nitric oxide metabolite levels and the effect of antipsychotic therapy in schizophrenia. Arch Med Res 35: 401-405. [Crossref]
- Srivastava N, M K Barthwal, P K Dalal, A K Agarwal, D Nag et al. (2001) Nitrite content and antioxidant enzyme levels in the blood of schizophrenia patients. Psychopharmacol (Berl) 158: 140-145. [Crossref]