Does Arginine Vasopressin Reflect HPA-axis Activation in Major Depressive Disorder?
A B S T R A C T
Researchers have endeavored to subclassify depressive illness based on pathophysiological mechanism. One model relates to hypothalamic-pituitary-adrenal (HPA) axis overactivation with a shift from corticotropin-releasing hormone (CRH) driven regulation to arginine vasopressin (AVP) driven regulation. Given the mixed literature, we compared plasma AVP levels in healthy controls to patients with major depressive disorder (MDD). Plasma samples from 33 patients and 12 controls were collected at baseline, 8 weeks, and 12 weeks of treatment and measured by immunochemical assay. Patients who were treatment responders trended toward lower AVP levels than non-responders. Patients were stratified into low and high AVP groups based on median split. Within the low AVP group, patients whose current episode lasted longer than a year had significantly higher baseline AVP levels than patients whose current episode was less than 6 months. Female patients in the low AVP group had significantly higher baseline AVP levels than male patients. Given the association between stress, HPA axis activation, immune dysregulation, and depression, we also measured concentrations of inflammatory biomarkers. We found a significant negative correlation between IL-10 and baseline AVP levels, within the low AVP subgroup. Given inconsistent data, HPA axis overactivation may be present within a subset of depressed patients.
Keywords
Depression, Arginine vasopressin, HPA axis, Inflammation
Introduction
Major depressive disorder (MDD) is a major cause of disability afflicting significant portions of the population worldwide. According to the World Health Organization, MDD impacts over 300 million people throughout the world, with nearly 800,000 people successfully committing suicide annually (“Depression,” 2018). The causes of depression are multifactorial, with stress playing a key role in conjunction with genetic and epigenetic contributions to its etiopathology. Depression has been associated with metabolic disturbances, endocrinological and immunological changes, and disruption in the homeostasis of the Autonomic Nervous System (ANS). Current treatment regimens include a variety of antidepressant medications, with or without psychotherapy, and various augmentation strategies to improve outcome. Unfortunately, the gold-standard of remission is only achieved in about one third of patients receiving drug treatments, such as selective serotonin (SSRI), or selective serotonin-norepinephrine (SNRI) reuptake inhibitors. A variety of adjunctive medications are often required with variable success rates. Consequently, researchers continue to investigate mechanisms that contribute to the pathophysiology of depression that could identify new targets for drug development.
In addition to diagnosing MDD using the criteria contained in the Diagnostic and Statistical Manual of Mental Disorders (DSM-5), there is a trend towards classifying and treating depression based on pathophysiological mechanisms, such as targeting immunological or metabolic dysregulation. One proposed mechanism that was identified decades ago is activation of the hypothalamic-pituitary-adrenal (HPA) axis with associated decrease in negative feedback. Mild to moderate increases in HPA axis activity have been noted to occur in 30-50% of subjects diagnosed with depression, especially those with "melancholic" depression [1]. Dysregulation of the stress hormone system in depression has been consistently demonstrated in many studies of depression.
Arginine vasopressin (AVP) is a nine amino acid neuropeptide localized in the hypothalamus that binds to receptors in the anterior pituitary, including V1b receptors involved in HPA axis activation [2-4]. Magnocellular AVP neurons are involved in AVP’s role in mediating the anti-diuretic effect and regulating blood pressure through vasoconstriction, whereas the parvocellular AVP neurons are co-localized with CRH neurons in the paraventricular nucleus (PVN) in the hypothalamus and play a role in HPA axis regulation [3, 5]. AVP and CRH can function synergistically to release ACTH [4, 6].
It has been suggested that patients with chronic stress or depression demonstrate a switch in HPA axis regulation being driven by CRH to being driven by AVP [7-8]. Studies have demonstrated that depressed patients exhibit an increase in PVN neurons, with increased activity of AVP neurons, as well as an increase in V1b receptors [7, 9]. AVP also acts on V1a receptors, which are located throughout the brain, and especially brainstem areas associated with regulation of the ANS [10]. AVP is associated with increases in blood pressure, as well as vigilance, mobilization and emotional dysregulation [11]. In unmedicated women with schizophrenia, high plasma levels of AVP have been associated with positive symptoms [12].
The precise role of AVP in depression has yet to be clearly elucidated and there are mixed data regarding the relationship between peripheral plasma AVP levels and depression within the limited studies that have been conducted. The purpose of our study was to examine plasma AVP levels in MDD patients as compared to healthy control subjects and seek associations with inflammation biomarkers.
Methods
I Study Design
Plasma samples (N=33) were obtained from blood samples collected at the time of baseline assessment of patients enrolled in two MDD studies conducted at Loyola University Medical Center. The studies were approved by the Institutional Review Board (IRB). Per approved protocols, pre-screening of potential candidates for these studies was carried out using the 17-item Hamilton Depression Rating Scale (HAM-D) to determine suitability and willingness to participate in the study. Full screening assessment was subsequently conducted only on candidates between 20-65 years of age with a HAM-D17 score ≥18.
The screening process consisted of a structured interview by an experienced psychiatrist using the Mini International Neuropsychiatric Interview (MINI), and the Diagnostic Interview for Genetic Studies (DIGS). The following rater-administered and self-rating scales were used: Hamilton Rating Scale for Depression (HAM-D), Hamilton Rating Scale for Anxiety (HAM-A), Beck Depression Inventory (BDI), Beck Anxiety Inventory (BAI), Colombia Suicide Severity Rating Scale (C-SSRS), Clinical Global Impression (CGI), as well as review of family history and gynecologic history questionnaires. Routine blood chemistries, urinalysis, and toxicology screens conducted at the initial screening visit were obtained to rule out any concomitant illnesses or drug use. Exclusion criteria for the studies included evidence of potentially confounding illness, including heart or thyroid disease, hypertension, diabetes, current tobacco use, illicit drug use within 12 months, or presence of another DSM-IV Axis I diagnose. Eligible patients on antidepressant or antipsychotic agents at time of enrollment underwent a 4-week washout period prior to beginning the study. Patients using anxiolytic or hypnotic medications could continue to receive these medications at the discretion of the investigators.
Upon successful enrollment, baseline blood samples were drawn, and patients were started on either Escitalopram (SSRI antidepressant) or Quetiapine (atypical antipsychotic) monotherapy. The latter agent was used to determine whether Quetiapine monotherapy could be shown to exert antidepressant efficacy in doses not to exceed 300 mg/day. Escitalopram dosing was started at 10 mg/day and maintained in the range of 10–30 mg/day. Quetiapine dosing was started at 25 mg/day and titrated at the discretion of the investigators up to a 300 mg/day. Enrolled patients received no other form of therapy during the study period. Follow-up blood draws and assessments using the aforementioned clinician-rated depression and anxiety scales were performed at weeks 2, 4, 8, and 12. Blood was drawn only if patients were deemed free of an active infectious process or bleeding (including menses), as well as recent disruptive life stressors.
Study patients were required to complete at least 8 weeks of participation to be regarded as study completers. Patients who chose to withdraw from the study on or after 8 weeks of treatment completed a final assessment and their results were carried forward for purpose of data analysis.
II Healthy Controls
Age-matched healthy controls (N=12) were recruited by word of mouth and the posting of campus advertisements. The screening protocol for healthy controls included: compete medical history and physical, MINI, HAM-D, HAM-A, BDI, DIGS, family history and gynecological history questionnaires, collection of blood and urine samples for analysis of complete blood count, electrolytes, fasting blood sugar, liver, kidney, and thyroid function, lipids as well as urinalysis, pregnancy and toxicological drug screen. Once deemed eligible, healthy control subjects provided blood samples for inflammatory biomarker analyses.
III Plasma AVP Assay
Plasma AVP levels were measured by immunochemical assay. Samples were immediately centrifuged at 1600 x g for 15 minutes at 4oC, aliquoted, and stored in a -80oC freezer. Samples were thawed at room temperature immediately before assays. Plasma AVP were measured using an Enzyme Immunoassay (ELISA) purchased from Enzo Life Sciences, Inc. (Farmingdale, New York). The assays were performed according to the manufacturer’s instructions. The ELISA has been reported by the manufacturer to be highly sensitive (minimal detection rate = 4.10 pg/ml for AVP) with very little antibody cross-reactivity for other neuropeptides. Samples were batched, diluted in an assay buffer to give reliable results within the linear portion of the standard curve (AVP 1:2), and completed in duplicate. The inter- and intra-assay coefficients of variation were <6.8% and <7.9% for AVP assay. Validation of these assays is described elsewhere [13].
IV Biomarker Measurement
After an overnight fast, subjects rested in a reclining position for 30 minutes prior to venipuncture. Blood draws were scheduled between 9:00AM and 10:00AM. Whole blood samples were spun in order to separate plasma and serum, which were immediately frozen and stored at -80 degrees centigrade until analyzed. Using “Evidence InvestigatorTM” by Randox Technologies, multiple cytokines, chemokines, and growth factors (CRP, VWF, PE-CAM, VCAM, aCL, IL-2, IL-4, IL-6, IL-8, IL-10, VEGF, BDNF, IFNG, TNF-a, IL-1a, IL-1b, MCP1, and EGF) were quantitatively detected simultaneously from a single sample. This compact Biochip array system consists of a super-cooled charge-coupled detector and unique image processing software. This Biochip technology has been previously validated for blood samples in previously reported studies by our research team. The results of Biochips are reliable and comparable to results obtained via individual ELISAs for each of the individual parameters. Serum hsCRP was measured by ELISA with a commercially available assay kit.
Results
No significant correlation was found between AVP blood level and BMI, ethnicity, or any of the biomarkers measured (Table 1). No significant correlations were found between AVP levels and severity for depression or anxiety. At baseline, MDD patients had an average AVP level of 100 pg/ml and healthy controls had an average AVP level of 94 pg/ml (p=0.71). Male MDD patients had average AVP levels of 96 pg/ml in comparison to female MDD patients, who had an average AVP level of 103 pg/ml (p=0.71). MDD patients younger than 40 years had average AVP levels of 101 pg/ml in comparison to MDD patients 40 and older, who had an average AVP level of 99 pg/ml (p=0.95). In comparison to baseline AVP levels, MDD patients from both studies, had AVP levels of 93 pg/ml (p=0.63) at week 8 and levels of 100 pg/ml (p=0.99) week 12.
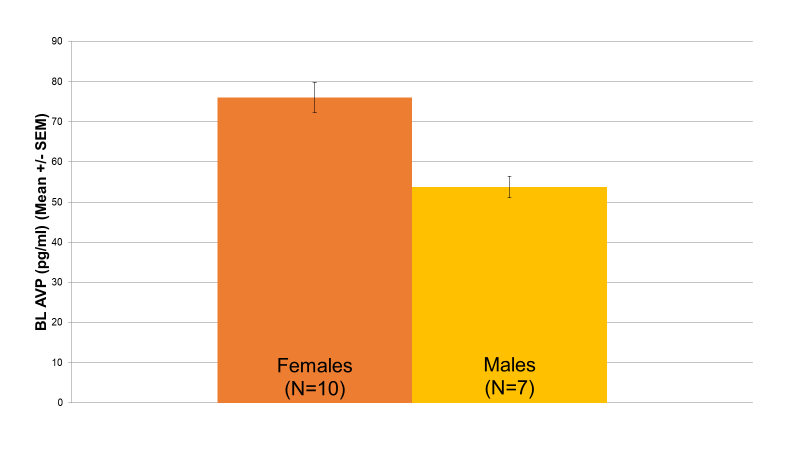
Figure 1: Relationship between Baseline AVP Levels and Gender (p=0.004). Within the low AVP group, female patients (76 pg/ml, N=10) had significantly higher baseline AVP levels than male patients (53 pg/ml, N=7) (p=0.004).
Baseline AVP revealed a wide distribution of values, suggesting that two unique patient groups may potentially exist. Accordingly, AVP levels were split into a high baseline group (N=16) and a low baseline group (N=17) based on the median value of the distribution. As demonstrated in Figure 1, in the low AVP group, female patients (76 pg/ml, N=10) had significantly higher baseline AVP levels than male patients (53 pg/ml, N=7) (p=0.004). Additionally, in the low AVP group, patients whose current episode length had lasted longer than a year (75 pg/ml, N=8) had significantly higher baseline AVP levels than patients whose current episode length had lasted less than 6 months (57 pg/ml, N=5) (p=0.036) (Figure 2). No significant differences were found between the high AVP group on either of these parameters.
When treatment response was used as a criterion, MDD patients who were treatment responders trended toward lower AVP levels (85 pg/ml) than patients who did not respond to treatment (131 pg/ml) (p=0.069) (Figure 3).
Correlational analysis between the low AVP group and biomarkers revealed a significant negative correlation between those in the low AVP group and IL-10 (r=-0.554, p=0.032) (Table 1). No significant correlation was found for the high AVP group and any of the measured biomarkers.
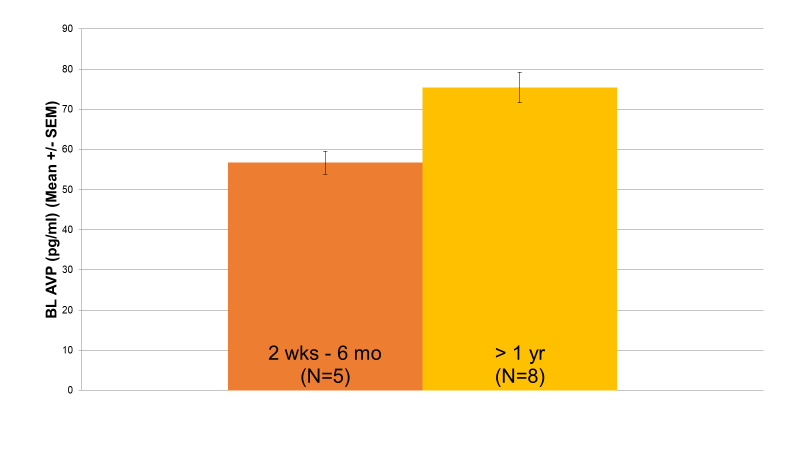
Figure 2: Relationship between Baseline AVP Levels and Current Episode Length (p=0.036) Within the low AVP group, patients whose current depressive episode had lasted longer than a year (75 pg/ml, N=8) exhibited significantly higher baseline AVP levels than patients whose current depressive episode had lasted less than 6 months (57 pg/ml, N=5) (p=0.036).
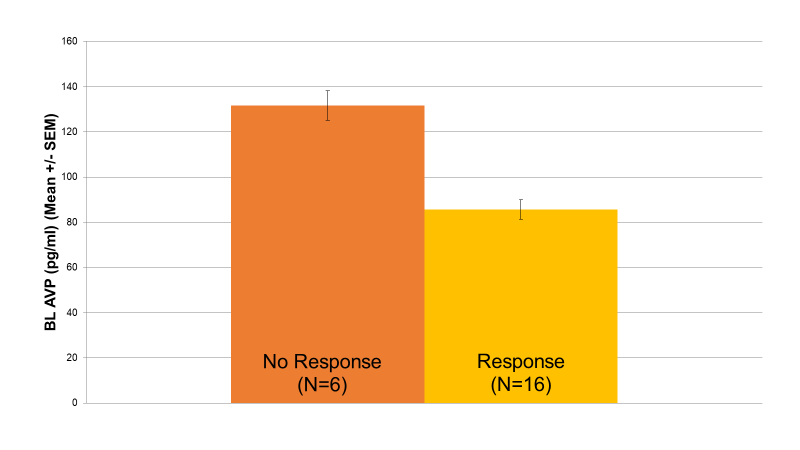
Figure 3: Baseline AVP & Response to Treatment (p=0.069). Depressed patients who were treatment responders trended toward lower AVP levels (85 pg/ml) compared to patients who did not respond to treatment (131 pg/ml) (p=0.069).
When treatment response was used as a criterion, MDD patients who were treatment responders trended toward lower AVP levels (85 pg/ml) than patients who did not respond to treatment (131 pg/ml) (p=0.069) (Figure 3).
Correlational analysis between the low AVP group and biomarkers revealed a significant negative correlation between those in the low AVP group and IL-10 (r=-0.554, p=0.032) (Table 1). No significant correlation was found for the high AVP group and any of the measured biomarkers.
Table 1: Plasma AVP and Inflammatory Biomarkers
|
Overall |
CRP |
IL-2 |
IL-4 |
IL-6 |
IL-8 |
IL-10 |
IFNG |
TNF-a |
IL-1a |
IL-1b |
VEGF |
|
|
Baseline AVP |
Pearson Correlation |
-0.189 |
-0.031 |
-0.053 |
0.224 |
0.244 |
0.158 |
-0.046 |
-0.063 |
0.068 |
-0.001 |
-0.051 |
|
Sig. (2-tailed) |
0.300 |
0.868 |
0.788 |
0.219 |
0.178 |
0.430 |
0.805 |
0.732 |
0.730 |
0.996 |
0.786 |
|
|
N |
32 |
32 |
28 |
32 |
32 |
27 |
31 |
32 |
28 |
26 |
31 |
|
|
|
||||||||||||
|
Low AVP Group |
CRP |
IL-2 |
IL-4 |
IL-6 |
IL-8 |
IL-10 |
IFNG |
TNF-a |
IL-1a |
IL-1b |
VEGF |
|
|
Baseline AVP |
Pearson Correlation |
0.373 |
-0.040 |
0.358 |
0.151 |
0.215 |
-0.554 |
0.036 |
-0.217 |
0.430 |
0.169 |
-0.116 |
|
Sig. (2-tailed) |
0.154 |
0.884 |
0.190 |
0.578 |
0.425 |
0.032* |
0.896 |
0.419 |
0.110 |
0.564 |
0.668 |
|
|
N |
16 |
16 |
15 |
16 |
16 |
15 |
16 |
16 |
15 |
14 |
16 |
|
|
|
||||||||||||
|
High AVP Group |
CRP |
IL-2 |
IL-4 |
IL-6 |
IL-8 |
IL-10 |
IFNG |
TNF-a |
IL-1a |
IL-1b |
VEGF |
|
|
BaselineAVP |
Pearson Correlation |
-0.370 |
-0.255 |
-0.256 |
0.232 |
0.162 |
0.046 |
-0.209 |
-0.250 |
-0.274 |
-0.255 |
-0.210 |
|
Sig. (2-tailed) |
0.158 |
0.340 |
0.398 |
0.387 |
0.549 |
0.887 |
0.455 |
0.350 |
0.364 |
0.424 |
0.453 |
|
|
N |
16 |
16 |
13 |
16 |
16 |
12 |
15 |
16 |
13 |
12 |
15 |
|
Legend: Inflammatory biomarkers were measured from patient blood samples and subsequently compared to baseline AVP levels. No significant relationship was found between any inflammatory biomarker and baseline AVP levels upon overall comparison of values. After a median-split separation of AVP into low AVP and high AVP subgroups, a significant negative correlation (p=0.032) was found between IL-10 and baseline AVP within the low AVP subgroup.
Discussion
I AVP and Depression
Although several studies have been published, there is limited evidence regarding the relationship between AVP and MDD. Existing findings are mixed with studies demonstrating unchanged, decreased, or elevated AVP levels [8, 14]. One proposed explanation for this inconsistency is that the primary influencer of peripheral AVP concentrations is AVP release from hypothalamic magnocellular neurons secondary to changes in osmolality, which may not have been controlled for in all studies [8].
In accordance with another study, we also found no significant difference in AVP levels when comparing healthy controls to depressed patients [15]. Furthermore, a meta-analysis of plasma AVP levels also found no significant difference between healthy controls and patients with depression. This was attributed to factors including methodological limitations of the various studies included in the meta-analysis and high levels of heterogeneity across the various studies. Consistent with our findings, another study reported that neither CSF AVP levels nor plasma AVP levels reliably discriminated between patients with MDD and healthy controls [16].
Despite conflicting data, several studies have demonstrated overactivity of HPA axis in depressed patients through an increase in AVP and cortisol levels [1, 2, 6, 17]. Human studies have also shown decreases in peripheral AVP concentration in patients with remitted depression [7]. One study [17] not only found depressed patients to have higher plasma AVP concentrations but upon further stratifying this relationship, in that study, AVP was especially increased in melancholic depression and among inpatients. Of note, given the stress associated with hospitalization, increased activity of the HPA axis would be expected. The study also noted that among those who were hospitalized, a larger proportion of patients demonstrated melancholia.
When examining stress hormones in depressed patients, it has been observed that such abnormalities are not present in all patients, suggesting that dysregulation may occur in a subset of patients with MDD [2, 8]. This has been further supported by studies examining depressed patients with above normal AVP (ANA), with some studies suggesting that this may even be a subcategory of melancholic depression [7, 18]. Furthermore, post-mortem human studies have demonstrated an increase in AVP expressing neurons and subsequent plasma AVP concentrations in melancholic depression. Further investigation revealed that in those within the ANA subcategory, this may be related to familial depression and an increase in nocturnal motor activity [1, 7].
There are data demonstrating that depressed patients exhibit alterations in the density of pituitary V1b receptors along with an upregulation in receptor function [7-8]. Animal studies have begun to explore the use of V1b receptor antagonists to treat depression and have demonstrated some effects similar to antidepressants, in addition to reducing HPA overactivation [2, 5, 16]. Other studies have indicated that the use of antidepressants leads to a downregulation of V1b receptor function [2, 5]. Notably, in addition to subcategories of depression presenting with a genetic predisposition to HPA overactivation, a generalized vasopressinergic theory of depression applying to all MDD patients has also been postulated. However, further investigation into this theory is warranted.
II AVP and Gender
We found no statistically significant difference in plasma AVP levels between male and female patients with MDD, consistent with several other studies. However, after stratifying patients into low and high AVP groups, female patients in the low AVP group had significantly higher baseline AVP levels than male patients. Of note, some studies have suggested a gender difference in plasma AVP levels, despite a lack of consistent findings across all studies. Wu et al. reported a significant 253% increase of AVP-ir in female depressed subjects but not in male depressed patients [19]. One study found male controls to have higher peripheral AVP levels compared to female controls, suggesting a possible relationship between sex hormones and AVP [17]. This was further supported by another study which noted an increase in AVP in male mice and female mice who were ovulating, both of which were also under chronic stress. For males, it has been suggested that there is a gender difference in AVP mRNA expression, in which males not only seem to be more sensitive to changes in AVP, but AVP also seems to display some androgen dependence [20]. In females, ovarian hormones may play a role in AVP levels, as lower AVP levels have been reported during menstruation compared to ovulation [17, 20]. Interestingly, one study also examined whether patients with MDD exhibit increased cholinergic sensitivity by administering physostigmine. The study found that pre-menopausal females displayed heightened cholinergic sensitivity supporting a possible role of ovarian hormones, yet male controls were also noted to display increased hormone levels post-physostigmine [12].
III AVP and Antidepressant/Antipsychotic Treatment
We observed no statistically significant changes in plasma AVP levels over the course of treatment. Furthermore, patients who responded to treatment trended toward lower AVP levels at baseline compared to non-responders, with additional statistical analysis indicating that responders to treatment were slightly more likely to fall in the low AVP group compared to non-responders. Current data pertaining to the effect of psychiatric medications on AVP levels is limited. One study comparing peripheral AVP levels in patients who were, or not, receiving an antidepressant also found no significant change in plasma AVP [7]. The absence of any effects of antidepressant treatment was further supported by another study that found fluoxetine to have no significant effect on peripheral AVP levels. However, there are two reports based on measurements from CSF that fluoxetine may lead to a decrease in CSF AVP and CRH levels [1, 9]. Interestingly, this same study found that responders to amitriptyline also displayed decreased CSF CRH levels but no significant change in CSF AVP levels [1]. Furthermore, acute administration of apomorphine and clonidine also seemed to demonstrate no significant effect on AVP neurophysin levels in MDD subjects [14].
Some studies, however, have found that in patients who exhibit full remission of depression, previously increased plasma AVP levels normalized as patients undergoing treatment with antidepressants also demonstrated clinical improvement. These findings suggest that overactivation of the HPA axis is a manifestation of the depression itself, and that normalization of peripheral AVP levels reflects patient recovery, as opposed to normalized functioning of pituitary V1b receptors [4, 5, 9]. Of note, one study found that administration of fluoxetine did not significantly affect AVP mRNA expression in the paraventricular nucleus of the hypothalamus in male mice with a knockout of the AVP V1b receptor and wild type male mice; in contrast wild type females treated with fluoxetine demonstrated increased AVP mRNA levels. Furthermore, AVP V1b receptor knockout mice also exhibited a significant decrease in ACTH and cortisol in response to fluoxetine and desipramine. This study also noted that when an antidepressant treatment is initiated, there appears to be an increase in HPA axis activation, and that a decrease in depressive symptoms coincides with normalization of HPA axis activity [4]. Interestingly, studies examining the subset of depressed patients with ANA, have found that they appear to demonstrate an insufficient response to treatment, as demonstrated by characteristics such as lower cooperativeness compared to healthy controls and fully remitted patients with normal plasma AVP levels [18].
IV AVP and Inflammation
Inflammation-mediated cytokine release in the context of stress-related disorders is well established. Given current literature relating to an inflammatory pathophysiology of depression and the fact that depressed patients may also exhibit HPA axis overactivation with corresponding increases in AVP levels, a correlation between inflammatory biomarkers and AVP levels would be expected [21]. While we did not find a correlation between plasma AVP levels and most inflammatory biomarkers, a significant negative relationship between IL-10 and AVP was demonstrated within the subgroup of patients with low AVP levels. If we assume a predominantly anti-inflammatory function for IL-10, decreasing levels of this cytokine might indicate a pro-inflammatory state. Therefore, an inverse correlation between IL-10 and AVP should be expected during periods of stress and stress-related disorders, such as depressive illness. Despite the notion of inflammatory changes playing a pathophysiological role in depression, the fact that our findings were limited to the low AVP subgroup may suggest that in those with comparatively low baseline AVP levels, there may be an increased likelihood of an inflammatory alteration contributing to depressive symptomatology, as opposed to HPA axis overactivation. An alternate hypothesis is that in the setting of low AVP, which reflects a lower level of HPA axis activation, the corresponding increase in IL-10 is not only indicative of an anti-inflammatory state but may serve as a protective factor given that the low AVP subgroup also demonstrated a better response to treatment.
One pro-inflammatory cytokine that has been linked to AVP in the literature is IL-6. Immune challenge studies involving peripheral injection of a lipopolysaccharide (LPS) have demonstrated a relationship between IL-6 and subsequent AVP neuronal activation [22]. Interestingly, while IL-6 and AVP are co-localized in magnocellular neurons of the PVN, suggesting that they may be co-released, increases in AVP levels in depressed patients may not necessarily correspond to increased IL-6 levels given that HPA axis overactivation is mediated by parvocellular neurons [23]. Of note, alterations in inflammatory cytokine levels and resulting neurohormonal effects have been hypothesized to explain the comorbidity between depression, cardiovascular, and metabolic disorders, given a common neuroinflammatory etiology [24-25]. Therefore, further investigation into the association between inflammatory cytokines, HPA activation, and depressive illness is warranted.
V HPA Axis and VEGF
In addition to measuring inflammatory cytokines, we also measured plasma VEGF levels, which showed no significant relationship with AVP in our study. VEGF is an angiogenic growth factor involved in the stress response and it also plays a critical role in hippocampal neurogenesis. Although current literature is limited, it has been suggested that VEGF may be involved in the pathogenesis of depression, given a decrease in neurotrophins in conjunction with stress [21, 26-28]. Current literature is mixed regarding the role of VEGF in depression and no consistent trend has been found relating VEGF levels to depression [26-28]. There are also conflicting opinions regarding the effect of antidepressant treatment on VEGF levels. Interestingly, one study found a significant elevation in plasma VEGF in the context of remission after antidepressant treatment, suggesting that VEGF may be a possible predictor of response to treatment [26]. There is limited literature investigating the associations between VEGF and HPA axis activation, especially regarding AVP levels. One study demonstrated that peripheral LPS administration in the context of chronic stress decreased pituitary and increased hypothalamic VEGF levels, suggesting a greater sensitivity of VEGF to social stress. These fluctuations were postulated as a mechanism for HPA axis plasticity in conjunction with chronic mild stress. Furthermore, stress was demonstrated to affect VEGF immunostaining in the arcuate nucleus, which is also involved in the hypothalamic response to stress [29]. Additionally, another study demonstrated a relationship between VEGF signaling as a mediator of AVP axonal terminal density within the hypothalamo-neurohypophysial system. This finding was supported by a decreased density in AVP axonal terminals subsequent to VEGF signal inhibition [30].
Conclusions
We found no statistically significant differences in AVP plasma levels between MDD patients at baseline and healthy controls, regardless of age, contributing to the discrepant findings in the literature regarding AVP levels in MDD. However, the wide range of baseline values for AVP suggested that two distinctive patient groups (high and low) may exist. Within the low AVP group, female patients had significantly higher baseline AVP levels than males, suggesting a possible hormonal involvement. Furthermore, patients whose current episode had lasted longer than a year had significantly higher baseline AVP levels than patients whose current episode had lasted less than six months. Neither relationship was found in the high AVP group. Interestingly, a significant negative relationship was found between patients in the low AVP group and IL-10, supportive of an inflammatory component in depression and consistent with existing literature showing associations between AVP and inflammatory cytokines. Responders to treatment trended toward lower AVP levels at baseline than non-responders, which also indicates that comparatively low AVP may be a predictor of response to treatment. A lack of significant findings for other measured biomarkers and within the high AVP group reinforces the need for additional investigation into these relationships and other possible confounding factors.
Limitations
One potential limitation of our study is the use of plasma AVP levels, as peripheral blood levels may not be an accurate representation of central AVP levels. Secondly, we measured neuropeptide concentrations which do not demonstrate the same level of biological stability as AVP neurophysin carrier protein concentrations, which could possibly have skewed the data. Notably, data shows that central AVP levels may not be accurately represented by plasma AVP levels [14]. Unfortunately, we did not have corresponding cortisol or CRH levels to further investigate HPA axis overactivation.
Conflicts of Interests
The authors declare no conflict of interest with respect to the research, authorship, or publication of this article. The authors are responsible for the content and writing of the paper.
Acknowledgements
This research did not receive any specific grant from funding agencies in the public, commercial, or not-for-profit sectors. Refinement of peptide assays used in this study was conducted in a research study sponsored by NICHD (P01 HD 07575 to CSC).
Article Info
Article Type
Research ArticlePublication history
Received: Tue 10, Mar 2020Accepted: Sat 21, Mar 2020
Published: Mon 30, Mar 2020
Copyright
© 2023 Angelos Halaris . This is an open-access article distributed under the terms of the Creative Commons Attribution License, which permits unrestricted use, distribution, and reproduction in any medium, provided the original author and source are credited. Hosting by Science Repository.DOI: 10.31487/j.CEI.2020.02.01
Figures & Tables
Table 1: Plasma AVP and Inflammatory Biomarkers
|
Overall |
CRP |
IL-2 |
IL-4 |
IL-6 |
IL-8 |
IL-10 |
IFNG |
TNF-a |
IL-1a |
IL-1b |
VEGF |
|
|
Baseline AVP |
Pearson Correlation |
-0.189 |
-0.031 |
-0.053 |
0.224 |
0.244 |
0.158 |
-0.046 |
-0.063 |
0.068 |
-0.001 |
-0.051 |
|
Sig. (2-tailed) |
0.300 |
0.868 |
0.788 |
0.219 |
0.178 |
0.430 |
0.805 |
0.732 |
0.730 |
0.996 |
0.786 |
|
|
N |
32 |
32 |
28 |
32 |
32 |
27 |
31 |
32 |
28 |
26 |
31 |
|
|
|
||||||||||||
|
Low AVP Group |
CRP |
IL-2 |
IL-4 |
IL-6 |
IL-8 |
IL-10 |
IFNG |
TNF-a |
IL-1a |
IL-1b |
VEGF |
|
|
Baseline AVP |
Pearson Correlation |
0.373 |
-0.040 |
0.358 |
0.151 |
0.215 |
-0.554 |
0.036 |
-0.217 |
0.430 |
0.169 |
-0.116 |
|
Sig. (2-tailed) |
0.154 |
0.884 |
0.190 |
0.578 |
0.425 |
0.032* |
0.896 |
0.419 |
0.110 |
0.564 |
0.668 |
|
|
N |
16 |
16 |
15 |
16 |
16 |
15 |
16 |
16 |
15 |
14 |
16 |
|
|
|
||||||||||||
|
High AVP Group |
CRP |
IL-2 |
IL-4 |
IL-6 |
IL-8 |
IL-10 |
IFNG |
TNF-a |
IL-1a |
IL-1b |
VEGF |
|
|
BaselineAVP |
Pearson Correlation |
-0.370 |
-0.255 |
-0.256 |
0.232 |
0.162 |
0.046 |
-0.209 |
-0.250 |
-0.274 |
-0.255 |
-0.210 |
|
Sig. (2-tailed) |
0.158 |
0.340 |
0.398 |
0.387 |
0.549 |
0.887 |
0.455 |
0.350 |
0.364 |
0.424 |
0.453 |
|
|
N |
16 |
16 |
13 |
16 |
16 |
12 |
15 |
16 |
13 |
12 |
15 |
|
Legend: Inflammatory biomarkers were measured from patient blood samples and subsequently compared to baseline AVP levels. No significant relationship was found between any inflammatory biomarker and baseline AVP levels upon overall comparison of values. After a median-split separation of AVP into low AVP and high AVP subgroups, a significant negative correlation (p=0.032) was found between IL-10 and baseline AVP within the low AVP subgroup.
References
- Scott LV, Dinan TG (2002) Vasopressin as a target for antidepressant development: an assessment of the available evidence. J Affect Disord 72: 113-124. [Crossref]
- Katz DA, Locke C, Greco N, Liu W, Tracy KA (2017) Hypothalamic-pituitary-adrenal axis and depression symptom effects of an arginine vasopressin type 1B receptor antagonist in a one-week randomized Phase 1b trial. Brain Behav 7: 1-8. [Crossref]
- Kormos V, Gaszner B (2013) Role of neuropeptides in anxiety, stress, and depression: From animals to humans. Neuropeptides 47: 401-419. [Crossref]
- Stewart LQ, Roper JA, Young WS 3rd, O’Carroll AM, Lolait SJ (2008) The role of the arginine vasopressin Avp1b receptor in the acute neuroendocrine action of antidepressants. Psychoneuroendocrinology 33: 405-415. [Crossref]
- Goekoop JG, De Winter RF, Wolterbeek R, Van Kempen GM, Wiegant VM (2011) Evidence of vasopressinergic-noradrenergic mechanisms in depression with above-normal plasma vasopressin concentration with and without psychotic features. J Psychopharmacol 25: 345-352. [Crossref]
- Dinan TG, Scott LV (2005) Anatomy of melancholia: Focus on hypothalamic-pituitary-adrenal axis overactivity and the role of vasopressin. J Anat 207: 259-264. [Crossref]
- Goekoop J, De Winter R, Wolterbeek R, Wiegant V (2011). Support for two increased vasopressinergic activities in depression at large and the differential effect of antidepressant treatment. J Psychopharmacol 25: 1304-1312. [Crossref]
- Thomson F, Craighead M (2008) Innovative approaches for the treatment of depression: Targeting the HPA axis. Neurochem Res 33: 691-707. [Crossref]
- Purba JS, Hoogendijk WJ, Hofman MA, Swaab DF (1996) Increased number of vasopressin- and oxytocin-expressing neurons in the paraventricular nucleus of the hypothalamus in depression. Arch Gen Psychiatry 53: 137-143. [Crossref]
- Freeman SM, Smith AL, Goodman MM, Bales KL (2017) Selective localization of oxytocin receptors and vasopressin 1a receptors in the human brainstem. Soc Neurosci 12: 113-123. [Crossref]
- Tsigos C, Kyrou I, Kassi E, Chrousos GP (2000) Stress, Endocrine Physiology and Pathophysiology, Endotext. [Crossref]
- Rubin RT, O’Toole SM, Rhodes ME, Sekula LK, Czambel RK (1999) Hypothalamo-pituitary-adrenal cortical responses to low-dose physostigmine and arginine vasopressin administration: sex differences between major depressives and matched control subjects. Psychiatry Res 89: 1-20. [Crossref]
- Carter CS, Pournajafi-Nazarloo H, Kramer KM, Ziegler TE, White-Traut R, et al. (2007) Oxytocin: Behavioral Associations and Potential as a Salivary Biomarker. Ann N Y Acad Sci 1098: 312-322. [Crossref]
- Scantamburlo G, Hansenne M, Fuchs S, Pitchot W, Pinto E, et al. (2005) AVP- and OT-neurophysins response to apomorphine and clonidine in major depression. Psychoneuroendocrinology 30: 839-845. [Crossref]
- Parker KJ, Kenna HA, Zeitzer JM, Keller J, Blasey CM et al. (2010) Preliminary evidence that plasma oxytocin levels are elevated in major depression. Psychiatry Res 178: 359-362. [Crossref]
- Rutigliano G, Rocchetti M, Paloyelis Y, Gilleen J, Sardella A et al. (2016) Peripheral oxytocin and vasopressin: Biomarkers of psychiatric disorders? A comprehensive systematic review and preliminary meta-analysis. Psychiatry Res 241: 207-220. [Crossref]
- Van Londen L, Goekoop JG, Van Kempen GM, Frankhuijzen-Sierevogel AC, Wiegant VM et al. (1997) Plasma levels of arginine vasopressin elevated in patients with major depression. Neuropsychopharmacology 17: 284-292. [Crossref]
- Goekoop JG, de Winter RF, Wolterbeek R, Spinhoven P, Zitman FG, Wiegant VM (2009) Reduced cooperativeness and reward-dependence in depression with above-normal plasma vasopressin concentration. J Psychopharmacol 23: 891-897. [Crossref]
- Wu X, Balesar R, Lu J, Farajnia S, Zhu Q et al. (2017) Increased glutamic acid decarboxylase expression in the hypothalamic suprachiasmatic nucleus in depression. Brain Struct Funct 222: 4079-4088. [Crossref]
- Karisetty BC, Khandelwal N, Kumar A, Chakravarty S (2017) Sex difference in mouse hypothalamic transcriptome profile in stress-induced depression model. Biochem Biophys Res Commun 486: 1122-1128. [Crossref]
- Lang UE, Borgwardt S (2013) Molecular mechanisms of depression: Perspectives on new treatment strategies. Cell Physiol Biochem 31 761-777. [Crossref]
- Palin K, Moreau ML, Sauvant J, Orcel H, Nadjar A et al. (2009) Interleukin-6 activates arginine vasopressin neurons in the supraoptic nucleus during immune challenge in rats. Am J Physiol Endocrinol Metab 296: E1289-E1299. [Crossref]
- Jankord R, Zhang R, Flak JN, Solomon MB, Albertz J et al. (2010) Stress activation of IL-6 neurons in the hypothalamus. Am J Physiol Regul Integr Comp Physiol 299: R343-R351. [Crossref]
- Swart RM, Hoorn EJ, Betjes MG, Zietse R (2011) Hyponatremia and inflammation: The emerging role of interleukin-6 in osmoregulation. Nephron Physiol 118: 45-51. [Crossref]
- Szczepanska-Sadowska E, Cudnoch-Jedrzejewska A, Ufnal M, Zera T (2010) Brain and cardiovascular diseases: common neurogenic background of cardiovascular, metabolic and inflammatory diseases. J Physiol Pharmacol 61: 509-521. [Crossref]
- Cark-Raymond A, Meresh E, Hoppensteadt D, Fareed J, Sinacore J et al. (2017) Vascular endothelial growth factor: Potential predictor of treatment response in major depression. World J Biol Psychiatry 18: 575-585. [Crossref]
- Clark-Raymond A, Meresh E, Hoppensteadt D, Fareed J, Sinacore J et al. (2014) Vascular Endothelial Growth Factor: A potential diagnostic biomarker for major depression. J Psychiatr Res 59: 22-27. [Crossref]
- Clark-Raymond A, Halaris A (2013) VEGF and depression: A comprehensive assessment of clinical data. J Psychiatr Res 47: 1080-1087. [Crossref]
- Nowacka MM, Paul-Samojedny M, Bielecka AM, Plewka D, Czekaj P et al. (2015) LPS reduces BDNF and VEGF expression in the structures of the HPA axis of chronic social stressed female rats. Neuropeptides 54: 17-27. [Crossref]
- Furube E, Mannari T, Morita S, Nishikawa K, Yoshida A et al. (2014) VEGF-dependent and PDGF-dependent dynamic neurovascular reconstruction in the neurohypophysis of adult mice. J Endocrinol 222: 161-179. [Crossref]