Detection of the Temporomandibular Joint Fibrocartilage by Magnetic Resonance Imaging
A B S T R A C T
Objective: The aims of this study were to detect the fibrocartilage layer (FC) of the porcine mandible condyle in ex vivo preparations using 3D SPGR (Spoiled GRASS sequence) (T1 WATS) sequences, and, to compare 3D SPGR image results with those of conventional magnetic resonance imaging (MRI) sequences for detecting the fibrocartilage layers of the temporomandibular joint (TMJ) in patients with temporomandibular disorders (TMD).
Methods: Four porcine TMJ with and without FC were radiographically and histologically assessed. Additionally, fifty-nine patients were studied using T1 WATS MRI and T2 TSE and PD TSE sequences. Four trained and calibrated observers assessed the MRI images.
Results: In porcine, the T1 WATS sequence was able to detect the presence or absence of FC in the mandibular condyle, histologically confirmed. In humans, 98% of fibrocartilages were detected with T1 WATS sequence in temporal fossa, and 91% in mandible condyles. Significantly poorer detection with the T2 TSE and PD TSE sequences was observed. Mean fibrocartilage ROI signal intensity was 74.07 IU (±14.7), without statistical differences between fossa and condyle.
Conclusion: T1 WATS is the most reliable and efficient sequence for detecting the TMJ fibrocartilage layer (p <0.05).
Keywords
TMJ, TMD, fibrocartilage, T1 WATS, 3D SPGR, MRI
Introduction
Temporomandibular disorders (TMD) are the major cause of non-dental pain in the orofacial region, and the second most common chronic musculoskeletal condition after low back pain, affecting 10% to 15% of the population, of which 5% require therapy [1-4]. The highest prevalence of TMD is seen in women between 18-45 years, causing joint noise, pain and functional impairment that compromises the quality of life [5, 6]. The etiology of TMD is multifactorial and unclear, but it is related to functional, structural and psychological aspects of the patient, factors that may contribute alone or in combination to the development of the disorder, making it difficult to establish a proper diagnosis [7, 8].
Degenerative diseases (DD) are common findings in patients with TMD, and their subsequent expression in articular cartilage is usually not detected by current imaging techniques in MRI [9-11]. The disease is characterized by cartilage loss, subchondral bone and synovial changes [12].
Magnetic resonance imaging (MRI) is gaining popularity in TMJ studies as it depicts bone marrow edema, disc functionality, soft tissue changes, pathological accumulation of liquids, images of the complete joint in multiple planes, and its significant association with clinical findings. MRI of cartilage in TMJ has been less well explored; precise cartilage layer assessment would be a valuable addition to other pathological modifications detected by noninvasive MRI in the assessment and monitoring of the whole joint [11, 13].
Although spin-echo images and gradient-echo magnetic resonance imaging (MRI) are well-established for detecting internal derangement of the TMJ, traditional protocols for evaluating normality and abnormalities of the fibrocartilage layer of the joint surfaces are inadequate [14-16]. The implementation of thin sections of fat-suppressed spoiled gradient-echo (SPGR) images, compared with conventional imaging techniques, showed improved contrast and spatial resolution between cartilage areas from adjacent structures [17, 18]. The T1 water-selective excitation (WATS) technique and SPGR, or FLASH (fast low angle shot), are gradient echo sequences (GRE) that combine a low angle of inclination for radiofrequency (RF) excitation pulse of the MRI signal (registered as a spatially encoded GRE) with a rapid repetition time of the basic sequence. The repetition time is usually shorter than that in T1-weighted MRI.
Today, images taken by a 3D SPGR sequence with fat suppression have several advantages over those taken by conventional sequences; it generates positive contrast between cartilage and adjacent structures, and fat suppression maximizes contrast between the cartilage and adjacent bone, which is an improvement to T2 TSE, minimizing chemical shift artefacts [13]. Thus, the T2 TSE, GRASS and T1 SE sequences present significantly lower performance than 3D SPGR images with fat suppression in the visualization of cartilaginous lesions. 3D acquisitions produce better contrast between cartilage and fluid than 2D acquisitions.
On the other hand, porcine cadaveric preparations are the best animal sample used to study TMJ because it provides an inexpensive and easily obtained tissue from animals slaughtered for human consumption. They are used widely for studies and for the training of dentists in different areas, such as oral surgery and periodontology [19, 20].
The aim of this prospective study was to, first, assess the SPGR MRI technique in detecting the fibrocartilaginous layer of the porcine mandible condyle in an ex vivo model, and second, to evaluate the clinical usefulness of the SPGR technique for detecting the fibrocartilage layer in the TMJ and compare it with that of conventional MRI. The alternative hypothesis was that the T1 WATS MRI sequence would present a greater potential to detect the morphology of the fibrocartilage layer of the TMJ compared with conventional sequences (T2-weighted TSE and PD-weighted TSE sequences).
Materials and Methods
The protocol was approved by the Institutional Research Ethics Committee of the Dental School at the Universidad Mayor (Project UM20082), and it was registered at clinical trials (NCT03891511). All procedures followed were in accordance with the ethical standards of the responsible committee on human experimentation (institutional and national) and with the Helsinki Declaration of 1975, as revised in 2008. All institutional and national guidelines for the care and use of laboratory animals were followed (ARRIVE).
I Porcine Study
The experiments were carried out in the heads of two Yorkshire young pigs (nine months old) and obtained from a local slaughterhouse. In both heads, the right condylar fibrocartilage layer was surgically removed, while the left TMJ remained untouched. The two heads were examined using bilateral MRI (Phillips Intera 1,5 T, Sense Flex S Dual Coil, Eindhoven, The Netherlands) in the following sequences; sagittal DP-weighted TR 1500; TE 20), T2-weighted (TR 2000; TE 100) and T1-weighted WATS (TR 30; TE 4.4), (with fat and liquid suppression; FOV=100mm; matrix=256×256pxs.; slice thickness=1,5mm.; without spacing), all in the oblique axis of the mandibular condyle, and coronal DP-weighted, with a closed mouth (FOV=88mm; slice thickness=2mm, spacing=0.2cm; matrix size of 256×256pxs.). Subsequently, the TMJs were extracted, submerged in buffered 10% formalin solution (Sigma Aldrich Merck KGaA, Frankfurter Str. 250, 64293 Darmstadt, Germany) at room temperature and sent to pathological anatomy for the histological report. All 4 samples were decalcified by Osteosoft (EDTHA, pH 7.0) until suitable for inclusion (Poth Hille Paraffin Wax Plus) and staining (hematoxylin-eosin and toluidine blue, Cancer Diagnostic).
II In Vivo Human Study
This prospective study was focused on analysing morphological characteristics of the fibrocartilage layer of the TMJ based on the MRI scans of 59 patients (118 TMJ).
i Inclusion Criteria
Patients who were clinically diagnosed with internal derangement in at least one TMJ during their first visit and who were referred for complimentary MRI examination of the TMJ by one calibrated clinician (K = 0.82), diagnosed according to Diagnostic Criteria for Temporomandibular Disorders (DC/TMD), were included. The clinical diagnosis of internal derangement was required in order to associate the functional status of the disc, and the presence of FC discontinuities.
ii Exclusion Criteria
Patients with a cardiac pacemaker or cochlear implant; intracranial vascular clips, metal particles in orbit, or bone and metal fragments in the craniofacial area; clinical diagnosis of head or face trauma; systemic diseases, such as gout, generalized osteoarthrosis, joint hyper-extension, congenital malformation, cysts, tumors or other bone pathologies; history of previous TMJ surgery; and younger than 13 years were excluded.
III MRI Examination
Patients were examined using bilateral MRI (Phillips Intera 1,5 T, Sense Flex S Dual Coil) in the following sequences: sagittal PD-weighted (TR 1500; TE 20), T2-weighted (TR 2000; TE 100) and T1-weighted WATS (TR 30; TE 4.4), all in the oblique axis of the mandible condyle and with a closed mouth; dynamic gradient-echo (TR 180; TE 14) was taken with a closed mouth and open mouth at 10 mm, 20 mm and 30 mm of the interincisal distance or at maximum mouth opening, depending on the individual patient's clinical condition. Open mouth distances were stabilized with a disposable plastic block, which was adjusted to different sizes. Additionally, a coronal PD-weighted sequence (TR 1500; TE 20) with the mouth closed was performed. In the PD TSE and T2 TSE sequences, 6 slices (2.0 mm thick) of each TMJ were taken with 8×8 cm FOV and 0.2 cm spacing. In the T1 WATS sequence, 15 slices were taken from each TMJ. All sequences were carried out using the same equipment and on the same day.
The database was backed up in a PACS workstation (Advance Open Source PACS Workstation Mac Pro, Macintosh, Apple, USA) and processed by DICOM viewer software (Osirix® Imaging, Department of Radiology, Geneva University Hospital, Rue Micheli-du-Crest 24, 1211 Geneva 24, Switzerland).
All measurements were made in a simple blinded system by four different observers (minimum 9 years of experience, chi-square test for inter-observer agreement: p˂0.05). Measurements were made separately in the three MRI sequences (Osirix®). In all MRI sequences, TMJ was magnified at a zoom of 3.6. For the T1 WATS sequence, the window width was set at 90 intensity Units (IU), and the window level was 80 IU. All images with the measurements were stored in DICOM format.
IV Imaging Processing and Quantitative Evaluation
i Presence and Discontinuity, and Thickness
The fibrocartilage layer was evaluated dichotomously (absent/present and continuous/discontinuous). The thicknesses were measured by a curve tool (Osirix®) and were expressed in millimeters. The fibrocartilage layer was measured at three different places, located at 0°, 45° and 90° from the condylar axis (Figure 1).
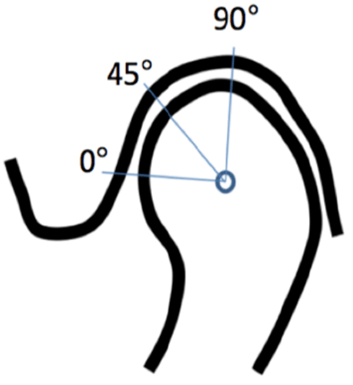
Figure 1: Location of the measurements at 0°, 45° and 90° from the condyle axis.
Fibrocartilage Signal Intensity: Six regions of interest (ROIs) were defined in the fibrocartilage layer of each TMJ (Figure 1), three in the mandibular condyle and three in the temporal fossa. The fibrocartilage signal intensity in each ROI was expressed as the mean value of intensity units (Osirix®).
ii Statistical Analysis
The Shapiro-Wilk and Levene's tests were performed to assess the normality of data distribution and homogeneity of variance of the measurements. To determine the relationship between the presence or absence of fibrocartilage and the different sequences, Fisher's exact test and Spearman’s test were used. The results of thickness and signal intensity were analysed using descriptive statistics. To compare fibrocartilage thickness between the condyle and fossa, Student's t test was used. To compare the three thickness measurements, one-way ANOVA and Tukey’s post hoc test was used. All comparisons were two-sided and performed at a P=0.05 level of significance. (SPSS v15.0 for Windows). Post hoc power (1-β) was calculated (G* Power v3.1.92).
Results
I Ex Vivo Porcine Study
The ex vivo porcine study showed that T1 WATS images detected the presence of a fibrocartilage layer in the nonintervention TMJs (Figure 2A). In contrast, in the surgically intervention joint, it was not possible to detect the removed fibrocartilage of the condylar layer (Figure 2B). DP and T2-weighted sequences did not present any FC image, so they were deemed as being unable to detect it in porcine TMJ. The histological assessment showed a normal FC layer (Figure 2C), with its fibrous, cartilaginous and osseous characteristics, in the untouched condyle. The intervened condyle showed only osseous tissue due to complete removal of the FC layer (Figure 2D).
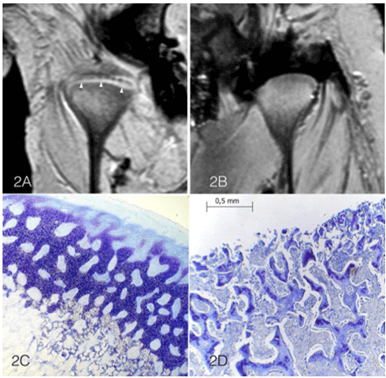
Figure 2: A) Coronal view of right and left porcine TMJs. A: is the untouched joint with the FC layer clearly detected and identified with arrows. B) TMJ with the FC layer removed before the MRI scan. C) Porcine TMJ, toluidine blue stain, loupe magnification of the untouched condyle with the FC layer (fibrous, cartilaginous and osseous layers). D) Condyle with the FC layer removed, showing only osseous tissue.
II In Vivo Fibrocartilage Detection
Of the 297 examined patients, 59 met the inclusion/exclusion criteria, all 118 TMJs were suitable for analysis, 40 were women (range age: 18-60 years old, x̄=28.0 years) and 19 were men (range: 15-48 years, x̄=26 years).
With the T1 WATS sequence, the rate of the hypersignal detection for the FC in the temporal fossa was 98.3% (116 of 118), while that at the mandibular condyle was 90.7% (107 of 118). The T2 TSE sequence detected this layer in 4.2% of TMJs (temporal bone and condyle combined), and PD TSE detected it in 22% of temporal bones and 19.5% of condyles (Graph 1).
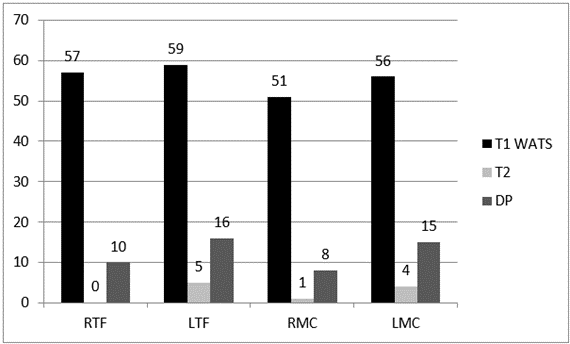
Graph 1: Fibrocartilage detection in the Temporal Fossa and in the Condyle separated by the different MRI sequences and side.
RTF: Right Temporal Fossa; LTF: Left Temporal Fossa; RMC: Right Mandibular Condyle; LMC: Left Mandibular Condyle.
The detection of fibrocartilage continuity/discontinuity was achieved only by the T1 WATS sequence. T2 TSE and PD TSE could not discriminate between continuities and discontinuities. In patients with TMD, a single fibrocartilage discontinuity was observed more frequently than multiple discontinuities (Table 1). The continuity of the FC layer in WATS sequence was observed in a pathology-free joint (Figures 3A-3D).
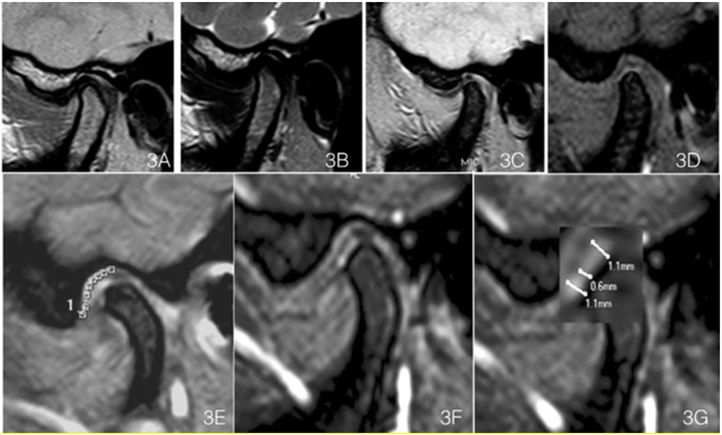
Figure 3: A) Sagittal DP weighted Images of an asymptomatic TMJ (male 38-year-old). B) T2 weighted, C) Echo Gradient and D) WATS T1, clearly showing the FC layer, in contrast with the other sequences, where no difference can be seen with the other joint tissues. E) FC length in the temporal fossa as determined by the curve tool in Osirix. F) FC magnified and thickness measurement with T1 WATS sequence. G) FC thickness measurements, made at three different positions in each joint.
Table 1: Presence of fibrocartilage discontinuities, separated
by joint surface, and side.
|
|
RFFD |
LFFD |
RCFD |
LCFD |
|
n
(%) |
n
(%) |
n
(%) |
n
(%) |
|
|
1 Discontinuity |
17
(29) |
22
(37) |
16
(27) |
19
(32) |
|
>
1 Discontinuity |
5
(8) |
8
(14) |
0
(0) |
1
(2) |
|
Sub Total |
22
(37) |
30
(51) |
16
(27) |
20
(34) |
|
Absence
of Discontinuity |
37
(63) |
29
(49) |
43(73) |
39
(66) |
|
Total |
59(100) |
59(100) |
59(100) |
59(100) |
RFFD:
Right Fossa Fibrocartilage Discontinuity; LFFD: Left Fossa Fibrocartilage
Discontinuity; RCFD: Right Condyle Fibrocartilage Discontinuity; LCFD: Left Condyle
Fibrocartilage Discontinuity.
i Thickness
The thickness of the FC layer of the jaw condyle ranged from 0.5 to 1.6 mm (x̄=0.91±0.21), and in the temporal fossa, it ranged from 0.4 to 1.7 mm (x̄=0.85±0.91), it was detected by T1 WATS sequence only (Figures 3E, 3F & 3G). By T1 WATS, were performed FC thickness measurements in the temporal fossa for 115 of the 118 TMJs (97.5%) measurements and in the condyle for 107 of the 118 TMJs (99.2%) (Table 2). Traditional sequences could not detect it.
Table 2: Fibrocartilage thickness measured with T1 WATS
sequence and separated by side and bone, with the mean value expressed in
millimeters.
|
|
Right 0° |
Right 45° |
Right 90° |
Right 0° |
Right 45° |
Right 90° |
Left 0° |
Left 45° |
Left 90° |
Left 0° |
Left 45° |
Left 90° |
|
|
TFF |
TFF |
TFF |
TFF |
TFF |
TFF |
MCF |
MCF |
MCF |
MCF |
MCF |
MCF |
|
Mean |
0.84 |
0.85 |
0.84 |
0.89 |
0.94 |
0.89 |
0.86 |
0.86 |
0.83 |
0.89 |
0.97 |
0.9 |
|
SD |
0.21 |
0.21 |
0.22 |
0.21 |
0.23 |
0.21 |
0.20 |
0.18 |
0.18 |
0.20 |
0.23 |
0.19 |
TFF: Temporal Fossa Fibrocartilage; MCF : Mandibular
Condyle Fibrocartilage.
The comparison between the fossa and condylar FC thickness did not show a significant difference (p=0.9163). The thickness data presented normal distribution (p=0.001 by Shapiro-Wilk test) and homogeneous variance (p=0.436 by Levene's test). The three thickness measurements were not significantly different from each other in the fossa fibrocartilage (p=0.768) or in the condyle fibrocartilage (p=0.8935). The comparison among the three fibrocartilage condyle thicknesses showed significant differences (p=0.039). Comparison between the 0° and 45° measurements of fibrocartilage thickness in the condyle showed significant differences (p=0.0065), though no differences in thickness between 45° and 90° (p=0.998) or between 0° and 90° (p=0.676) were observed.
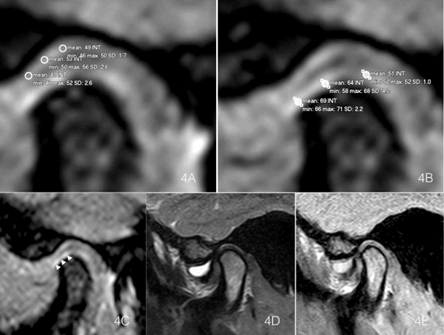
Figure 4: A) & B) Temporal bone and condyle signal intensity measurements of FC in the T1 WATS sequence. C) T1 WATS oblique parasagittal exploration of the TMJ in the same patient, with severe anterior superior synovitis, where effusion did not affect the FC detection. D) T2 sequence and E) PD sequence. Only WATS allowed visualization of the fibrocartilage layer as a hyperintense signal (arrows).
ii Signal Intensity Measurements
With T1 WATS sequence, were measured the signal intensity in 224 of the 236 (94.9%) fibrocartilage layers, of right and left TMJ including condyle and fossa, that showed a mean signal intensity of 74.07 IU ±14.77. The fibrocartilage ROI (Region of Interest) signal intensity in T1 WATS, expressed as intensity units (IU mean ± SD) was in the right temporal fossa 73.0±14.1 IU (n=57) and in the left side 75.6±15.3 IU (n=59), and in the right condyle was 73.5 ± 15.0 IU (n=52) and 74.0 ± 14.9 for the left (n=56) (Table 3). 12 FC (5.1%) could not be properly measured due to very thin FC tissues and/or it were altered by the presence of artefacts. T2 TSE detected reliable signals in only 10 of the 236 (4.2%) fibrocartilage layers, indicating a mean signal intensity of 47.32 IU (±20.1 IU). PD-weighted TSE sequences were possible to measure signal intensity in 49 of the 236 (20.8%) fibrocartilage layers, indicating a mean intensity of 59.41 IU (±17.1 IU) (Figures 4A-4E).
iii Clinical Information
Of the study sample, 89.83% (96%) of TMJ presented disc displacement; 57.63% (n=68 TMJ) with reduction (DDWR) and 32.2% (n=38) without reduction (DDWOR); 10.17% (n=12) presented normal disc function (ND), (p=0.05). 28.8% of the joints showed DDWOR and discontinuities of the FC layer, while 6% of the DDWR showed discontinuities of the fibrocartilage, most of the FC discontinuities were located in the condyles. The descriptive analysis showed that 62.71% (n=37) of the patients self-reported joint noise. Most of the patients showed disc displacement in both joints. The T1 WATS sequence was able to detect 77% of symptomatic TMJ as positives cases of FC discontinuities, (sensitivity), and detected only 29% of the negative cases of asymptomatic TMJ (specificity).
Table 3: Fibrocartilage ROI signal intensity and SD in T1 WATS
sequence, expressed in intensity units (IU), and separated by side and surface,
expressed in intensity units.
|
|
Right |
Left |
||
|
|
n |
Ⴟ ± SD |
n |
Ⴟ ± SD |
|
TF |
57 |
73.0
± 14.1 |
59 |
75.6
± 15.3 |
|
MC |
52 |
73.5
± 15.0 |
56 |
74.0
± 14.9 |
TF:
Temporal Fossa; MC: Mandibular Condyle; ROI: Region of Interest.
Discussion
The results of the ex vivo study showed that T1 WATS was the only sequence that identified the fibrocartilage layer in the temporomandibular joint of pigs, histologically confirmed.
A strong relationship between the detection of a fibrocartilage layer and T1 WATS sequence was observed (Spearman’s rho = 0.85) in the in vivo FC detection, and a moderate relationship between the T2 TSE and PD TSE sequences and the lack of detection of a fibrocartilage layer (p=0.524) was observed, based on the special characteristics of the sequence that shows hypersignal only the FC layer, while the other structures are observed as hypo or intermediate signal, because the images fat-suppressed T1 WATS maximizes contrast between the FC and adjacent bone marrow, which is an improvement over T2 TSE images since it minimizes chemical shift artefacts, and additionally, T1 WATS uses a small voxel size (approximately 0.1 mm). The T2 TSE sequence is considered to be specific for inflammatory diseases, as it demonstrates fluid signal hyperintensity. This fact prevents one from obtaining good contrast between the intermediate fibrocartilage signal and the existing high intensity of the fluid signal, and this can be confusing to the observer (Figures 4A & 4B) [21-23]. The PD-weighted TSE sequence defines morphology of the structures when liquid intermediate intensities are displayed, hampering optimal contrast between the fibrocartilage and liquid [24].
Discontinuities observed in the FC layer by the T1 WATS sequence could be associated with early-stage degenerative bone changes in the TMJ and could represent a breakthrough in studying [2, 3, 5]. Previous studies on other joints using the T1 WATS sequence (3D SPGR) have shown that cartilaginous morphologic abnormalities are seen as contour and thickness alterations of articular cartilage of the knee, making T1 WATS more accurate in detecting cartilage defects than conventional MRI sequences [19].
In this study, a high number of FC samples underwent thickness measurement by T1 WATS, both in the fossa (97.5%) and in the condyle (90.7%). The images lost in the FC could be explained by TMJ with severely degenerative bone disease or by the T1 WATS sequence not being able to detect thin tissue, which could be related to the artefacts of magnetic susceptibility due to the presence of the temporal bone.
The fibrocartilage thickness in the condyle head was in the range of 0.5 to 1.6 mm for all 3 positions. The thickness varied depending on the studied area and corresponded to the morphological description, which stated that the FC has variable thickness, with lower thicknesses located in less active areas and higher thicknesses located in high-pressure areas. This dichotomy is justified by the hinged motion and displacement of the joint itself [25]. While the average anatomic thickness of the fibrocartilaginous layer in the TMJ ranges from 0.1 to 0.5 mm, in WATS images, this was observed to be thickened in the mandibular condyle (x̄=0.91±0.21 mm), and this increased thickness should not be interpreted as the inclusion of synovial tissue, synovial fluid, or bone since all of these in the WATS sequence are observed as hypo intense signals, and the only tissue observed as a hyper intense signal is fibrocartilage. Magnification of the thickness was regularly observed in the present study. Welsch et al. described this phenomenon through a study on the cartilage thickness of a small joint, the talo-crusal joint, in the ankles of healthy volunteers at 3T, and they found significantly increased measurements of cartilage thickness with 3D acquisition [26]. The explanation for this enlargement is not clear but could be related to thinner slices disturbing the assessment of cartilage thickness within the curved anatomy of the joint. Nevertheless, differentiation between cartilage and the subchondral plate, and consequently the cartilage thickness measured, could depend on the interpretation of the tidemark of the deep calcified cartilage layer. This variable visualization of the tidemark that may affect the cartilage depth measured was observed by Trattnig et al. [27]. Other factors for this could be the partial volume effect, as well as chemical artefacts and reduction of bandwidth.
The T1 WATS sequence provided high tissue resolution by the use of slices of 1 mm, contiguous slices (without interslice space), and a scan time of 3 minutes, which is slightly longer than the scan time used in conventional sequences (PD TSE = 2.19 min, and T2 TSE = 2.45 min), that failed to detect the FC layer. The T1 WATS sequence showed fibrocartilage as a tissue of high signal intensity in relation to the synovial fluid, and therefore, this sequence has great potential for testing FC layers, over other sequences. The post hoc data analysis of signal intensity showed better visualization of FC by T1 WATS in the TMJ, superior to T2-weighted sequence (difference between dependent means, two tails, sample size n=59, 1-β=0.95,) [28, 29]. Also features high spatial resolution between FC and adjacent structures compared with T2 TSE and PD-weighted TSE sequences, and this has been previously reported in other larger joints, such as the knee, ankle, hip and shoulder [15, 17, 18, 21, 26, 30].
The T1 WATS sequence detection was consistent among the TMJs (94.9% of TMJs), showed the highest and the most regular intensity values (x̄=74.07 ±14.7 IU) of the three sequences, and was not significantly different between the fossa and condyle. The lower signal intensity of FC observed in this study compared with that of studies on the knee could be explained by the different histological nature of the two tissues. The knee mainly has hyaline cartilage, while the articular surface of the TMJ is covered with fibrous-type cartilage, which is structurally different from hyaline cartilage [31]. The difference in signal intensity between TMJ disc and FC observed in the WATS sequence is related to different tissue hydration that both tissues have, where FC is seen as hyper intensity signal, due to its greater hydration pattern, although the two tissues are made of the same biological material. On the other hand, given the nature of the T1 sequence (WATS), synovial fluid should present as hypo intense signal in both cases, pre- and post-surgical manipulation of the porcine. Similar to what was observed in knee MRI, where the meniscus and articular cartilage are made of the same material but differ absolutely in intensity, based on the different hydration [32].
The surgical removal of the FC layer in porcine, results in an important change of signal. In T1, and specifically in spin echo, the tissue liquid and also those that are naturally hydrated will be hypo intense without being able to differentiate synovial fluid or fibrocartilage. When combining T1 with a gradient sequence, considering its physical difference in spin movements, it is possible to obtain intensity differences between synovial fluid and fibrocartilage, since both will have different hydrogen components, which can vary if the hydrogens are in a free liquid such as synovial or more static when it is linked to the structure of glycosaminoglycan or collagen. Therefore, in T1 Gradient it is possible to obtain an image with intensity variables that could not be obtained in T1 Spin Eco.
The current results with the T1 WATS sequence show that it has great potential in the TMJ for the diagnosis and follow-up of TMD. The present data are similar to previous data on other joints, such as the patellofemoral joint, where high sensitivity (81%) and high specificity (97%) were found in cartilage abnormalities detection with similar [30, 32].
Other research has focused on detecting early joint involvement in patients with degenerative diseases of the TMJ using a dynamic gadolinium-enhanced fat-suppressed T1-weighted SE sequence, showing that this procedure is effective in detecting early changes in the TMJ. However, this procedure is invasive, which is in contrast to T1 WATS, which is noninvasive [33].
Geiger et al. showed that the use of 3D ultrashort time to echo (UTE) is an efficient alternative for the study of FC morphology in the TMJ and allows its quantitative evaluation; however, it requires 3-Tesla MR scanner [34]. There are several limitations in this study; the image noise included small ROI that can have an impact on the measurements; absence of histological assessment of the human FC of the TMJ; a small number of patients with healthy TMJ, which influence the specificity of the MRI exam; and small number of samples in ex vivo study, due to the feasibility design of the study, since the aim of this study was to compare the performance of MRI sequences to detect the fibrocartilage layer of the TMJ. Despite these limitations, T1 WATS is a new diagnostic tool for TMJ evaluation in patients with TMD, in the future, it is necessary to note that the different layers of the TMJ fibrocartilage remain absolutely unexplored by MRI today. It will be especially important to detect the deeper layers and subchondral tissue and their relationship with compact bone. Another challenge will be to detect early pathological changes that could occur in the contour and thickness of the fibrocartilage layer of the TMJ, which will be critical to understand when and how degenerative bone disease begins. MRI detection could visualize such changes before the fibrocartilage layer loses its thickness or continuity.
Finally, T1 WATS is a sequence developed only to detect fibrocartilage layer, being complementary and does not replace any of the conventional sequences; it only provides additional information for detection of the TMJ fibrocartilage.
Conclusion
The T1 WATS sequence (3D SPGR) is the most reliable sequence for detecting the fibrocartilage layer of the TMJ in patients with temporomandibular disorders because it highlights the fibrocartilage structure over other soft adjacent structures. Additionally, the T1 WATS sequence allows the detection of FC layer discontinuities, unlike conventional sequences, which are not able to differentiate intensities of fibrocartilage. T1 WATS was the only sequence that consistently displayed information for the study of the FC in patients with TMD.
Conflicts of Interest
None.
Funding
None.
Informed Consent
Informed consent was obtained from all patients.
Article Info
Article Type
Research ArticlePublication history
Received: Thu 08, Sep 2022Accepted: Thu 29, Sep 2022
Published: Thu 20, Oct 2022
Copyright
© 2023 Gustavo Moncada. This is an open-access article distributed under the terms of the Creative Commons Attribution License, which permits unrestricted use, distribution, and reproduction in any medium, provided the original author and source are credited. Hosting by Science Repository.DOI: 10.31487/j.DOBCR.2022.03.02
Figures & Tables
Table 1: Presence of fibrocartilage discontinuities, separated
by joint surface, and side.
|
|
RFFD |
LFFD |
RCFD |
LCFD |
|
n
(%) |
n
(%) |
n
(%) |
n
(%) |
|
|
1 Discontinuity |
17
(29) |
22
(37) |
16
(27) |
19
(32) |
|
>
1 Discontinuity |
5
(8) |
8
(14) |
0
(0) |
1
(2) |
|
Sub Total |
22
(37) |
30
(51) |
16
(27) |
20
(34) |
|
Absence
of Discontinuity |
37
(63) |
29
(49) |
43(73) |
39
(66) |
|
Total |
59(100) |
59(100) |
59(100) |
59(100) |
RFFD:
Right Fossa Fibrocartilage Discontinuity; LFFD: Left Fossa Fibrocartilage
Discontinuity; RCFD: Right Condyle Fibrocartilage Discontinuity; LCFD: Left Condyle
Fibrocartilage Discontinuity.
Table 2: Fibrocartilage thickness measured with T1 WATS
sequence and separated by side and bone, with the mean value expressed in
millimeters.
|
|
Right 0° |
Right 45° |
Right 90° |
Right 0° |
Right 45° |
Right 90° |
Left 0° |
Left 45° |
Left 90° |
Left 0° |
Left 45° |
Left 90° |
|
|
TFF |
TFF |
TFF |
TFF |
TFF |
TFF |
MCF |
MCF |
MCF |
MCF |
MCF |
MCF |
|
Mean |
0.84 |
0.85 |
0.84 |
0.89 |
0.94 |
0.89 |
0.86 |
0.86 |
0.83 |
0.89 |
0.97 |
0.9 |
|
SD |
0.21 |
0.21 |
0.22 |
0.21 |
0.23 |
0.21 |
0.20 |
0.18 |
0.18 |
0.20 |
0.23 |
0.19 |
TFF: Temporal Fossa Fibrocartilage; MCF : Mandibular
Condyle Fibrocartilage.
Table 3: Fibrocartilage ROI signal intensity and SD in T1 WATS
sequence, expressed in intensity units (IU), and separated by side and surface,
expressed in intensity units.
|
|
Right |
Left |
||
|
|
n |
Ⴟ ± SD |
n |
Ⴟ ± SD |
|
TF |
57 |
73.0
± 14.1 |
59 |
75.6
± 15.3 |
|
MC |
52 |
73.5
± 15.0 |
56 |
74.0
± 14.9 |
TF:
Temporal Fossa; MC: Mandibular Condyle; ROI: Region of Interest.
RTF: Right Temporal Fossa; LTF: Left Temporal Fossa; RMC: Right Mandibular Condyle; LMC: Left Mandibular Condyle.
References
1. Macfarlane TV,
Glenny AM, Worthington HV (2001) Systematic review of population-based
epidemiological studies of oro-facial pain. J Dent 29: 451-467. [Crossref]
2. Ahmad M, Schiffman
EL (2016) Temporomandibular Joint Disorders and Orofacial Pain. Dent Clin
North Am 60: 105-124. [Crossref]
3. Slade GD, Ohrbach
R, Greenspan JD, Fillingim RB, Bair E et al. (2016) Painful Temporomandibular
Disorder: Decade of Discovery from OPPERA Studies. J Dent Res 95:
1084-1092. [Crossref]
4. Fillingim RB,
Ohrbach R, Greenspan JD, Knott C, Dubner R et al. (2011) Potential psychosocial
risk factors for chronic TMD: descriptive data and empirically identified
domains from the OPPERA case-control study. J Pain 12: T46-T60. [Crossref]
5. Almoznino G, Zini
A, Zakuto A, Sharav Y, Haviv Y et al. (2015) Oral Health-Related Quality of
Life in Patients with Temporomandibular Disorders. J Oral Facial Pain
Headache 29: 231-241. [Crossref]
6. Wu N, Hirsch C
(2010) Temporomandibular disorders in German and Chinese adolescents. J
Orofac Orthop 71: 187-198. [Crossref]
7. Slade GD, Bair E,
Greenspan JD, Dubner R, Fillingim RB et al. (2013) Signs and symptoms of
first-onset TMD and sociodemographic predictors of its development: the OPPERA
prospective cohort study. J Pain 14: T20-T32.e1-3. [Crossref]
8.
Epker
J, Gatchel RJ (2000) Coping profile differences in the biopsychosocial functioning
of patients with temporomandibular disorder. Psychosom Med 62: 69-75. [Crossref]
9.
Cortés D, Exss E,
Marholz C, Millas R, Moncada G (2011) Association between disk position and
degenerative bone changes of the temporomandibular joints: an imaging study in
subjects with TMD. Cranio 29: 117-126. [Crossref]
10. Dias IM, Coelho PR, Picorelli Assis NM, Pereira Leite
FP, Devito KL (2012) Evaluation
of the correlation between disc displacement and degenerative bone changes of
the temporomandibular joint by means of magnetic resonance images. Int J
Oral Maxilofac Surg 41: 1051-1057. [Crossref]
11. Yang MC, Wang DH,
Wu HT, Li WC, Chang TY et al. (2019) Correlation of magnetic resonance imaging
grades with cytokine levels of synovial fluid of patients with temporomandibular
joint disorders: a cross-sectional study. Clin Oral Investig 23:
3871-3878. [Crossref]
12.
Sperry
MM, Kartha S, Winkelstein BA, Granquist EJ (2019) Experimental Methods to
Inform Diagnostic Approaches for Painful TMJ Osteoarthritis. J Dent Res 98: 388-397. [Crossref]
13. Higuchi K, Chiba M, Sai Y, Yamaguchi Y, Nogami S et
al. (2020) Relationship
between temporomandibular joint pain and magnetic resonance imaging findings in
patients with temporomandibular joint disorders. Int J Oral Maxillofac Surg
49: 230-236. [Crossref]
14. Gibbs SJ, Simmons
HC 3rd (1998) A protocol for magnetic resonance imaging of the
temporomandibular joints. Cranio 16: 236-241. [Crossref]
15. Brady AP, McDevitt
L, Stack JP, Downey D (1993) A technique for magnetic resonance imaging of the
temporomandibular joint. Clin Radiol 47: 127-133. [Crossref]
16. Eberhard D,
Bantleon HP, Steger W (2000) Functional magnetic resonance imaging of
temporomandibular joint disorders. Eur J Orthod 22: 489-497. [Crossref]
17. Disler DG, McCauley
TR, Kelman CG, Fuchs MD, Ratner LM et al. (1996) Fat-suppressed three-dimensional
spoiled gradient-echo MR imaging of hyaline cartilage defects in the knee:
comparison with standard MR imaging and arthroscopy. AJR Am J Roentgenol
167: 127-132. [Crossref]
18.
Disler
DG, McCauley TR, Wirth CR, Fuchs MD (1995) Detection of knee hyaline cartilage
defects using fat-suppressed three-dimensional spoiled gradient-echo MR
imaging: comparison with standard MR imaging and correlation with arthroscopy. AJR
Am J Roentgenol 165: 377-382. [Crossref]
19. Li X, Ma BC, Bolbos RI, Stahl R, Lozano J et al.
(2008) Quantitative
assessment of bone marrow edema-like lesion and overlying cartilage in knees
with osteoarthritis and anterior cruciate ligament tear using MR imaging and
spectroscopic imaging at 3 Tesla. J Magn Reson Imaging 28: 453-461. [Crossref]
20. Štembírek J, Kyllar M, Putnová I, Stehlík L, Buchtová
M (2012) The pig as an experimental model for clinical craniofacial research. Lab
Anim 46: 269-279. [Crossref]
21. Dunn T, Lu Y, Jin
H, Ries MD, Majumdar S (2004) T2 relaxation time of cartilage at MR imaging:
comparison with severity of knee osteoarthritis. Radiology 232: 592-598.
[Crossref]
22. Brooks SL, Brand
JW, Gibbs SJ, Hollender L, Lurie AG (1997) Imaging of the temporomandibular
joint: a position paper of the American Academy of Oral and Maxillofacial
Radiology. Oral Surg Oral Med Oral Pathol Oral Radiol Endod 83: 609-618.
[Crossref]
23. Güler N, Yatmaz PI,
Ataoglu H, Emlik D, Uckan S (2003) Temporomandibular internal derangement:
correlation of MRI findings with clinical symptoms of pain and joint sounds in
patients with bruxing behaviour. Dentomaxillofac Radiol 32: 304-310. [Crossref]
24. Khan H, Ahad H,
Sharma P, Bajaj P, Hassan N et al. (2015) Correlation Between Magnetic
Resonance Imaging and Arthroscopic Findings in the Knee Joint. Trauma Mon
20: e18635. [Crossref]
25. Dijkgraaf LC, de
Bont LG, Boering G, Liem RS (1995) Normal cartilage structure, biochemistry,
and metabolism: a review of the literature. J Oral Maxillofac Surg 53:
924-929. [Crossref]
26. Welsch GH, Mamisch
TC, Weber M, Horger W, Bohndorf K et al. (2008) High-resolution morphological
and biochemical imaging of articular cartilage of the ankle joint at 3.0 T
using a new dedicated phased array coil: in
vivo reproducibility study. Skeletal Radiol 37: 519-526. [Crossref]
27. Trattnig S,
Breitenseher MJ, Huber M, Zettl R, Rottmann B et al. (1997) Determination of
cartilage thickness in the ankle joint. an MRT (1.5)-anatomical comparative
study. Rofo 166: 303-306. [Crossref]
28. Duc SR, Pfirrmann
CW, Schmid MR, Zanetti M, Koch PP et al. (2007) Articular cartilage defects
detected with 3D water excitation true FISP: prospective comparison with
sequences commonly used for knee imaging. Radiology 245: 216-223. [Crossref]
29. Siepmann DB,
McGovern J, Brittain JH, Reeder SB (2007) High-resolution 3D cartilage imaging
with IDEAL SPGR at 3 T. AJR Am J Roentgenol 189: 1510-1515. [Crossref]
30. Recht MP, Piraino
DW, Paletta GA, Schils JP, Belhobek GH (1996) Accuracy of fat suppressed three
dimensional spoiled gradient-echo FLASH MR imaging in the detection of patella
femoral articular cartilage abnormalities. Radiology 198: 209-212. [Crossref]
31. Hoemann CD,
Lafantaisie Favreau CH, Lascau Coman V, Chen G, Guzmán Morales J (2012) The
cartilage-bone interface. J Knee Surg 25: 85-97. [Crossref]
32. Brem MH, Pauser J,
Yoshioka H, Brenning A, Stratmann J et al. (2007) Longitudinal in vivo reproducibility of cartilage
volume and surface in osteoarthritis of the knee. Skeletal Radiol 36:
315-320. [Crossref]
33. Suenaga S, Ogura T, Matsuda T, Noikura T (2000) Severity of synovium and bone marrow abnormalities of the temporomandibular joint in early rheumatoid arthritis: role of gadolinium-enhanced fat-suppressed T1-weighted spin echo MRI. J Comput Assist Tomogr 24: 461-465. [Crossref]
34. Geiger D, Bae WC, Statum S, Du J, Chung CB (2014) Quantitative 3D ultrashort time-to-echo (UTE) MRI and micro-CT (μCT) evaluation of the temporomandibular joint (TMJ) condylar morphology. Skeletal Radiol 43: 19-25. [Crossref]