Decreased Expression of Metastasis Suppressor 1 Correlates with Poor Prognosis of Patients with Rectal Adenocarcinoma
A B S T R A C T
Background: Venous thromboembolic events (VTE) are common causes of morbidity and mortality in glioblastoma patients. Mutation in the isocitrate dehydrogenase 1 enzyme (IDH1) is frequent in secondary glioblastoma and results in altered metabolomics.
Objectives: This study evaluates whether IDH-1 status correlates with incidence of VTE in glioblastoma patients.
Methods: Observational study of 398 cases of patients with glioblastoma, who all underwent surgery in a regional Neurosurgical centre between April 2012 and December 2014. IDH -1 status and Tissue factor (F3) protein expression were assessed by immunohistochemistry. Deep venous thrombosis (DVT) and pulmonary embolism (PE) were diagnosed by Doppler ultrasound and pulmonary CT angiogram respectively.
Results: 336 cases were wild type (WT) IDH-1 (94.1%) and 21 cases were IDH-1 mutated (R132H) (5.9%). 51 patients had a thromboembolic event (15.3%), with all cases of VTE in WT IDH-1 tumors, a rate of 21.8% within this group. IDH-1 status had a significant correlation with VTE (p=0.033 Fisher exact test). As expected, mutant IDH was associated with prolonged patient survival (p=0.024 Log rank). The mean expression in IDH-1 wild type GBM was 7.14 and in R132h mutant GBM was 4.87 (log2 scale). This was highly statistically significant with a corrected P value of less than 0.0001.
Conclusion: A significant association exists between IDH1 status in glioblastoma patients and the risk of VTE. Patients with wild type IDH-1 appear at high risk of VTE and appropriate precautions should be considered.
Keywords
MTSS1, rectal adenocarcinoma, prognosis
Highlights
Results from qPCR, Western blot and IHC were showed rectal adenocarcinoma cells and tissues with low MTSS1 expressions. Multivariate and univariate analyses indicated MTSS1 was an independent prognostic factor.
Introduction
Rectal cancer is the third most common form of cancer in men (16.5%) and the second in women (10.0%) [1]. The long-term outcomes of rectal cancer patients remain poor despite advances in new treatments over the past decades [2-4]. According to the International Agency for Research on Cancer (IARC), rectal adenocarcinoma is the third most common cancer and the fourth deadliness cancer worldwide [5]. Rectal adenocarcinoma occurs in a manner similar to that of other cancers and is caused by the accumulation of altered genetic materials [6, 7]. Also, past studies have shown that elevated interleukin-6 (IL-6)/JAK/STAT3 signalling is one of the key pathways involved in the initiation, development and formation of rectal adenocarcinoma [7]. Given its high mortality, early diagnosis of rectal adenocarcinoma is critical to improve the survival rate. Hence, identification of novel biomarkers of rectal adenocarcinoma will be of great importance in promoting the survival rate of patients with rectal adenocarcinoma.
Metastasis suppressor 1 (MTSS1, also known as MIM for missing in metastasis) was identified to play a role in invasion and metastasis of bladder cancer [8]. Previous studies have shown that MTSS1 was a significant cancer-related gene and possessed important functions in many human cancers, including pancreatic cancer, breast cancer, ovarian cancer, and cervical carcinoma [9-12]. Correspondingly, down-regulation of MTSS1 was shown to be correlated with the poor prognosis of patients with oesophageal squamous cell carcinoma [13]. Mechanistically, MTSS1 can interact with the cytoskeleton and assemble in actins to maintain cell shape and cell-cell junction stability, and MTSS1 may serve as an adaptor molecule to regulate the intracellular signalling pathway and actin remodelling in acute myeloid leukemia [8, 14]. However, the expression status of MTSS1 and its clinical significance in rectal adenocarcinoma remain unclear.
Many known prognostic factors including the stage, metastasis and size of residual tumor can predict survival and recurrence. Nevertheless, patients bearing the same above-mentioned factors may have different prognosis, and other factors, including biomarkers may also exist and affect patient’s outcomes after treatments. Therefore, it is important to identify new prognostic factors that can better predict the prognosis of patients and assist in the selection of treatment direction. In the present study, we employed molecular and histo-biochemical approaches to analyse the expression levels of MTSS1 in rectal adenocarcinoma cell lines and tissues obtained from patients and examined the correlation between its expression and the prognosis of patients with rectal adenocarcinoma.
Materials and Methods
I Cell Culture
LoVo, SW480, and HRC-99 were obtained from American Type Culture Collection (ATCC, USA), and cultured in DMEM with high glucose medium (Life Technology, USA) supplemented with 10% fetal bovine serum (Gibco BRL Co.Ltd., USA), 1% non-essential amino acid (Life Technology, USA), and 1% antibiotics (100 U/ml penicillin and 100 μg/ml streptomycin) in a 37°C incubator with 5% CO2-humidified atmosphere.
II Tissue Samples and Patient Information
All patients were recruited at the First Affiliated Hospital of Hainan Medical University between 1/1/2005 and 12/31/2010. Medical records were reviewed to obtain demographic and clinical data including age, pathologic differentiation stages such as T, N, M, Dukes, and UICC, surgical methods, recurrence, and follow-up results. All patients were diagnosed with rectal adenocarcinoma by different pathologists, and those patients who had previously received radiotherapy or chemotherapy were excluded from this study. All patients were treated at the First Affiliated Hospital of Hainan Medical University. The specimens used for Western blot and quantitative PCR (qPCR) analysis were obtained from four pairs of matched fresh tumor tissues and adjacent normal tissues. The tumor purity in these tissue sections for RNA and protein analysis was tested by using a histopathological protocol. In addition, a total of 180 cancer tissue samples and 50 benign rectal tumor tissue samples were collected for IHC.
III qPCR
cDNA was synthesized with iScript™ cDNA Synthesis Kit (Promega, USA) on RNA that was isolated from cultured cells and primary tumor tissues. qPCR was performed with a pair of primers specifically designed for targeting human MTSS1: forward, 5’-GAAGGCATCCTGGGATAGA-3’, and reverse, 5’-TATCAGACGCCACCCTCTTC-3’. qPCR conditions were as follows: 1 cycle of initial denaturation at 95°C for 10 min, 45 cycles of 95°C for 15s, 60°C for 60s and 72°C 15s, and 1 cycle of final extension at 72°C 7 min. GAPDH was used as an internal reference gene and the sequences of GAPDH primers are: forward, 5’-CGAGATCCCTCCAAAATCAA-3’, and reverse, 5’-TGTGGTCATGAGTCCTTCCA-3’. All reactions were run in three replicates. Relative expression levels of MTSS1 were calculated by 2-△△Ct formula.
IV Western Blot
Whole protein lysates were purified from cultured cells or tissues with radioimmunoprecipitation assay buffer (RIPA buffer) (Cell Signaling Technology, Danvers) that contained a complete protease inhibitor cocktail (Roche Applied Science, Mannheim, Germany). A total of 20 μg protein of each sample was separated in 10% SDS-PAGE and transferred to PVDF membranes (Invitrogen, CA, USA). The PVDF membrane was blocked in 5% skimmed milk (with 0.1% Tween 20 and Tris-buffered saline) for 1 hour at room temperature (RT). Thereafter, the membrane was incubated with anti-MTSS1 antibodies (1:1000, Abcam, UK) at 4°C overnight, followed by another incubation with a horseradish peroxidase-conjugated goat anti-rabbit antibody for 1 hour at RT. GAPDH was used as an internal control. Chromogenic reaction was performed to detect the protein expression level.
V Immunohistochemistry
Tissue sections (4 μm thickness) were dewaxed, hydrated, and boiled for 10-15 min in the EDTA-antigen-repair buffer for antigenic retrieval. After then, slides were treated with methanol containing 3% H2O2, blocked in1% BSA, and incubated with the primary MTSS1 antibody (1:200, Abcam, UK) at 4°C overnight. The slides incubated with goat serum were used as a negative control. Thereafter, the slides were incubated with biotinylated anti-rabbit secondary antibodies (Santa Cruz Biotechnology, USA), followed by incubation with the streptavidin-horseradish peroxidase complex (Abcam, UK). After then, 3’-diaminobenzidine and 10% Mayer’s hematoxylin were added for chromogenic reaction.
The expression levels of MTSS1 were evaluated by the product of the positive-cell-proportion and the staining-intensity score. The staining intensity was scored by two pathologists independently. The proportion of tumor cells was graded according to the following rules: the proportion of positive tumor cells corresponding to grade 0-4 was less than 5%, 6-25%, 26~50%,51%~75% and more than 75%, respectively. In addition, the grade 0-4 level of intensity of staining corresponded to colourless (no staining), light yellow (weak), yellow brown (moderate) and brown (strong), respectively. The cut-off values for the MTSS1 expression were the mid-values of all products. An optimal cut-off value was identified as follows: less than or equal to a score of 4 was defined as low expression of MTSS1 in the tumor tissue, and greater than or equal to 6 was defined as high expression.
VI Statistical Analyses
All statistical analyses were performed by using SPSS software (version:16.0). The correlation between the MTSS1 expression level and clinical features of tumors was determined by Pearson's chi-square and Fisher exact test. The correlation between the MTSS1 expression level and progression-free survival (PFS) and overall survival (OS) was analysed by Kaplan-Meier curve. Survival curves were compared by logarithmic rank test. PFS was defined as the total time from the initiation of the treatment to the onset of recurrence or progression, which was determined by imaging data and clinical evaluation. OS was defined as the total time from the beginning of surgery to the death of patients or the last follow-up time conducted in this study. Multivariate Cox regression analysis was performed for univariate and multivariate analysis of all clinicopathological variables. That was found to be significant by univariate analysis. A p value less than 0.05 was considered statistically significant.
Results
I MTSS1 Expression was Downregulated in Rectal Adenocarcinoma Cells
We first performed qPCR and Western blot to examine the expression of MTSS1 at both transcription and protein levels in three rectal adenocarcinoma cell lines, LoVo, SW480, HRC-99 and normal rectal tissues. As shown in (Figure 1A), the transcription of MTSS1 was at least 4-fold lower in the rectal adenocarcinoma cell lines compared with that in the normal rectal cells. Consistent with this observation, Western blot analysis also showed that the MTSS1 was highly expressed in the normal rectal tissues but weakly expressed in the rectal adenocarcinoma cell lines (Figure 1B). Thus, the MTSS1 expression is downregulated in rectal adenocarcinoma cells.
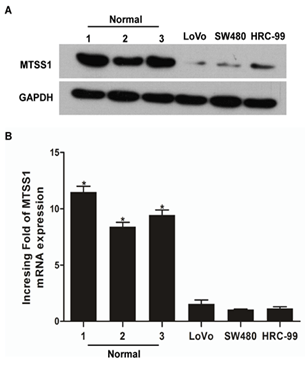
Figure 1: Downregulation of MTSS1 expression in rectal adenocarcinoma cells. A) qPCR and B) Western blotting were performed to examine the transcription and protein levels of MTSS1 in rectal adenocarcinoma cell lines (LoVo, SW480 and HRC-99) and normal rectal tissues, and respectively. Expression levels were normalized to GAPDH. Error bars represent standard deviation of the mean (SD) calculated from three independent experiments. *p<0.05.
II MTSS1 Expression was Downregulated in Rectal Adenocarcinoma Tissues
Next, we employed the same methods as mentioned above to analyse the MTSS1 mRNA and protein expression in four matched pairs of rectal adenocarcinoma specimens (T) and adjacent noncancerous tissue samples (ANT). The transcription of MTSS1 was significantly lower in all rectal adenocarcinoma tissues compared to that of the adjacent noncancerous tissues, with the differential expression levels ranging from 4.4-11.8 fold (Figure 2A). In line with this finding, the MTSS1 protein levels were also downregulated in rectal adenocarcinoma tissues compared with that of ANT (Figures 2B & 3). We conclude that rectal adenocarcinoma tissues have lower expression levels of MTSS1 compared with the ANT.
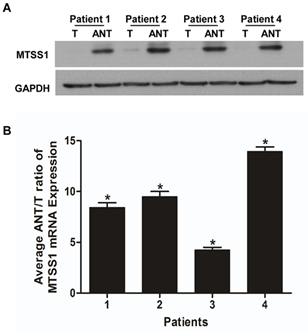
Figure 2: Downregulation of MTSS1 expression in rectal adenocarcinoma tissues. A) ANT/T ratios of MTSS1 mRNA expression in each of the four patients analysed. Experiments were performed in triplicate and data were normalized to the GAPDH expression. B) Representative images of Western blotting showing the MTSS1 expression in four matched pairs of rectal adenocarcinomas (T) and adjacent noncancerous tissues (ANT). GAPDH serves as a loading control. Error bars represent the standard deviation of the mean (SD) calculated from three independent experiments. *P<0.05.
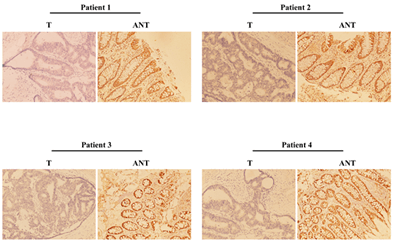
Figure 3: Representative images of immunohistochemistry showing the MTSS1 expression in four pairs of matched rectal adenocarcinoma and normal tissues.
III Downregulation of MTSS1 was Associated with Rectal Adenocarcinoma Clinical Features
Out of 180 patients with rectal adenocarcinoma, 37, 50, 84 and 9 had stage I to IV tumors with a median survival age of 58 years (range, 13 ~ 84 years), respectively. All 180 patients received initial treatments, including surgery. There was a statistically significant correlation between the expression levels of MTSS1 and the clinicopathological characteristics of rectal adenocarcinoma (p<0.001 for the T stage, Dukes stage, UICC stage, recurrence and vital status at follow-up, and p=0.002 for the N stage). However, there was no significant correlation of MTSS1 expression with age, pathological differentiation, M stage and other clinicopathological features (Table 1). Logistic multivariate analysis indicated that the MTSS1 expression was significantly correlated with tumor stage (P=0.049), but not with peritoneal cytology and the ascites volume (P>0.05). In addition, the MTSS1 expression levels in patients with an advanced tumor were significantly lower than that in patients with an early stage tumor (Table 1). Thus, MTSS1 expression levels are associated with the clinical manifestations of rectal adenocarcinoma.
Table
1: Clinicopathological
characteristics of patients with rectal adenocarcinoma and their
correlations with MTSS1 expression.
|
Characteristics |
Number of cases (%) |
MTSS1 expression (%) |
P value |
|
|
Low or no expression |
High expression |
|
||
|
Age (years, median 59 years) |
|
|
|
P=0.528 |
|
<median |
88(48.9) |
61(50.8) |
27(45) |
|
|
≥median |
92(51.1) |
59(49.2) |
33(55) |
|
|
Gender |
|
|
|
P=0.749 |
|
Male |
104(57.8) |
68(56.7) |
36(43.3) |
|
|
Female |
76(42.2) |
52(60.0) |
24(40.0) |
|
|
Pathologic differentiation |
|
|
|
P=0.255 |
|
Well |
10(5.6) |
7(5.8) |
3(5.0) |
|
|
Moderately |
148(82.2) |
95(79.2) |
53(88.3) |
|
|
Poorly |
22(12.2) |
18(15) |
4(6.7) |
|
|
T stage |
|
|
|
P<0.001 |
|
T 1 |
5(2.7) |
0(0) |
5(8.4) |
|
|
T 2 |
46 (25.6) |
19(15.8) |
27(45.0) |
|
|
T 3 |
46(25.6) |
35(29.2) |
11(18.3) |
|
|
T 4 |
83(46.1) |
66(55.0) |
17(28.3) |
|
|
N stage |
|
|
|
P=0.002 |
|
N0 |
91(50.6) |
50(41.7) |
41(68.3) |
|
|
N1 |
54(330) |
48(40.0) |
6(10.0) |
|
|
N2 |
35(19.4) |
22(18.3) |
13(21.7) |
|
|
M stage |
|
|
|
P=0.275 |
|
M0 |
171(95) |
112 (93.3) |
59(98.3) |
|
|
M1 |
9(5) |
8(6.7) |
1(1.7) |
|
|
Dukes stage |
|
|
|
P<0.001 |
|
A |
37(15.0) |
8(6.7) |
29(48.30) |
|
|
B |
50(16.4) |
38(31.7) |
12(20.0) |
|
|
C |
84(68.6) |
66(55.0) |
18(30.0) |
|
|
D |
9(76.4) |
8(6.7) |
1(1.7) |
|
|
UICC stage |
|
|
|
P<0.001 |
|
I |
37 (20.6) |
8(6.7) |
29(48.3) |
|
|
II |
50(27.8) |
38(31.7) |
12(20.0) |
|
|
III |
84(46.7) |
66(59.2) |
18(30.0) |
|
|
IV |
9(5) |
8(6.7) |
1(1.7) |
|
|
Surgical method |
|
|
|
P=0.134 |
|
Harfmann's |
8(4.4) |
7(5.8) |
1(1.7) |
|
|
Miles' |
41(22.8) |
31(25.8) |
10(16.7) |
|
|
Dixon's |
131(72.8) |
82(68.3) |
49(81.7) |
|
|
Recurrence |
|
|
|
P<0.001 |
|
No |
141(78.3) |
82(68.3) |
59(98.3) |
|
|
Yes |
39(21.7) |
38(37.1) |
1(1.7) |
|
|
Vital status (at follow-up) |
|
|
|
P<0.001 |
|
Alive |
114(63.3) |
59(49.2) |
55(91.7) |
|
|
Dead |
66(36.7) |
61(50.8) |
5(8.3) |
|
IV Low Expression Levels of MTSS1 were Correlated with Poor Prognosis of Patients with Rectal Adenocarcinoma
We next examined the correlation between the expression levels of MTSS1 and the survival of patients with rectal adenocarcinoma. We followed these patients for 1-108 months and found 115 death cases and 65 survival cases during this follow-up period. The medians for PFS and OS were 70 and 75 months, respectively. Kaplan-Meier analysis showed that there was a significant positive correlation between the MTSS1 expression levels and OS and between the MTSS1 expression levels and PFS in rectal adenocarcinoma patients, respectively (P<0.001, Figures 4A & 4B). We also used the Cox proportional hazards model to determine whether the MTSS1 expression levels could be used as an independent prognostic factor for OS and PFS (Table 2). We examined several potential prognostic factors including differentiation stages such as T, N, Dukes, and UICC stage, recurrence and MTSS1 expression, and found that only tumor UICC stage (P=0.009), recurrence (P<0.001) and MTSS1 down-regulated expression (P=0.002) were independent prognostic factors for poor OS. Similarly, Cox regression analysis revealed that UICC stage (P=0.017), recurrence (P<0.001) and downregulated expression of MTSS1 (P=0.003) were also independent prognostic factors for poor PFS (Table 2).
Table 2: Multivariate analysis
of prognostic factors for rectal adenocarcinoma patients.
|
Outcomes |
Variable |
HR |
P |
95%CI |
|
OS
|
N Stage M Stage UICC Stage MTSS1 expression Recurrence |
0.012 2.171 2.861 6.797 9.770 39.596 |
0.911 0.141 0.091 0.009 0.002 <0.001 |
0.492-1.884 0.855-3.028 0.191-1.130 1.231-4.341 0.075-0.553 3.932-13.573 |
|
|
Variable |
HR |
P |
95%CI |
|
PFS
|
T Stage N Stage M Stage UICC Stage MTSS1 expression Recurrence |
0.222 1.367 0.067 5.718 8.909 53.361 |
0.637 0.242 0.796 0.017 0.003 <0.001 |
0.436-1.662 0.773-2.770 0.462-2.739 1.150-4.079 0.081-0.595 5.886-21.595 |
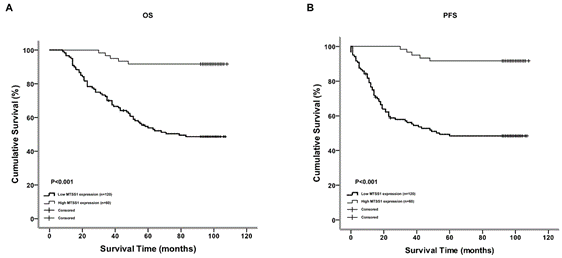
Figure 4: The expression level of MTSS1 is correlated with the overall survival and progression free survival. Kaplan-Meier curves with univariate analysis (log-rank) are established for rectal adenocarcinoma patients with low MTSS1 expression (n=120) versus high MTSS1 expression (n=60) for A) OS and B) PFS.
Discussion
In the present study, we showed that both mRNA and protein levels of MTSS1 were downregulated in rectal adenocarcinoma cells and tissues, and that this downregulation was significantly correlated with the advanced stages of this disease. In addition, the MTSS1 expression level was an independent prognostic factor for patients with rectal adenocarcinoma. In human, the MTSS1 gene is located on chromosome 8q24.1, and was first identified in bladder cancer, suggesting that MTSS1 may be implicated in invasion and metastasis in bladder cancer [7]. Previous studies have shown that MTSS1 was a significant cancer-related gene and that had important functions in many human cancers. If expressed compulsively, MTSS1 significantly inhibits the occurrence of malignant phenotypes such as tumor cell growth, migration and invasion.
Previously, the MTSS1 expression was shown to be downregulated in a variety of human cancer samples, which was correlated to unfavourable clinical outcomes. For example, decreased expression of MTSS1 is associated with poor prognosis in patients with esophageal squamous cell carcinoma [13]. Previous studies on the expression levels of MTSS1 in rectal adenocarcinoma revealed discrepant observations. Compared with the normal tissues, MTSS1 protein levels were shown to be significantly lower in colorectal carcinoma in one study, but higher in another [15, 16]. The exact mechanisms leading to these discrepant findings were not clear, but probably involved multiple factors such as regional and ethnic differences, environmental cues. In the present study, we found that the MTSS1 expression was downregulated in rectal adenocarcinoma cells and human rectal cancerous tissues compared with controls.
In the present investigation, we also revealed that the decreased expression of MTSS1 was associated with the disease progression and poor outcomes of patients with rectal adenocarcinoma, and we believe that MTSS1 may be regarded as a potential prognostic factor. Surgery is the mainstay of treatment for rectal adenocarcinoma. Despite advances in surgical technologies and new chemotherapy regimens, the OS rate of patients with rectal adenocarcinoma was still poor [3-5]. In the present study, we not only showed that the reduced expression level of MTSS1 was associated with the tumor stages, but also revealed that the lower protein expression levels of MTSS1 were significantly correlated with the shorter PFS time and poorer OS of patients with rectal adenocarcinoma. Multivariate analysis further indicated that the expression level of MTSS1 was an independent prognostic factor for the outcomes of patients with rectal adenocarcinoma. Collectively, these findings suggested that MTSS1 was involved in the progression of rectal adenocarcinoma, and that the diminished expression level of MTSS1 was predictive of poor patients’ outcomes. Hence, MTSS1 may serve as a prognostic factor for patients with rectal adenocarcinoma.
Some limitations of this study needed to be acknowledged. For example, in the current study, our patients were solely from the Chinese population. Thus, whether our conclusion may be extrapolated to other populations needs to be corroborated in the future studies. Also, the mechanisms by which MTSS1 promotes the development, progression and metastasis of rectal adenocarcinoma merits investigation in the future.
Conclusion
We demonstrate that the expression levels of MTSS1 are downregulated in rectal adenocarcinoma and that this downregulation is associated with the late stages of this disease. Patients with lower MTSS1 expression have shorter PFS and poor OS. Therefore, the MTSS1 expression level may serve as an independent prognostic factor for patients with rectal adenocarcinoma.
Acknowledgement
We would like to appreciate the supports by Major Science and Technology Programme of Hainan Province (No. ZDKJ2017007), National Natural Science Foundation of China (No. 81060016, 31140021, 81260032, 81460034, 81660433), Hainan Provincial Department of Science and Technology (812201, ZDZX2013003 and KJHZ2014-11).
Funding
This study was granted from Health Commission of Zhejiang Province (JBZX-202004).
Ethical Approval
Our study was approved by the Institutional Research Ethics Committee of the First Affiliated Hospital of Hainan Medical University.
Consent
Prior to the initiation of this study, all patients had signed written consent forms and were followed up until 1/1/2015.
Conflicts of Interest
None.
Abbreviation
MTSS1/MIM: Metastasis Suppressor 1
UICC: Union for International Cancer Control
PFS: Progress-Free Survival
ANT: Adjacent Noncancerous Tissue
T: Tissue
OS: Overall Survival
IHC: Immunohistochemical
qPCR: Quantitative PCR
PVDF: Polyvinylidene Fluoride
TBST: Tris-Buffered Saline with 0.1% Tween 20
PBS: Phosphate-Buffered Saline
RIPA: Radio Immunoprecipitation Assay
GAPDH: Glyceraldehyde-3-phosphate dehydrogenase
Article Info
Article Type
Research ArticlePublication history
Received: Thu 07, Oct 2021Accepted: Mon 25, Oct 2021
Published: Thu 18, Nov 2021
Copyright
© 2023 Changku Jia. This is an open-access article distributed under the terms of the Creative Commons Attribution License, which permits unrestricted use, distribution, and reproduction in any medium, provided the original author and source are credited. Hosting by Science Repository.DOI: 10.31487/j.JSO.2021.03.01
Figures & Tables
Table
1: Clinicopathological
characteristics of patients with rectal adenocarcinoma and their
correlations with MTSS1 expression.
|
Characteristics |
Number of cases (%) |
MTSS1 expression (%) |
P value |
|
|
Low or no expression |
High expression |
|
||
|
Age (years, median 59 years) |
|
|
|
P=0.528 |
|
<median |
88(48.9) |
61(50.8) |
27(45) |
|
|
≥median |
92(51.1) |
59(49.2) |
33(55) |
|
|
Gender |
|
|
|
P=0.749 |
|
Male |
104(57.8) |
68(56.7) |
36(43.3) |
|
|
Female |
76(42.2) |
52(60.0) |
24(40.0) |
|
|
Pathologic differentiation |
|
|
|
P=0.255 |
|
Well |
10(5.6) |
7(5.8) |
3(5.0) |
|
|
Moderately |
148(82.2) |
95(79.2) |
53(88.3) |
|
|
Poorly |
22(12.2) |
18(15) |
4(6.7) |
|
|
T stage |
|
|
|
P<0.001 |
|
T 1 |
5(2.7) |
0(0) |
5(8.4) |
|
|
T 2 |
46 (25.6) |
19(15.8) |
27(45.0) |
|
|
T 3 |
46(25.6) |
35(29.2) |
11(18.3) |
|
|
T 4 |
83(46.1) |
66(55.0) |
17(28.3) |
|
|
N stage |
|
|
|
P=0.002 |
|
N0 |
91(50.6) |
50(41.7) |
41(68.3) |
|
|
N1 |
54(330) |
48(40.0) |
6(10.0) |
|
|
N2 |
35(19.4) |
22(18.3) |
13(21.7) |
|
|
M stage |
|
|
|
P=0.275 |
|
M0 |
171(95) |
112 (93.3) |
59(98.3) |
|
|
M1 |
9(5) |
8(6.7) |
1(1.7) |
|
|
Dukes stage |
|
|
|
P<0.001 |
|
A |
37(15.0) |
8(6.7) |
29(48.30) |
|
|
B |
50(16.4) |
38(31.7) |
12(20.0) |
|
|
C |
84(68.6) |
66(55.0) |
18(30.0) |
|
|
D |
9(76.4) |
8(6.7) |
1(1.7) |
|
|
UICC stage |
|
|
|
P<0.001 |
|
I |
37 (20.6) |
8(6.7) |
29(48.3) |
|
|
II |
50(27.8) |
38(31.7) |
12(20.0) |
|
|
III |
84(46.7) |
66(59.2) |
18(30.0) |
|
|
IV |
9(5) |
8(6.7) |
1(1.7) |
|
|
Surgical method |
|
|
|
P=0.134 |
|
Harfmann's |
8(4.4) |
7(5.8) |
1(1.7) |
|
|
Miles' |
41(22.8) |
31(25.8) |
10(16.7) |
|
|
Dixon's |
131(72.8) |
82(68.3) |
49(81.7) |
|
|
Recurrence |
|
|
|
P<0.001 |
|
No |
141(78.3) |
82(68.3) |
59(98.3) |
|
|
Yes |
39(21.7) |
38(37.1) |
1(1.7) |
|
|
Vital status (at follow-up) |
|
|
|
P<0.001 |
|
Alive |
114(63.3) |
59(49.2) |
55(91.7) |
|
|
Dead |
66(36.7) |
61(50.8) |
5(8.3) |
|
Table 2: Multivariate analysis
of prognostic factors for rectal adenocarcinoma patients.
|
Outcomes |
Variable |
HR |
P |
95%CI |
|
OS
|
N Stage M Stage UICC Stage MTSS1 expression Recurrence |
0.012 2.171 2.861 6.797 9.770 39.596 |
0.911 0.141 0.091 0.009 0.002 <0.001 |
0.492-1.884 0.855-3.028 0.191-1.130 1.231-4.341 0.075-0.553 3.932-13.573 |
|
|
Variable |
HR |
P |
95%CI |
|
PFS
|
T Stage N Stage M Stage UICC Stage MTSS1 expression Recurrence |
0.222 1.367 0.067 5.718 8.909 53.361 |
0.637 0.242 0.796 0.017 0.003 <0.001 |
0.436-1.662 0.773-2.770 0.462-2.739 1.150-4.079 0.081-0.595 5.886-21.595 |
References
1. Cancer Registry Federation of Bosnia and Herzegovina
(2011) Overview of Malignant neoplasm. Publ Heal Insti Feder Bosni Herze.
2. Massarweh NN, Hu CY, You YN, Bednarski BK, Rodriguez
Bigas MA et al. (2014) Risk-adjusted pathologic margin positivity rate as a
quality indicator in rectal cancer surgery. J Clin Oncol 32: 2967-2974.
[Crossref]
3. Vignali A, De Nardi P (2014) Multidisciplinary
treatment of rectal cancer in 2014: where are we going? World J
Gastroenterol 20: 11249-11261. [Crossref]
4. Lee JJ, Sun W (2016) Options for Second-Line Treatment
in Metastatic Colorectal Cancer. Clin Adv Hema Onco 14: 46-54.
5. Ferlay J, Soerjomataram I, Dikshit R, Eser S, Mathers
C et al. (2015) Cancer incidence and mortality worldwide: sources, methods and
major patterns in GLOBOCAN 2012. Int J Cancer 136: E359-E386. [Crossref]
6. Schimanski CC, Zimmermann T, Schmidtmann I, Gockel I,
Lang H et al. (2010) K-ras mutation status correlates with the expression of
VEGFR1, VEGFR2, and PDGFRalpha in colorectal cancer. Int J Colorectal Dis
25: 181-186. [Crossref]
7. Wang SW, Sun YM (2014) The IL-6/JAK/STAT3 pathway:
potential therapeutic strategies in treating colorectal cancer (Review). Int
J Oncol 44: 1032-1040. [Crossref]
8. Lee YG, Macoska JA, Korenchuk S, Pienta KJ (2002) MIM,
a potential metastasis suppressor gene in bladder cancer. Neoplasia 4:
291-294. [Crossref]
9. Zhou L, Li J, Shao QQ, Guo JC, Liang ZY et al. (2016)
Expression and Significances of MTSS1 in Pancreatic Cancer. Pathol Oncol Res
22: 7-14. [Crossref]
10. Lei R, Tang J, Zhuang X, Deng R, Li G et al. (2014) Suppression of MIM by microRNA-182 activates RhoA and promotes
breast cancer metastasis. Oncogene 33: 1287-1296. [Crossref]
11. Liu R, Martin TA, Jordan NJ, Ruge F, Ye L et al.
(2015) Metastasis suppressor 1 expression in human ovarian cancer: The impact
on cellular migration and metastasis. Int J Oncol 47: 1429-1439. [Crossref]
12. Zhang J, Tong Y, Ren L, Li CD (2014) Expression of
metastasis suppressor 1 in cervical carcinoma and the clinical significance. Oncol
Lett 8: 2145-2149. [Crossref]
13. Xie F, Ye L, Chen J, Wu N, Zhang Z et al. (2011) The
impact of Metastasis Suppressor-1, MTSS1, on oesophageal squamous cell
carcinoma and its clinical significance. J Transl Med 9: 95. [Crossref]
14. Schemionek M, Masouleh BK, Klaile Y, Krug U,
Hebestreit K et al. (2015) Identification of the Adapter Molecule MTSS1 as a
Potential Oncogene-Specific Tumor Suppressor in Acute Myeloid Leukemia. PLoS
One 10: e0125783. [Crossref]
15. Wu W, Wang Z, Yang P, Yang J, Liang J et al. (2014) MicroRNA-135b regulates metastasis suppressor 1 expression and promotes migration and invasion in colorectal cancer. Mol Cell Biochem 388: 249-259. [Crossref]
16. Wang D, Xu MR, Wang T, Li T, Zhu JW (2011) MTSS1 overexpression correlates with poor prognosis in colorectal cancer. J Gastrointest Surg 15: 1205-1212. [Crossref]