Cytotoxicity of SH-SY5Y Neuroblastoma Cells to the Antipsychotic Drugs, Chlorpromazine and Trifluoperazine, is via a Ca2+ -Mediated Apoptosis Process and Differentiation of These Cells with Retinoic Acid Makes Them More Resistant to Cell Death
A B S T R A C T
Neuroblastomas usually occur in childhood and can have a relatively poor prognosis. Additionally, some antipsychotic drugs have been suggested to be neurotoxic, suggesting they might have therapeutic potential against neuronal cancer cells. In this study it was shown that 7 days treatment with 10 µM all-trans retinoic acid (ATRA) could alter SH-SY5Y (an undifferentiated neuroblastoma cell line) morphology in terms of neurite outgrowths and increased expression of the growth associated protein (GAP43), thus indicating that ATRA-treatment made these cells more differentiated in character. Next, a comparison of the effects of chlorpromazine and trifluoperazine, two types of typical first-generation antipsychotic drugs, on the cytotoxicity of both undifferentiated and ATRA-differentiated SH-SY5Y cells was undertaken. The results showed that both chlorpromazine and trifluoperazine, were highly cytotoxic to undifferentiated SH-SY5Y cells (LC50 values 5µM and 6µM, respectively). They were also deemed to be more selective towards neuronal cells compared to non-neuronal cells (COS7 cells). it was shown that cell death induced by chlorpromazine and trifluoperazine occurred mostly by Ca2+-mediated apoptosis. Furthermore, the cytotoxicity of chlorpromazine and trifluoperazine was decreased when the cells were differentiated with ATRA (LC50 values of 10.5µM and 12µM, respectively), indicating a possible therapeutic window for the potential use of chlorpromazine and trifluoperazine and potentially other FGAs in the treatment of neuroblastomas.
Keywords
Antipsychotic drugs, chlorpromazine, trifluoperazine, SH-SY5Y cells, retinoic acid, differentiated
Introduction
Neuroblastomas are a common extra-cranial solid cancer that commonly occurs in children under the age of 5 years, with the average age of diagnosis being around 18 months [1]. Neuroblastomas mostly develop from the adrenal gland, but they can also form in sympathetic nervous tissue, including in the para-spinal sympathetic ganglia in the abdomen and chest [1-3]. Although there has been some improvement in prognosis of patients over the past few years, patients with this type of cancer still have relatively poor long-term survival rates [1].
SH-SY5Y cells are derived from human neuroblastoma cells and are a commonly used in vitro model for neuronal cells. This cell line is a sub-line of SK-N-SH cells that was established in 1970 in cultures from a bone marrow biopsy of a metastatic neuroblastoma from a 4-year-old female [4]. By their nature, cancer-derived cell lines are undifferentiated and typically highly proliferative. SH-SY5Y neuroblastoma cells have the ability to be differentiated into cells possessing a more mature, neuron-like phenotype through manipulation of the culture medium [5]. For example, differentiated neuronal SH-SY5Y cells can be generated by treating cells with all trans retinoic acid (ATRA) [6].
Previous studies have suggested that patients with schizophrenia have a lower risk of a number of different cancers compared to the rest of the population [7, 8]. Many researchers have been investigating the possible link between the reduction of cancer and schizophrenia [9, 10]. Genetic factors and antipsychotic drugs have both been considered as possibilities for the reduced cancer levels in these patients [11-13]. The aim of this study is to identify the major mechanism by which these antipsychotic drugs induce neuronal cell death and to determine whether differentiation of the neuroblastoma cells with ATRA affects drug cytotoxicity.
Materials & Methods
Stock solutions were prepared by dissolving each drug in DMSO. Because of its known toxicity, the cells were incubated with DMSO alone to determine the correct concentration to use in order to minimise DMSO-induced cell death, which was determined to be < 0.2% v/v. The concentrations of the stock solutions used were 15 mM chlorpromazine (Sigma-Aldrich), 15 mM trifluoperazine (Sigma-Aldrich). All-trans retinoic acid (Sigma-Aldrich) (ATRA) is the most common reagent used for differentiating SH-SY5Y cells using a concentration range from 1 to 100 µM for different periods [4, 14, 15]. In this study, 10 µM of ATRA was used with a lower concentration of FBS (2.5% v/v rather than 10% v/v). SY-SY5Y cells were plated in a 6-well cell culture plate at a density of 1×10⁵ cells/well with complete growth media (DMEM, 10% v/v FBS, 1% NEAA, 1% Pen/strep, 2 mM L-Glutamine) for 24 hours. After 24 hours, 2 ml of fresh differentiation media containing; DMEM, 2.5% v/v FBS, 1% NEAA, 1% Pen/strep, 2 mM L-Glutamine and 10 µM ATRA, was added to each well and changed every two days for up to 7 days. Cells were viewed and imaged using a Nikon TS100 inverted fluorescence microscope.
For cell viability assays of these adherent cells, the crystal violet assay was used Cells were plated at 40x104 per well in a 24-well plate and incubated overnight [16]. The next day, the wells were washed with PBS, and then 4% paraformaldehyde in PBS (Affymetrix) was added to the cells and incubated in the CO2 incubator for 20 minutes. The cells were then washed with PBS and stained with 1% crystal violet (dissolved with 5% ethanol in dH2O) for 30 minutes at room temperature. Then the cells were washed three times with dH2O and left to air dry for 1 hour. 10% acetic acid was added to each well and incubated at room temperature for 20 minutes with shaking. The absorbance of the samples was measured using a plate reader set at a wavelength of 570 nm and acetic acid was used as the blank. In some cell viability experiments either 50µM caspases 3 inhibitor (Ac-DEVD-CMK) (Sigma-Aldrich) or 10µM BAPTA-AM (Sigma-Aldrich) was pre-incubated with the cells for 4 hours before the drugs were then added.
Cells treated with ATRA were collected over 7 days and proteins solubilized and extracted using RIPA buffer. Following protein determination, 30 μg of the cell protein extracts were added to each well of a 10% polyacrylamide gel and the proteins separated [17, 18]. Once the proteins were transferred onto PVDF membranes they were immune-stained with either anti-GAP 43 antibody (GeneTex), a growth associated protein, used as a neuronal differentiation marker, or with anti-actin antibody (Sigma-Aldrich) a housing keeping and loading marker [19].
To determine whether cell death was via apoptosis, the cells were seeded in sterilised 35-mm glass bottom dishes and incubated until they reached 70% confluency. The cells were treated with the drugs in media without FBS and phenol red and then incubated for 24 hours. After 24 hours, 2 µM of Nuc View 488 Caspase-3 substrate (Biotium) was added to the cells and left for 1 hour, then examined under the fluorescence microscope using a 20x Obj. lens under brightfield and fluorescence channels (λexc = 488 nm and λem = 502 nm).
For LDH release assays to monitor necrosis, cells were seeded in 6-well cell culture plates and incubated overnight. The next day, the old media was removed, and fresh media, without FBS or phenol red, was added. The cells were treated with drugs for 24 hours, and the control was treated with 10% Triton X-100 (Sigma-Aldrich) for 1 hour. The solution from each well was centrifuged at 1500 rpm for 10 minutes. In a cuvette, 500µL of each supernatant was added to 500 µL of the cocktail buffer (0.66mM Sodium pyruvate, 100mM Potassium phosphate, 0.23mM ß-Nicotinamide adenine dinucleotide NADH; pH 7), and the absorbance change was measured by a spectrophotometer at 340 nm. % LDH release was calculated as the experimental rate divided by the rate observed for the Triton X-100 treated cells.
Results
Bright field microscopy was used to determine morphological changes to SH-SY5Y cells treated with 10 µM ATRA for 7 days. The results presented in Figure 1A, show micrographs of control cells and SH-SY5Y cells treated with 10 µM of ATRA at different times (day 0 control, day 3, day 5, and day 7). There were obvious changes in cell appearance and particularly in the length of neurites on each cell. In control cells, some cells showed only a few neurites of relatively short length (Figure 1A). However, upon ATRA treatment for 7 days (Figure 1A), it was clear that most cells had longer neurites compared to control cells. These results were quantified as observed in Figure 1B, which showed that the neurites increased in length from < 50μm in the control cells to an average of 150μm, in cells treated with ATRA for 7 days. Figure 1 C & 1D shows that the expression of neuronal differentiation marker GAP 43 also increased substantially (by a factor of 3-4) upon exposure to 10μM ATRA over the 7 days.
After the confirmation of cell differentiation, when the SH-SY5Y cells had become more neuronal-like, the effects of the FGA drugs were tested on these cells. On the 7th day, the differentiation media was replaced with complete DMEM media (except without FBS), and SH-SY5Y cells were treated with chlorpromazine and trifluoperazine for 24 hours. Cell viability was then determined by the crystal violet assay. The results in (Figures 2A & 2B) show a significant difference in the toxic effect of chlorpromazine and trifluoperazine for differentiated and non-differentiated SH-SY5Y cells. In addition, it was also noted that cells treated with ATRA for 7 days had a lower number of viable cells compared to untreated cells. This probably also reflects the fact that differentiated cells proliferated more slowly than undifferentiated cells [20].
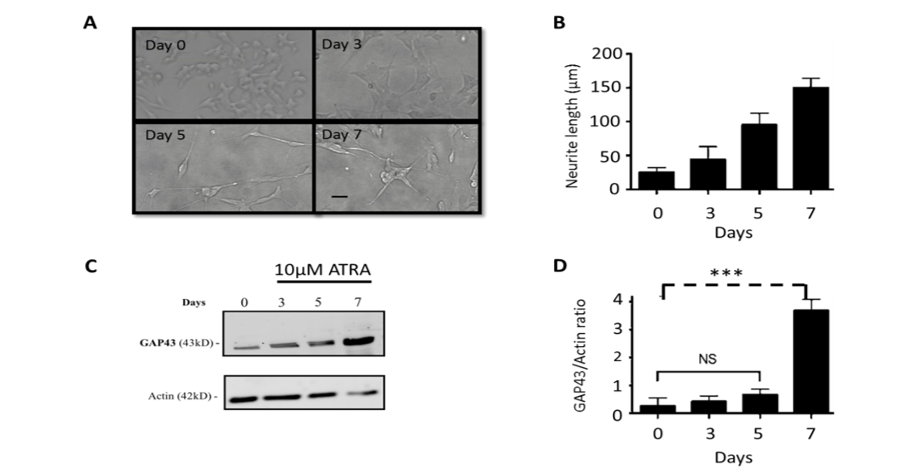
Figure 1: Effects of RA treatment on SH-SY5Y neuronal cells.
SH-SY5Y cells were plated in a 6-well plate at a density of 100,000 cells per well. After 24 hours, cells were incubated with media containing 10µM ATRA. (A) Images were taken under the light microscope 20x on days: 0, 3, 5, and 7 (black bar denotes 50µm) (B) shows the average increase of neurite length over the time period analysed. These results were typical of three separate experiments. (C) shows the immunoblot highlighting the increase in expression of the differentiation marker GAP43, as well as the immunoblot for actin, from protein extracts of the cells treated with ATRA over 7 days. (D) shows the ratio of GAP43 relative to Actin. The data represents the mean ± SD of three experiment; ***, p ≤ 0.001 for unpaired, 2-tailed t-test.
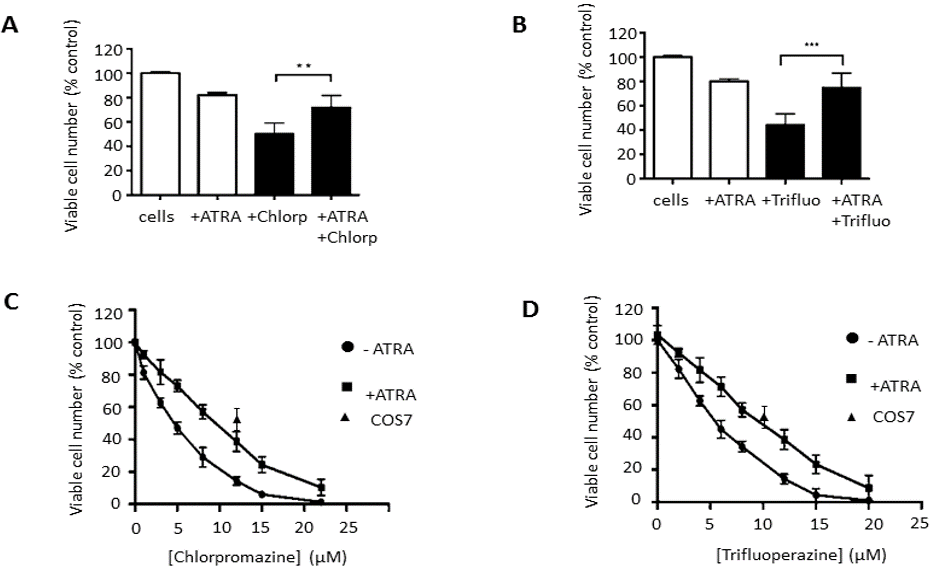
Figure 2: Effects of Chlorpromazine and Trifluoperazine on the viability of differentiated and undifferentiated SH-SY5Y cells.
The figures show the effects of ATRA on the cell viability of SH-SY5Y after 7 days of the treatment. Also shown is the effect of: (A) chlorpromazine (5 µM) and (B) Trifluoperazine (6µM) on untreated SH-SY5Y and differentiated SH-SY5Y cells. The results are presented as % to the control (DMSO-treated cells) of mean ± SD and repeated 3 times. (** p ≤ 0.01 and *** p ≤ 0.001, for the unpaired, two-tailed t-tests.) Also presented are the dose-dependent cell viability effects of (C) chlorpromazine and (D) trifluoperazine on both ATRA-differentiated and non-differentiated SH-SY5Y, as well as single concentration values for COS7 cells. Data are the mean ± SD of 3 repeats.
To determine the LC50 for chlorpromazine, the control and differentiated cells were treated with different concentrations of these drugs. As can be seen in (Figure 2C), the LC50 of chlorpromazine on SH-SY5Y was determined to be 5 ± 1 µM. However, there was an increase in the LC50 in the ATRA-differentiated SH-SY5Y cells to 10.5 ± 1.5 µM. Figure 2D also shows an increase of the LC50 for trifluoperazine from 6 ± 1 µM in the undifferentiated cells to 12 ± 2 µM in the ATRA-differentiated cells. Figures 2C & 2D also shows the effects on cell viability of 12μM chlorpromazine and 10μM trifluoperazine on the undifferentiated non-neuronal COS7 cells for comparison. These FGAs drugs were less cytotoxic to non-neuronal cells compared to undifferentiated SH-SY5Y neuronal cells.
In order to determine the major mechanism by which chlorpromazine and trifluoperazine cause cell death, Nuc-View 488 caspase-3 substrate was used. This method identifies cells undergoing apoptosis by causing the cells to emit green fluorescence when caspase 3 is activated within cells. Figure 3A shows a number of micrographs in which the untreated SH-SY5Y cells are viewed using a fluorescence microscope set to register both green fluorescence and low levels of white light in order to observe all cells. As can been seen in the DMSO control little or no brightly fluorescent cells can be observed, however, if treated with the LC50 for each drug, for 24 hours, the images show a substantial number of fluorescent cells. Upon quantification (Figure 3B & C) the % of apoptotic cells were determined to be 85 ± 5 % for chlorpromazine and 67 ± 12 % for trifluoperazine. Therefore, the major cell death pathway induced by these drugs is apoptosis.
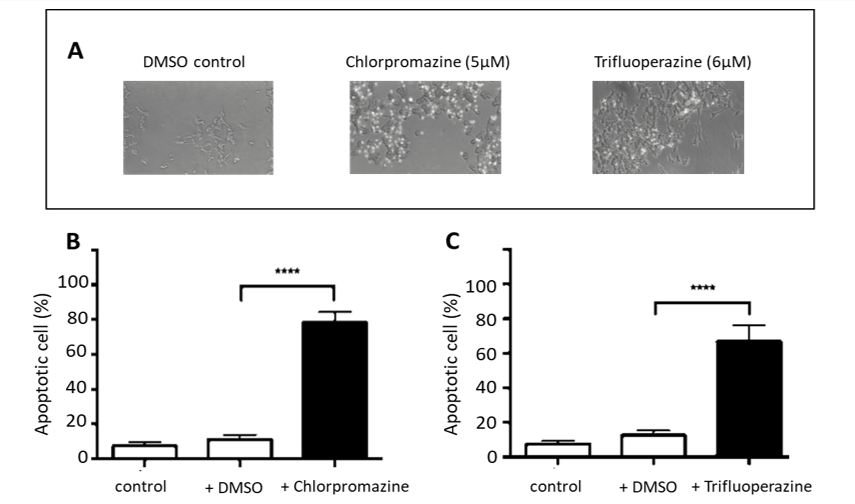
Figure 3: Effects of Chlorpromazine and Trifluoperazine on apoptosis of SH-SY5Y cells.
Cells were seeded in sterilised glass bottom dishes and incubated for 24 hours. After 24 hours, cells were treated with chlorpromazine and trifluoperazine and incubated for 24 hours. Before examination, cells were treated with 2 µM of caspase-3 fluorogenic substrate for 1 hour. (A) shows superimposed brightfield light and fluorescence images for cells treated with DMSO alone (control), cells treated with 5 µM chlorpromazine; and cells treated with 6 µM trifluoperazine. (B) shows the percentage of apoptotic cells when treated with chlorpromazine (5µM). (C) the percentage of apoptotic cells when treated with trifluoperazine (6µM). The data represented the mean ± SD, of 3 repeats. (statistically significant at **** p ≤ 0.0001, using unpaired, two-tailed t-tests.).
In order to further confirm whether cell death was by apoptosis and activated through caspase 3, The SH-SY5Y cells were preincubated with 50µM of the caspase 3 inhibitor (Ac-DEVD-CMK) for 4 hours prior to exposure with chlorpromazine (5µM) or trifluoperazine (6µM) for 24 hours, after which cell viability assays were performed. Figure 4A, clearly shows that preincubation with the caspase 3 inhibitor affords significant protection against cell death by both drugs by increasing the level of viable cells exposed to these drugs from about 50% in the absence of the caspase 3 inhibitor to about 80% viability in the co-presence of the caspase inhibitor.
As previous studies have also shown that exaggerated levels of cytosolic levels can be a potent mediator of cell death and we have previously demonstrated that these antipsychotic drugs can inhibit SERCA Ca2+ pumps which would contribute to cytosolic Ca2+ elevation, BAPTA-AM, membrane permeable Ca2+ chelator was used to ameliorate any such intracellular Ca2+ increases [21, 22]. Figure 4B again clearly shows that preincubation of the cells with 10µM BAPTA prior to treatment with both chlorpromazine and trifluoperazine again significantly improved cell viability which indicates that, at least in part, the cytotoxicity of the antipsychotic drugs is via a Ca2+-mediated mechanism. Furthermore, treatment of the cells by either chlorpromazine or trifluoperazine did not significantly increase the leakage of lactate dehydrogenase (LDH) from SH-SY5Y cells, indicating little effects on plasma membrane permeability, the major hallmark of necrosis (Figure 4C).
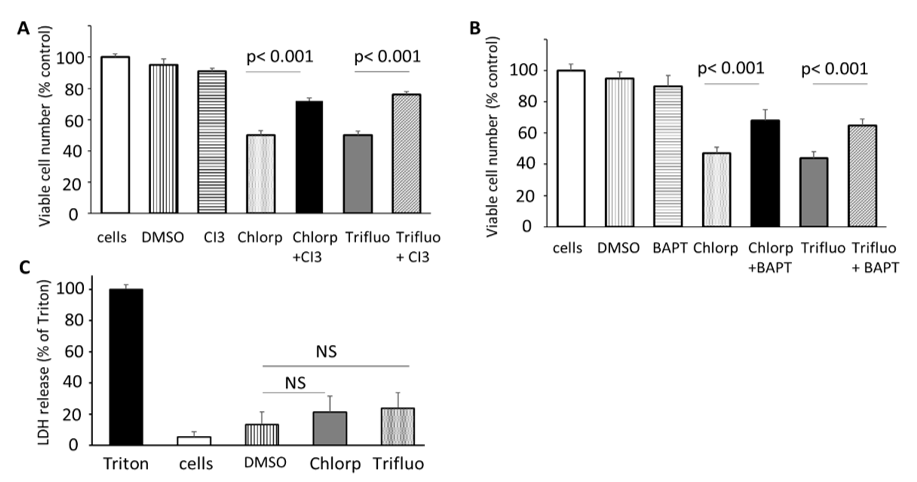
Figure 4: Effects of Chlorpromazine and Trifluoperazine on cell viability in the presence of Caspase 3 inhibitor and BAPTA-AM and on LDH release in SH-SY5Y cells.
Cells were plated at 40x104 per well in a 24-well plate and incubated overnight. Cells were then incubated with 1ml DMEM (without FBS or phenol red) and pre-incubated with either 50μM caspase 3 inhibitor (Ac-DEVD-CMK) (A) or the intracellular Ca2+ chelator, BAPTA-AM (10μM) (B) for 4 hours prior to treatment with chlorpromazine (5µM) or trifluoperazine (6µM) for 24 hours, after which cell viability assays were performed. Loss of membrane integrity (a marker for necrosis) was monitored by leakage of the cytosolic enzyme LDH. (C) Shows the relative amount (% compared to triton–treated cells) of LDH activity from the surrounding media when cells were incubated with chlorpromazine (5µM) or trifluoperazine (6µM) for 24 hours. 100% LDH release was deemed to occur when cells were treated with triton X.-100 for 1 hour. All values are the means ± SD and n=6, repeated 3 times. Statistical significance, p- values were determined, using unpaired, two-tailed t-tests.
Discussion
This study aimed to investigate the effects of FGA on more differentiated neuronal cells by exposing SH-SY5Y to ATRA. Firstly, this study has shown observations similar to those of other studies on treating SH-SY5Y with ATRA in terms of morphological changes (i.e. increased neurite growths) and in terms of the increased expression of a differentiation neuronal marker, GAP43 [19, 23]. On comparing the toxicity of FGA drugs, chlorpromazine and trifluoperazine on differentiated versus undifferentiated SH-SY5Y cells, significant differences were observed. As seen in (Figures 2A-2D) these drugs had a more toxic effect on the undifferentiated SH-SY5Y cells compared to the differentiated cells. This finding could be an indication that FGA might be able to selectively kill neuroblastoma cells compared to the more “normal” cells which are less sensitive to these drugs. Furthermore, we have determined the potency for these drugs on a non-neuronal cell line (COS 7 cells) to be higher than for the undifferentiated SH-SY5Y cells by at least a factor of 2, which would indicate that they are selectively more toxic towards undifferentiated neuronal cells.
This study also showed that the major mechanism of cytotoxicity caused by these antipsychotic drugs is through Ca2+-mediated apoptosis and there is little evidence of cell death by necrosis, Another class of antipsychotic drug, haloperidol was also reported to induce apoptosis (although the Ca2+-mediated effect was not investigated), while another study in SH-SY5Y cells did suggest that haloperidol could also cause LDH release and therefore induce necrosis [24, 25]. Put together, these findings his would suggest that different types of antipsychotic drugs may induce cell death by different means.
It is clear that a more systematic investigation of these typical FGAs (of which there are at least 20 others available) should be undertaken, in order to ascertain if any have a much greater potency of cytotoxicity especially when comparing undifferentiated versus differentiated neuronal cells and neuronal versus non-neuronal cells. If a larger therapeutic window in potency can be found within this class of antipsychotic drugs, this could form the basis of a potential new therapy for the treatment of neuroblastomas. In support of the possible role of this family of drugs as anticancer agents, a recent study by Mu et al., (2014) found that thioridazine, also a FGA drug, had an inhibitory effect on the cell viability of gastric cancer cells [26]. Furthermore, other researchers have reported that the risk of colorectal cancer is reduced in patients using antipsychotic drugs, which again supports the potential anticancer properties of these typical, first generation antipsychotic drugs [10, 27].
In conclusion, this study has shown that some commonly prescribed typical FGA drugs are highly cytotoxic to undifferentiated human neuroblastoma SH-SY5Y cells by inducing Ca2+-mediated apoptosis. However, once the cells become differentiated with ATRA, these drugs are less cytotoxic, which may therefore warrant further investigation into the use of these drugs as a possible therapy for neuroblastomas.
Acknowledgements
The Saudi Education ministry are thanked for a PhD scholarship to IJH.
Conflicts of Interest
None.
Contribution Statement
IJH, undertook the vast majority of the experiments presented. FM, was involved in the design, analysis and writing of this work. NJH was involved in some of the design and analysis of this work.
Abbreviation
ATRA: All trans retinoic acid
FGA: (typical) First generation antipsychotic drugs
DMSO: Dimethyl sulfoxide
FBS: Foetal bovine serum
NEAA: Non-essential amino acids
Article Info
Article Type
Research ArticlePublication history
Received: Thu 23, Jan 2020Accepted: Sat 15, Feb 2020
Published: Wed 19, Feb 2020
Copyright
© 2023 Francesco Mongelli. This is an open-access article distributed under the terms of the Creative Commons Attribution License, which permits unrestricted use, distribution, and reproduction in any medium, provided the original author and source are credited. Hosting by Science Repository.DOI: 10.31487/j.COR.2020.02.03
Figures & Tables
SH-SY5Y cells were plated in a 6-well plate at a density of 100,000 cells per well. After 24 hours, cells were incubated with media containing 10µM ATRA. (A) Images were taken under the light microscope 20x on days: 0, 3, 5, and 7 (black bar denotes 50µm) (B) shows the average increase of neurite length over the time period analysed. These results were typical of three separate experiments. (C) shows the immunoblot highlighting the increase in expression of the differentiation marker GAP43, as well as the immunoblot for actin, from protein extracts of the cells treated with ATRA over 7 days. (D) shows the ratio of GAP43 relative to Actin. The data represents the mean ± SD of three experiment; ***, p ≤ 0.001 for unpaired, 2-tailed t-test.
The figures show the effects of ATRA on the cell viability of SH-SY5Y after 7 days of the treatment. Also shown is the effect of: (A) chlorpromazine (5 µM) and (B) Trifluoperazine (6µM) on untreated SH-SY5Y and differentiated SH-SY5Y cells. The results are presented as % to the control (DMSO-treated cells) of mean ± SD and repeated 3 times. (** p ≤ 0.01 and *** p ≤ 0.001, for the unpaired, two-tailed t-tests.) Also presented are the dose-dependent cell viability effects of (C) chlorpromazine and (D) trifluoperazine on both ATRA-differentiated and non-differentiated SH-SY5Y, as well as single concentration values for COS7 cells. Data are the mean ± SD of 3 repeats.
Cells were seeded in sterilised glass bottom dishes and incubated for 24 hours. After 24 hours, cells were treated with chlorpromazine and trifluoperazine and incubated for 24 hours. Before examination, cells were treated with 2 µM of caspase-3 fluorogenic substrate for 1 hour. (A) shows superimposed brightfield light and fluorescence images for cells treated with DMSO alone (control), cells treated with 5 µM chlorpromazine; and cells treated with 6 µM trifluoperazine. (B) shows the percentage of apoptotic cells when treated with chlorpromazine (5µM). (C) the percentage of apoptotic cells when treated with trifluoperazine (6µM). The data represented the mean ± SD, of 3 repeats. (statistically significant at **** p ≤ 0.0001, using unpaired, two-tailed t-tests.).
Cells were plated at 40x104 per well in a 24-well plate and incubated overnight. Cells were then incubated with 1ml DMEM (without FBS or phenol red) and pre-incubated with either 50μM caspase 3 inhibitor (Ac-DEVD-CMK) (A) or the intracellular Ca2+ chelator, BAPTA-AM (10μM) (B) for 4 hours prior to treatment with chlorpromazine (5µM) or trifluoperazine (6µM) for 24 hours, after which cell viability assays were performed. Loss of membrane integrity (a marker for necrosis) was monitored by leakage of the cytosolic enzyme LDH. (C) Shows the relative amount (% compared to triton–treated cells) of LDH activity from the surrounding media when cells were incubated with chlorpromazine (5µM) or trifluoperazine (6µM) for 24 hours. 100% LDH release was deemed to occur when cells were treated with triton X.-100 for 1 hour. All values are the means ± SD and n=6, repeated 3 times. Statistical significance, p- values were determined, using unpaired, two-tailed t-tests.
References
- Brodeur GM, Iyer R, Croucher JL, Zhuang T, Higashi M et al. (2014) Therapeutic targets for neuroblastomas. Expert Opin Ther Targets 18: 277-292. [Crossref]
- Angstman, K, Miser J, Franz W (1990) Neuroblastoma. Am Fam Physician 41: 238-244.
- Brisse H, McCarville M, Granata C, Krug K, Wootton-Gorges S et al. (2011) Guidelines for Imaging and Staging of Neuroblastic Tumors: Consensus Report from the International Neuroblastoma Risk Group Project. Radiology 261: 243-257. [Crossref]
- Xicoy H, Wieringa B, Martens GJ (2017) The SH-SY5Y cell line in Parkinson's disease research: a systematic review. Mol Neurodegener 12: 10. [Crossref]
- Ross RA, Spengler BA, Biedler JL (2014) Coordinate morphological and biochemical interconversion of human neuroblastoma cells. J Natl Cancer Inst 71: 741-747. [Crossref]
- Kovalevich J, Langford D (2013) Considerations for the Use of SH-SY5Y Neuroblastoma Cells in Neurobiology. Methods Mol Biol 1078: 9-21. [Crossref]
- Mortensen PB (1989) The incidence of cancer in schizophrenic patients. J Epidemiol Community Health 43: 43-47. [Crossref]
- Catts VS, Catts SV (2000) Apoptosis and schizophrenia: Is the tumour suppressor gene, p53, a candidate susceptibility gene? Schizophrenia Res 41: 405-415. [Crossref]
- Jablensky A, Lawrence D (2001) Schizophrenia and Cancer. Arc Gene Psychiatry 58: 579-580. [Crossref]
- Dalton SO, Mellemkjær L, Thomassen L, Mortensen P, Johansen C (2005) Risk for cancer in a cohort of patients hospitalized for schizophrenia in Denmark, 1969–1993. Schizophrenia Res 75: 315-324. [Crossref]
- Catts V, Catts S, O’Toole B, Frost A (2008) Cancer incidence in patients with schizophrenia and their first-degree relatives – a meta-analysis. Acta Psychiatrica Scandinavica 117: 323-336. [Crossref]
- Mortensen P (1987) Neuroleptic treatment and other factors modifying cancer risk in schizophrenic patients. Acta Psychiatri Scand 75: 585-590.
- Mortensen PB (1992) Neuroleptic medication and reduced risk of prostate cancer in schizophrenic patients. Acta Psychiatri Scand 85: 390-393. [Crossref]
- Melino G, Thiele CJ, Knight RA, Piacentini M (1997) Retinoids and the control of growth/death decisions in human neuroblastoma cell lines. J Neurooncol 31: 65-83. [Crossref]
- De Laurenzi V, Raschellá G, Barcaroli D, Annicchiarico-Petruzzelli M, Ranalli M et al. (2000) Induction of neuronal differentiation by p73 in a neuroblastoma cell line. J Biol Chem 275: 15226-15231. [Crossref]
- Saotome K, Morita H, Umeda M (1989) Cytotoxicity test with simplified crystal violet staining method using microtitre plates and its application to injection drugs. Toxicology in Vitro 3: 317-321. [Crossref]
- Lai P, Michelangeli F (2009) Changes in expression and activity of the secretory pathway Ca2+ ATPase 1 (SPCA1) in A7r5 vascular smooth muscle cells cultured at different glucose concentrations. Biosci Rep 29: 397-404. [Crossref]
- Al-Mousa F, Michelangeli F (2012) Some commonly used brominated flame retardants cause Ca2+-ATPase inhibition, beta-amyloid peptide release and apoptosis in SH-SY5Y neuronal cells. PLoS One 7: e33059. [Crossref]
- Gorgels TG, Oestreicher AB, de Kort EJ, Gispen WH (1987) Immunocytochemical distribution of the protein kinase C substrate B-50 (GAP43) in developing rat pyramidal tract. Neurosci Lett 83: 59-64. [Crossref]
- Grünblatt E, Bartl J, Walitza S (2018) Methylphenidate enhances neuronal differentiation and reduces proliferation concomitant to activation of Wnt signal transduction pathways. Translational Psychiatry 8: 51. [Crossref]
- Bano D, Nicotera P (2007) Ca2+ signals and neuronal death in brain ischemia. Stroke 38: 674-676. [Crossref]
- Khan SZ, Longland CL, Michelangeli F (2000) The effects of phenothiazines and other calmodulin antagonists on the sarcoplasmic and endoplasmic reticulum Ca2+ pumps. Biochem Pharmacol 15: 1797-1806. [Crossref]
- Korecka JA, van Kesteren RE, Blaas E, Spitzer SO, Kamstra JH et al. (2013) Phenotypic characterization of retinoic acid differentiated SH-SY5Y cells by transcriptional profiling. PLoS One 8: e63862. [Crossref]
- Galili R Mosberg, Gil-Ad I, Weizman A, Melamed E, Offen D (2000) Haloperidol-induced neurotoxicity--possible implications for tardive dyskinesia. J Neural Transm (Vienna) 107: 479-490. [Crossref]
- Fang J, Zuo D, Yu PH (1995) Comparison of cytotoxicity of a quaternary pyridinium metabolite of haloperidol (HP+) with neurotoxin N-methyl-4-phenylpyridinium (MPP+) towards cultured dopaminergic neuroblastoma cells. Psycho pharmacol 121: 373-378. [Crossref]
- Mu J, Xu H, Yang Y, Huang W, Xiao J et al. (2014) Thioridazine, an antipsychotic drug, elicits potent antitumor effects in gastric cancer. Oncol Rep 31: 2107-2114. [Crossref]
- Dalton SO, Johansen C, Poulsen AH, Nørgaard M, Sørensen HT et al. (2006) Cancer risk among users of neuroleptic medication: a population-based cohort study. Br J Cancer 95: 934-939. [Crossref]