Cytolytic Epstein-Barr Virus Reactivation Therapy for EBV-Associated Gastric Carcinoma
A B S T R A C T
Background: Epstein-Barr virus associated gastric carcinoma (EBVaGC) is considered a distinct GC disease entity, with the virus persisting in a latent phase. Treatment with Epirubicin, Capecitabine and Cisplatin (ECC combination) showed survival benefit in patients with GC in clinical trials (MAGIC study and CRITICS study) when compared to chemotherapy with Capecitabine and Cisplatin (GCb/Cis). Current treatment protocols for GC do not consider virus involvement.
Methods: In this study, we tested a CytoLytic Virus Activation (CLVA) strategy consisting of the ECC combination or GCb/Cis together with the HDAC inhibitor Valproic acid (VPA) to define whether EBV reactivation and subsequent antiviral treatment with Ganciclovir (GCV) could be used as virus-targeted therapy for EBVaGC. Drug combinations with VPA and GCV were evaluated in multiple cell lines and in an EBVaGC mouse model based on human naturally EBV-infected SNU-719 cells.
Results: EBV reactivation was demonstrated by lytic mRNA transcripts and proteins in treated cells, and the virus-reactivating capacity of different CLVA drug combinations was compared in C666.1, AGS-BX1 and SNU-719 cell lines. In an EBVaGC mouse model, GCb/Cis with VPA and GCV strongly reduced tumor volume and showed the highest potential for EBV-reactivation. Upon a single round of CLVA treatment, EBV DNA levels in circulation decreased, and loss of EBV-positive cells in treated tumors was observed. In vivo EBV-reactivation was revealed by the presence of lytic gene transcripts and proteins in tumor tissues 6 days after treatment.
Conclusion: In EBVaGC model systems, CLVA treatment showed a more potent virus reactivation and killing of tumor cells when compared to standard chemotherapy alone, suggesting that addition of VPA plus GCV to the ECC or GCb/Cis combination should be considered in future clinical studies.
Keywords
Epstein-Barr virus, EBV-associated gastric carcinoma, cytolytic virus activation therapy, targeted cancer therapy
Introduction
Gastric carcinoma (GC) is an epithelial malignancy with high incidence and poor prognosis [1]. About 10% of all GCs worldwide are linked to Epstein-Barr virus (EBV) infection, with viral DNA and few gene products present in every tumor cell, overall representing about 85,000 yearly new cases [2, 3-7]. EBV-associated gastric carcinoma (EBVaGC) is considered a distinct disease entity according to the new molecular classification proposed by The Cancer Genome Atlas, supporting our prior clinicopathological observations [5, 7, 8]. EBVaGC most frequently occurs in young males and is often located to the proximal stomach, arising from the cardia but also from the fundus and body of the stomach. Post-surgery gastric remnant carcinomas are more frequently positive for EBV (~35%), and nearly all gastric lymphoepithelial carcinomas carry latent EBV [9].
Current treatment options are limited and consist of chemotherapy with or without radiation followed by radical gastric dissection, but many patients have a non-resectable and recurrent disease [1, 10]. Several large clinical trials have established a treatment consensus for GC, including combinations of chemotherapeutic agents as used in the CRITICS study and the MAGIC study, namely the ECC combination consisting of Epirubicin, Capecitabine (precursor of 5-FU) plus Cisplatin or the combination of Gemcitabine/Cisplatin (GCb/Cis) [11-16].
Specific immune microenvironment with abundant inflammatory infiltrate of CD8+ and CD4+ T cells and macrophages is one of the hallmarks of EBVaGC, and currently, multiple immunotherapeutic strategies are being investigated [7, 17-19]. Recently, results of a large international retrospective study confirmed that EBV-positive GC patients have significantly better survival, which is in line with our previous findings and data by Truong et al [6, 7, 20, 21].
EBV is present in every tumor cell of EBVaGC having a restricted latency type II gene expression pattern, in which non-coding EBERs and miR-BART microRNAs, EBNA-1, BARF1, and sometimes LMP-2A, but not LMP-1 protein or any of the lytic genes are expressed [2, 22, 23]. In recent years an EBVaGC cell line was established, named SNU-719, which stably maintains the EBV genome and shows the correct restricted latent EBV gene expression profile as found in EBVaGC tumor tissues [22, 24, 25]. Our previous findings in nasopharyngeal carcinoma (NPC) showed that latent EBV in tumor cells could be targeted and reactivated into the lytic stage by a specific chemotherapy combination, the so-called Cytolytic Virus Activation Therapy (CLVA).
DNA-damage inducing agents, like chemotherapeutic drugs, can provide EBV reactivating signals, which are enhanced by the simultaneous use of chromatin remodeling agents, such as the HDAC inhibitor valproic acid (VPA) [26-29]. By using this CLVA strategy we showed that NPC tumor cells could be rapidly and effectively eliminated. Induction of EBV lytic gene expression was demonstrated in vitro and in vivo at the molecular level in an NPC mouse model, with proven re-expression of the lytic switch proteins Zebra (or Zta, BZLF1), Rta (BRLF1), the early stage kinases PK (BGLF4) and TK (BXLF1) and the VCA-p18 small capsid protein (BFRF3) [28]. Reactivation of EBV is assumed to render tumor cells susceptible to immune cell recognition by expression of immunogenic viral neo-antigens. In addition, tumor cells with reactivated EBV are sensitized for enhanced killing by antiviral therapy using (val)ganciclovir (GCV or Valcyte) that is converted by induced early viral enzymes PK and TK that convert GCV into the intracellular cytotoxic triphosphate form [30, 31]. CLVA therapy was recently administered in a phase-I/II trial to end-stage NPC patients showing encouraging clinical results [29, 32].
In this study, we investigated whether a CLVA approach, based on current standard GC chemotherapeutic protocols (MAGIC and CRITICS studies), might be advantageous as a new virus-targeted strategy for treating EBVaGC. We assumed that a small modification of current GC therapy by adding VPA and GCV to the ECC or GCb/Cis regimen might be beneficial and safe to apply. We used 5-FU, the metabolite of Capecitabine, in all experiments since Capecitabine is not convertible into its cytotoxic form in in vitro conditions. Gemcitabine, 5-FU and Cisplatin are capable of inducing EBV lytic induction in latently infected NPC cell lines, which can be greatly enhanced by the addition of the HDAC inhibitor valproic acid [29, 30, 33]. Cytotoxicity of Epirubicin was demonstrated in EBV-transformed LCLs, but not evaluated in EBV-driven carcinomas, like NPC and EBVaGC [34].
The influence on EBV reactivation of VPA addition to standard combination chemotherapy was analyzed in several in vitro models, including a unique patient-derived, naturally EBV infected GC cell line SNU-719, as previously described [24, 31, 35]. We used SNU-719 to generate an EBVaGC mouse tumor model to study the induction of EBV lytic gene products in animals treated with ECC or GCb/Cis plus VPA and GCV. The in vitro efficacy of drugs was assessed by analyses of lytic EBV transcript/protein signatures, and in the mouse model, effects on EBV-reactivation and tumor cells killing were compared for each drug combination with or without VPA and GCV. The efficacy of CLVA drug combinations was assessed by (reduction of) tumor volume and analysis of viral markers in blood and tissue.
Materials and Methods
I Cell Cultures and In Vitro Treatment
The naturally derived EBV-infected gastric carcinoma cell line SNU-719 was purchased from Korean Cell Line Bank and cultured in RPMI 1640 medium (Lonza, Maastricht, The Netherlands) with 10% fetal calf serum (FCS) and 100 μg/ml penicillin, 100 IU/ml streptomycin and 1 mM glutamine (P/S/G). AGS-BX1 (kindly provided by L. Hutt-Fletcher) and C666.1 cells (kindly provided by D. Thorley-Lawson) were cultured as described earlier[24, 29, 35-37].
The following drug doses were applied in culture medium: 3 µM GCb, 0.3 mM VPA, 90 nM Epirubicin, 6.4 µM Cisplatin and 7.5 µM 5-FU. In AGS-BX1 the ECC treatment (18 nM Epirubicin, 6.4 µM Cisplatin, 7.5 µM 5-FU) were used. Cells were treated for 2 (AGS-BX1, C666.1) or 3-5 days (SNU-719) and harvested for RNA and protein analyses.
II Protein Expression Analysis
Cultured cells were lysed in RIPA buffer (50 mM Tris/HCl pH 7.5, 150 mM NaCl, 2 mM EDTA, 1% Na-DOC, 1% Triton-X100) in the presence of a protease inhibitor cocktail (Roche, Netherlands) for 30 min at 4°C and total protein concentration was determined with a BCA protein assay kit (Pierce, Waltham, MA). SDS-PAGE, western blotting and protein-detection were done under standard conditions using anti- Zebra (BZ-1, a gift from Dr. Paul Farrell, St. Mary’s hospital, London, UK), anti-PK (mAb2616, a kind gift of J.T. Wang National Taiwan University, Taipei, Taiwan), anti-Tubulin HRP (Abcam, UK) and anti-β-Actin HRP (C4; Santa Cruz, Dallas, TX) antibodies as described earlier [29].
III Establishment of EBVaGC Mouse Model
The animal model, its handling and sampling were similar as recently described for the NPC mouse model [28]. Six-week-old female Balb/c athymic nude mice were purchased from Harlan (Zeist, The Netherlands). Animal experiments were performed in accordance with the Dutch law on animal experimentation, and the protocol was approved by the committee on animal experimentation of the VU University Medical Center. Animals were injected subcutaneously (SC) with 4 million SNU-719 cells premixed (1:1) with matrigel (BD Biosciences, Erembodegem, Belgium) in both left and right flank. Tumor volume (TV) was measured twice a week using a caliper. Blood sampling from the tail vein was performed weekly. Drugs were administered when tumor size reached 100-400 mm2. Animals were randomized before treatment administration. At the end of experiments, half of the tumor was snap frozen in liquid nitrogen for molecular analysis, and the other half was formalin-fixed, and paraffin-embedded (FFPE) for histopathology and immunohistochemistry examinations.
IV In Vivo Treatment
Supplementary Figure 1 shows the experimental protocol of the EBVaGC animal studies. After reaching the appropriate TV, mice were randomized, and 3 parallel treatment regimens were initiated on day 24 (D24): the complete CLVA therapy (GCb/VPA/GCV), ECC combination (Epirubicin, 5-FU (Capecitabine precursor) and Cisplatin) and the combination of Gemcitabine with Cisplatin (GCb/Cis). Drug doses were carefully selected based on prior in vivo studies in mice and administration schedule was designed based on in vivo human studies, mimicking one cycle of CLVA therapy in the clinical setting except for the GCb treated mice, which received after 4 days a second GCb injection as was done in our NPC mouse tumor model to prevent GCb toxicity [28]. All drugs, except VPA, were administered by IP injections (each drug separately) [28, 29, 38, 39].
The CLVA treatment consisted of 120 mg/kg GCb (Frensius Kabi Oncology Plc., Hampshire, UK) administered IP and 300 mg/kg VPA (Sigma-Aldrich, Zwijndrecht, The Netherlands) was administered daily starting from D24 in fresh drinking water, followed by daily IP treatment with 100 mg/kg Ganciclovir (GCV; Sigma-Aldrich) starting from D29. The ECC treatment consisted of 5 mg/kg Epirubicin Hydrochloride, 100 mg/kg 5-FU and 6 mg/kg Cisplatin (Accord Healthcare, UK). The GCb/Cis treatment consisted of 50 mg/kg of Gemcitabine together with 6 mg/kg Cisplatin. VPA was administered in drinking water daily starting from D24 followed by daily IP GCV treatment as described above. Animals were treated for 10 days, sacrificed, tumors from both flanks were harvested and blood and tumor tissues collected for molecular and (immuno) histological analyses. One group of animals was used for EBV-RNA profiling and immunohistochemical analysis and sacrificed earlier, on D30, after 6 days of treatment.
V EBV DNA Load in Whole Blood Before and During Treatment
Every week starting from day 6 (D6) after tumor inoculation, 50 μl whole blood (WB) was obtained from the tail vein and collected in lithium heparin-coated microvettes (Sarstedt Ag & Co. Nümbrecht, Germany). Aliquots were mixed well with 450 µl NucliSens lysis buffer (BioMérieux, France) and stored at -80oC. DNA was isolated as described earlier [40]. Viral DNA load was determined by quantitative real-time PCR using the LightCycler480 (Roche, Penzburg, Germany) as described before [28, 29]. All samples were tested in duplicate and spiked with 1000 copies of EBV plasmid to analyze potential PCR inhibition. Data were analyzed with the absolute quantification method using a 2nd Derivative Max LC480 software (Roche). The amount of human tumor cell equivalent per sample was defined by PCR for the human β-globin gene, as defined before [41].
VI EBV-RNA Profiling in Tumor Tissue
Liquid nitrogen snap-frozen tumor tissues were sliced in 5x10 mm sections, homogenized in 1 ml Trizol reagent (Life Technologies, Breda, The Netherlands) and samples were stored at -80oC prior to RNA isolation. RNA was treated with RQ RNase-free DNase (Promega,Venlo, The Netherlands) according to manufacturer’s protocol, followed by RNA precipitation using 1 μ l of 3 M sodium acetate (pH 5.3), 2.5 μ g linear acrylamide (Ambion, Bleiswijk, The Netherlands) and 25 μ l 100% ethanol (EtOH). Reverse transcription by target-specific cDNA synthesis was performed as described in detail recently [25]. cDNA was diluted 10 times or higher for use in SYBR Green based Real-Time PCR quantification of each target gene (LightCycler480, Roche). To determine the exact number of molecules per sample, serial dilutions of a plasmid pool containing all target genes were used to obtain a standard curve. Melting temperatures were analysed for the specificity of the PCR products. Quantification was performed by Absolute Quantification /2nd Derivative Max LC480 software (Roche). Additionally, the specificity of the amplicon size was checked for size by running PCR products on a 1% agarose gel. Cellular housekeeping gene (U1A) was used as RNA quality standard and for normalizing transcript levels [25, 28].
Correction for remaining viral DNA in the DNase-I treated RNA extracts was done for all non-spliced targets (Rta, PK, TK, VCA-p18) to exclude genomic EBV DNA contamination, as described in detail before. For this, we used EBNA1-based qPCR targeting a 99bp EBV genomic region not included in the cDNA sequences as described above [25].
VII Immunohistochemistry and EBER-RISH
Tumor FFPE sections were deparaffinized, hydrated, and endogenous peroxidase activity was blocked with 0.3% hydrogen peroxidase solution for 30 min. For antigen retrieval, tissues were pre-treated with 10 mM citrate buffer (0.05% Tween 20, pH 6.0) for 10 min at 98°C. Sections were incubated with the anti-BZLF1, Zebra (BZ-1, 1: 100) for 1 h at RT in a humidified chamber or over-night at 4°C. The Envision HRP anti-rabbit/anti-mouse detection system (Dakopatts, Glostrup, Denmark) was used according to the manufacturer’s instruction. Colours were developed with the diaminobenzidine tetrachloride (DAB) substrate kit (Vector Laboratories, Burlingame, CA, U.S.A.) followed by Hematoxylin-Eosin (HE) staining. EBER-RISH was performed on 3 μm FFPE tumor tissue sections using a EBER peptide nucleic acid (PNA) probe (DAKO) as described [42].
Results
Initial screening of different drug combinations for their capacity to drive EBV-lytic reactivation was done in NPC-derived C666.1 cells carrying EBV with a stable latency-II profile and compared to the well-studied GCb/VPA-based CLVA treatment in this cell line [28, 29]. The strongest virus reactivation in this cell line was observed upon ECC/VPA treatment (Figure 1). Subsequently, the ECC combination treatment was applied to artificial EBVaGC cell line AGS-BX1 and the natural EBVaGC line SNU-719, which was further explored in vivo as a mouse tumor model.
Figure 1: EBV lytic induction in 2 days treated C666.1 cells.
A) & B) Strong EBV reactivation by ECC regimen in C666.1 cells as indicated by high levels of lytic proteins, and C) transcripts.
I Lytic Induction In Vitro
EBV reactivation in C666.1 cells treated with GCb or ECC with or without VPA for 2 days was analyzed to determine and compare the levels of viral lytic mRNA and protein expression (Figure 1). Lytic induction was confirmed for both GCb and ECC by appearance, and increased levels of the immediate early (IE)-Zebra and late lytic protein VCA-p18 by (quantitative) immunoblot analysis, with most enhanced IE-Zebra and VCA-p18 levels in the ECC/VPA treated cells (Figures 1A & 1B). EBV mRNA profiling by multiplex RT-PCR in parallel samples revealed stronger upregulation of Zebra transcripts by ECC/VPA treatment when compared to the standard GCb/VPA (Figure 1C).
EBV reactivation in the EBVaGC model cell line AGS-BX1 cells treated for 2 days with either GCb, Cis or ECC combination with or without VPA is presented in (Figure 2). This cell model already has spontaneous baseline EBV lytic gene expression, explaining the initial positive signals for Zebra (Figures 2A, 2D & 2G) [35]. Additionally, increased strong Zebra protein expression was detected after GCb/VPA (Figures 2A-2B, 2D-2E, 2G-2H), Cis/VPA (Figures 2D & 2E) and ECC (Figures 2G & 2H) treatment. Correspondingly, the level of Zebra transcripts increased strongly upon GCb/VPA (Figure 2C), Cis/VPA (Figure 2F) and ECC/VPA (Figure 2I) treatments. Furthermore, robust Zebra and PK protein expression was detected by immunoblot analysis in GCb/Cis/VPA and GCb/VPA treated AGS-BX1, whereas the VPA addition to the ECC combination resulted in low to moderate Zebra and PK expression (Figure 3).
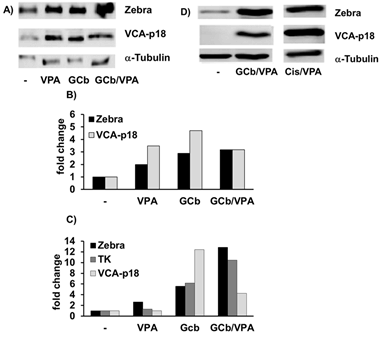
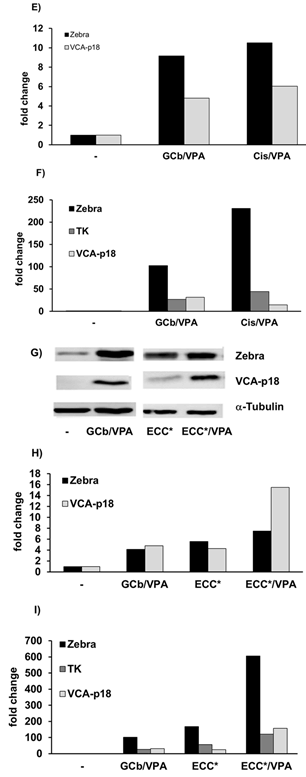
Figure 2: EBV lytic induction in 2 days treated AGS-BX1 cells. Western blot analysis shows virus reactivation in AGS-BX1 cells by different treatment combinations. A), B), D), E), G) & H) Zebra and VCA-p18 protein levels, and C), F) & I) lytic transcripts of EBV detected in corresponding samples. ECC* indicates 18 nM Epirubicin was used.
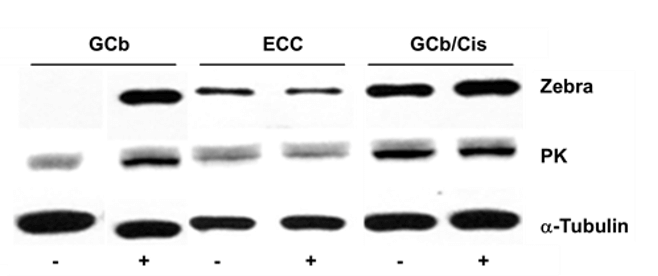
Figure 3: Zebra and PK protein expression in 2 days treated AGS-BX1 cells.
Western blot analysis shows virus reactivation in AGS-BX1 cells by different treatment combinations. The presence of VPA is indicated as +/-.
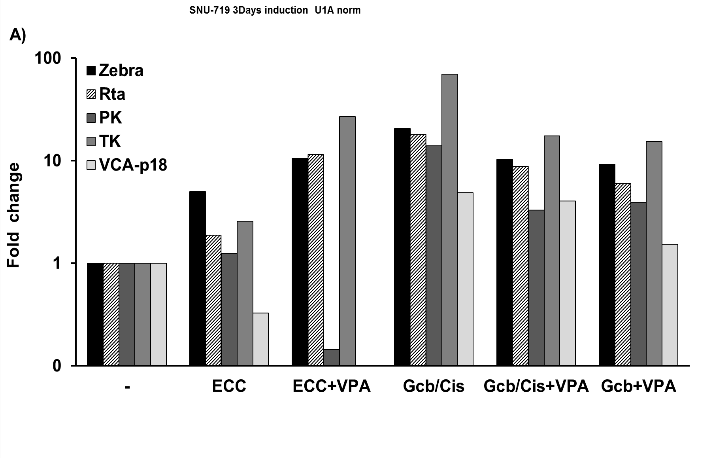
Figure 4: Induction of lytic EBV mRNA in treated SNU-719 cells.
EBV RNA profiling revealed strong upregulation of lytic transcripts after 3 days of treatment. Transcripts were calculated as target molecules/cell and normalized to human cellular housekeeping U1A. The fold change was determined by normalization to the level in the untreated cells.
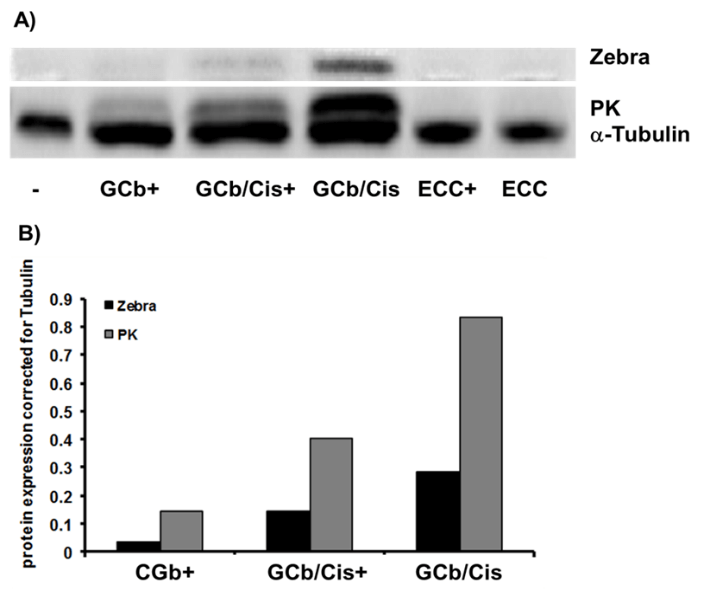
Figure 5: Zebra and PK protein expression in 5 days treated SNU-719.
A) Western blot analysis, and B) quantification, shows virus reactivation in naturally infected SNU-719 cells by GCb/Cis treatment, but not by ECC treatment. The presence of VPA is indicated as +/-.
EBV reactivation in the natural EBVaGC-derived SNU-719 cells treated for 3-5 days is presented in (Figures 4 & 5). In 3-days treated SNU719 cells, mRNA transcripts of Zebra, Rta, PK, TK, and VCA-p18 appeared to be present in high copy numbers indicating viral lytic induction due to GCb/Cis and GCb/Cis/VPA treatment, whereas ECC-based treatment induced a lower number of EBV lytic transcripts (Figure 4). In the untreated cells, only negative or very low baseline levels were detectable, which were normalized to 1. By immunoblot analysis, PK protein was found to be strongly expressed at 5-days in GCb/Cis and GCb/Cis/VPA, but not in ECC treated cells, in parallel with the Zebra protein (Figures 5A & 5B). Late lytic mRNA was hardly detected, although VCA-p18 protein was elevated in GCb/Cis induced cells with or without VPA. In ECC-treated SNU-179 cells, VCA-p18 protein and mRNA were hardly detected. We found that EBV lytic proteins are not easy to induce in the natural SNU-719 cells, especially when compared to the very reactive recombinant AGS-BX1 cells, which show lytic expression already in unstimulated condition. This is in agreement with recently published data [35]. Latent-phase specific EBV RNA transcripts (only BARTS and LMP1) were quantified as well, and the expression pattern corresponded to the GC-specific EBV latency type-II without LMP1 expression, as defined before (data not shown) [25].
II CLVA Treatment Reduces SNU-719 Tumor Volume
The EBV positive GC mouse model was used to investigate the biological effects in vivo of CLVA-based treatments for EBV lytic induction and to show additive cytotoxicity of the antiviral compound GCV. Supplementary Figure 1 shows a schematic presentation of the animal treatment protocol. Drug combinations were well tolerated, and no significant loss of body weight was observed. From D6 after SNU-719 cells inoculation, tumor volumes (TV) increased rapidly (Figures 6A & 6B).
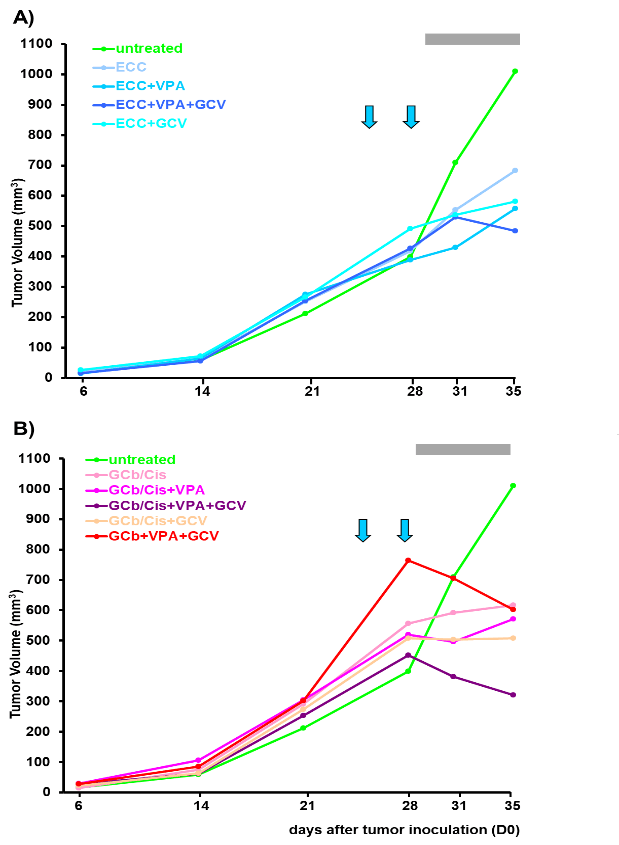
Figure 6: Tumor volume.
Tumor volumes of both left and right flanks together are represented as average (mean value) per group (n=5 or 7). Arrows indicate administration of GCb, i.e. 24 and 28 days after tumor inoculation; grey bar represents GCV administration and the 1st arrow corresponds to single administration of all other chemotherapeutic agents, A) the ECC or B) GCb/Cis combinations.
Treatments were started in randomly selected animals on D24 after tumor inoculation. In mice treated with GCb/VPA/GCV a rapid decrease occurred upon 2nd dose of GCb (Figures 6A & 6B). ECC treatment resulted in TV decrease only when combined with VPA and GCV (Figure 6A). Also, a robust decrease in TV was observed as a result of GCb/Cis treatment only when combined with VPA and GCV (Figure 6B). These in vivo results match with the in vitro results (Figure 4), indicating that EBVaGC SNU-179 cells are poorly responsive to the ECC protocol. ECC induces only partial EBV reactivation with Zebra and Rta expression, but no further expression of early and late EBV genes. On the other hand, SNU-179 cells are well responsive to the GCb/Cis protocol, with good enhancement by the addition of VPA and apparent induction of virus-encoded PK and TK enzymes providing the additional cytolytic treatment effect by the addition of GCV.
III EBV DNA Load in Mouse Whole Blood
Viral DNA levels in whole blood (WB) gradually increased with the rise of tumor volume until the start of treatment (D24) and were monitored in parallel to the treatment response (Figure 7). A rapid increase of EBV DNA load in all groups with ECC-based treatment was measured and only in the ECC/VPA treated group a small reduction was seen from D31 (Figure 7A). On the other hand, combined GCb/Cis treatment with VPA and GCV (or with VPA alone) strongly reduced the EBV DNA load, starting from day 31 (D31).Treatment with two other combinations (GCb/Cis alone or with GCV) resulted in a lower decrease of the viral load (Figure 7B). Thus, circulating EBV-DNA load in the blood reflects the macroscopic tumor behaviour, as measured by tumor volume (Figure 6).
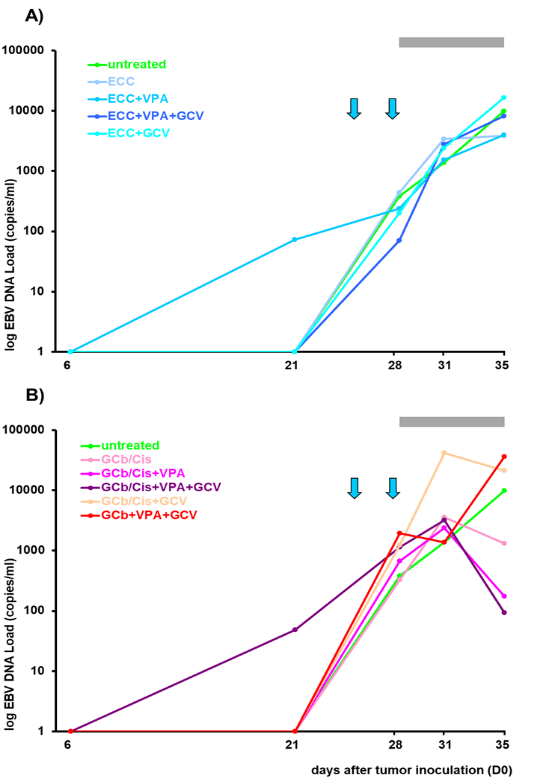
Figure 7: EBV DNA load in circulation.
EBV DNA load in circulation is represented as average (mean value) per group (n=5 or 7). Arrows indicate administration of GCb, i.e. 24 and 28 days after tumor inoculation; grey bar represents GCV administration and the 1st arrow corresponds to single administration of other chemotherapeutic agents, A) the ECC or B) GCb/Cis combinations.
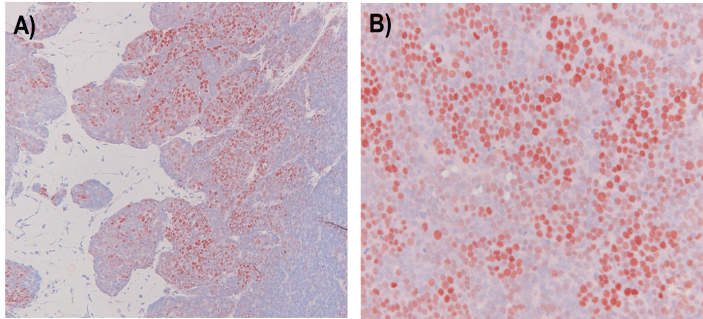
IV CLVA Treatment Results in Strong Reduction of EBER-Positive Tumor Cells
Tumor tissues collected after the various treatments were examined for the presence of EBV-positive cells using the EBER-RNA in situ hybridization assay (EBER-RISH, Figure 8). In the untreated group of animals, large lobular fields of tightly packed vital tumor cells (about70%) were surrounded by tumor stroma, as indicated by strong EBER-positive staining (Figure 8A). In tumors from animals treated with ECC/VPA, approximately 60% of cells were EBER-positive (Figure 8B), and 50 % in ECC/VPA/GCV treated (Figure 8C). In GCb/VPA/GCV treated animals, smaller fields of tumor cells were present, and the number of EBER-positive tumor cells was reduced to 20-25% (Figure 8D). The GCb/Cis/VPA treatment resulted in an even more pronounced decrease of tumor cells, and about 10% of EBER-positive cells were detected (Figure 8E). The most significant tissue architectural changes were observed in GCb/Cis/VPA/GCV treated group, where only 5-10% of EBER-positive cells still remained (Figure 8F).
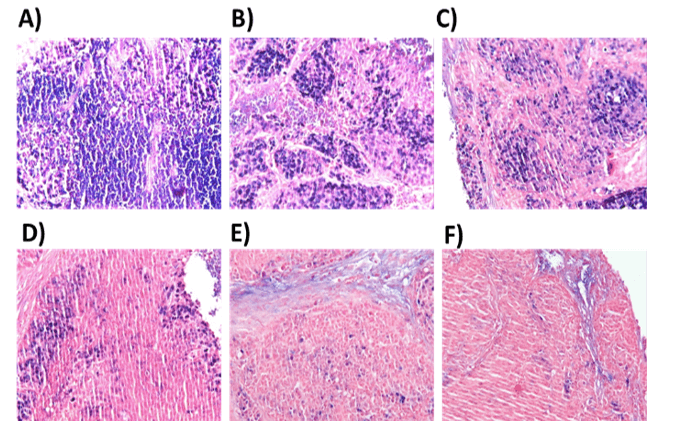
Figure 8: EBER-RISH in mouse tumors.
A) EBER in situ hybridization was performed on tumors taken from control tumor bearing mice, or B) from mice treated for 6 days with ECC/VPA, C) ECC/VPA/GCV, D) GCb/VPA/GCV, E) GCb/Cis/VPA or F) GCb/Cis/VPA/GCV. In untreated tumors large fields of EBER-positive (blue) tumor cells were detected (A), typically seen as compact lobular areas (detailed in Supplementary Figure 2). In particular the GCb and Cis-based treatments resulted in strong reduction the number of tumor cells (D-F), but also in appearance of necrotic tissue with fluid leakage, affecting the quality of tissue sections.
V EBV Lytic Transcripts in Tumors After 6 Days of Treatment
EBV-RNA profiling by multiplex RT-PCR was performed in RNA extracts of frozen tumors from 6-days treated animals and from untreated mice at 30 days after tumor inoculation (Figure 9). In the untreated control group, only negative or very low base-levels of lytic transcripts were detectable. In treated mice, mRNA transcripts of Zebra, Rta, PK, TK and VCA-p18 appeared to be present in high numbers indicating induction of viral lytic gene expression in response to the treatment. Latent-phase specific EBV-RNA transcripts were detected in all tumor tissues, and the expression pattern corresponded to the GC-specific restricted EBV latency type II, with BARF1 but without LMP1 mRNA expression (data not shown).
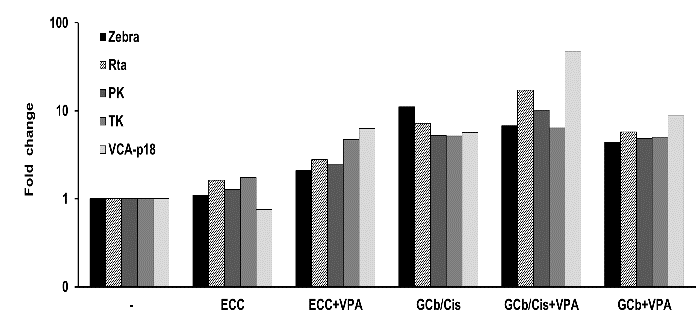
Figure 9: Lytic EBV-RNA detected in mouse tumors.
Lytic transcripts of EBV detected in tumors of 6 days treated mice (n=2, both left and right flank tumors analysed); the immediate early Zebra, Rta, early PK, TK, and late VCA-p18 transcripts were calculated as target molecules/cell and normalized to human cellular housekeeping U1A. Fold change was determined by normalization of the average level of each specific mRNA per treated group to the level of that mRNA in the untreated group.
VI EBV Lytic Induction in Tumor Cells In Vivo Revealed by Zebra Staining
To visualize virus reactivation in tumor cells, tissues were analyzed by IHC, for IE lytic switch protein Zebra using the BZ-1 antibody (Figure 10). In the tightly packed fields of tumor cells of untreated mice, only scattered single cells were spotted occasionally (Figure 10A). Only sporadic clusters of Zebra-positive cells were detected in ECC+VPA and CGb/Cis+VPA treated animals.
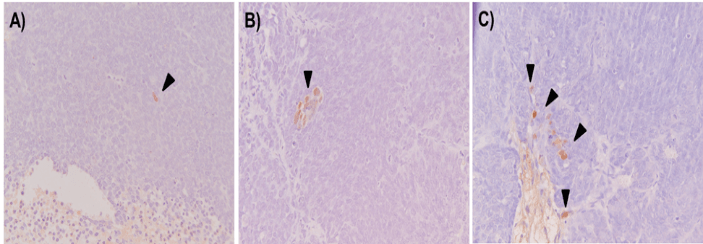
Figure 10: Detection of Zebra-positive cells in tumor tissues.
A) IHC staining for IE lytic protein Zebra was performed on tumors from control, B) ECC/VPA and C) GCb/Cis/VPA treated mice for 6 days. In untreated tissues Zebra-positive tumor cells were occasionally detected (A). Treatment with ECC and GCb/Cis in combination with VPA resulted in slight increase in number of Zebra-positive tumor cells (B, C) as illustrated by arrowheads. 20x magnification.
Discussion
The concept of CLVA treatment, previously developed for the treatment of NPC, and validated in a clinical Phase-I/II study with promising results was tailored after GC-specific chemotherapy regimen in the CRITICS-study and here applied as a therapy targeting Epstein-Barr virus in EBVaGC, as visualized in the (Supplementary Figure 1) [11, 28, 29, 32].
Treatment efficacy and virus reactivation was analyzed in multiple NPC and GC cell lines and for the first time in a mouse model bearing tumors from human SNU-719, a naturally EBV-infected GC cell line. After being established and characterized, this unique cell line was used to form GC tumors in nude mice and used in vitro to assess the EBV lytic induction effects of Taxol, 5-FU and Cisplatin, but otherwise not utilized much [24, 31, 36, 37]. When compared to the study of Oh et al., we have observed faster tumor growth (200-300mm3 after 21 day from tumor inoculation) and a specific multilobular structure (Figure 2), which was occasionally seen macroscopically when measuring the size of (subcutaneous) tumors. With this mouse model, we were able to investigate EBV lytic induction in tumor tissue and compare the effectiveness of various drug combinations.
Using EBV-specific RNA-profiling and protein analyses, we first compared GCb and ECC treatments in NPC-derived C666.1epithelial tumor cells naturally harboring EBV [25, 28]. In this cell line, we clearly demonstrated an additive effect of VPA in EBV-reactivation (Figure 1). In AGS-BX1 cells, a GC cell model carrying an artificial EBV genome and known to be rather leaky for lytic gene expression, VPA-only treatment already triggered a strong lytic gene expression (Figure 2) [35].When GCb, ECC and GCb/Cis treatments in AGS-BX1 cells were compared together, the additive effect of VPA could not be seen except for GCb (Figure 3, no quantitative analyses was performed). This might be explained by the very high level of lytic induction achieved by these drug combinations without VPA.
Further analyses in SNU-719 cells, the natural EBVaGC cell line, revealed that spontaneous endogenous virus transcriptome/proteome agrees with the predicted expression profile [43]. BARF1 mRNA was detected but no LMP1 (or transcripts present at low levels) [25]. We clearly demonstrated the increase of EBV lytic genes expression upon ECC or GCb/Cis treatment, but the addition of VPA to our surprise did not result in stronger EBV reactivation (Figures 4 & 5). ECC treatment of SNU-719 cells clearly induced Zebra and some Rta expression, but barely affected early (TK, PK) or late gene (VCA-p18) expression, thus having limited efficacy for CLVA. In contrast, the GCb/Cis/VPA and GCb/VPA combinations strongly induced full EBV lytic gene expression, suggesting these combinations would classify as best candidates for CLVA treatment of EBVaGC in vivo.
In animals, SNU-719 tumor growth was limited by standard CLVA treatment consisting of GCb/VPA/GCV (NPC protocol), but the combination of ECC/VPA/GCV failed to give a pronounced effect, as already was observed in the in vitro studies with SNU-179. The GCb/Cis/VPA/GCV treatment resulted in a more pronounced reduction of tumor growth after 10 days of treatment. In groups where no GCV was added, a slight regrowth of a tumor was observed in contrast to complete ECC/VPA/GCV, GCb/Cis/VPA/GCV or CLVA treatments, indicating an additional cytolytic effect of the antiviral GCV (Figure 6).
GCV alone is not effective for treating EBV-positive tumors since tumor cells do not spontaneously express PK and TK, the viral kinases, which are essential for the conversion of GCV into its cytotoxic tri-phosphate form [30]. As expected, parallel to rapid tumor growth, the rise of viral DNA load in whole blood (WB) of tumor-bearing animals was demonstrated (Figure 7). A decrease of WB EBV DNA load paralleled treatment-induced reduction of tumor size in GCb/Cis-based treatments, where complete GCb/Cis/VPA/GCV resulted in the strongest decrease in EBV DNA load. Surprisingly, in ECC-based treatment, an increase of WB EBV DNA load was observed, except for the ECC/GCV treatment (Figure 7A), which is in agreement with the low lytic gene induction of this regimen in this EBVaGC SNU-719 model (Figure 4).
The presence of EBV-positive tumor cells in tissue was visualized by EBER-RISH staining (Figure 8). Tumor cells in untreated mice were densely packed in characteristic lobular structures (Supplementary Figure 2), and a large amount still remained after ECC-based treatments, while a massive reduction of EBV-EBER positive tumor cells was seen as a result of GCb and Cis based treatments. The analyses of GCb/Cis/VPA/GCV treated tumors, where a small number of remaining EBER positive tumor cells were detected, clearly indicated the superior efficacy of tumor cell killing, which is in line with the reduction of tumor volume (Figures 8F & 6B).
As a result of CLVA treatment, these multilobular tumors often appeared necrotic and leaky (filled with liquid). The immediate-early protein Zebra was occasionally detected in single tumor cells in untreated tissues. The analyses of 6 days treated mice revealed induced reactivation of virus as a result of GCb/Cis/VPA treatment, whereas with ECC/VPA treatment, less Zebra-positive cells were observed, in line with the in vitro results (Figures 4 & 10). Although the number of Zebra-positive cells in tumor tissues of treated mice detected by immunohistochemistry was lower than expected, comparisons of Zebra mRNA profile in tumors of 6 days treated mice (Figure 9) with 3 days treated SNU-719 cells (Figure 4), clearly showed GCb/Cis based treatment was superior to ECC based combination for triggering EBV reactivation.
In this study, we compared the effects of drug combinations in different cell lines and for the first time in a mouse model and demonstrated virus reactivation as a prospective strategy for the treatment of EBVaGC [31, 35]. Importantly, different EBV-positive cell lines show significant differences in the efficiency of lytic induction treatment, including the effect of VPA, requiring further investigation. As the current treatment of GC does not consider EBV presence, a boost in the research for virus-targeted therapy relevant to EBVaGC is needed to explore the optimal effect of different HDAC inhibitors and antiviral drugs as adjuvant therapy to the current treatment protocols [18, 27].
Conclusion
Overall, the data presented here provide direct evidence for options to modify current GC treatment protocols in order to induce EBV lytic gene expression (reactivation) via virus-targeted chemotherapy in EBVaGC models. The treatment with GCb/Cis/VPA/GCV proved most efficient to induce lytic gene expression in EBVaGC cells in vitro and EBVaGC tumor tissue in vivo, in reducing tumor volume after a single drug dosage. The treatment effect was reflected in circulating EBV-DNA load. GCb/Cis/VPA/GCV-based CLVA treatment was most effective in clearing EBER-positive cells in situ as compared to the controls. Incorporation of VPA and GCV into the GCb/Cis regimen, currently considered standard for GC treatment, might have therapeutic benefits in the treatment of EBVaGC in man.
Acknowledgements
We greatly acknowledge H. van der Laan for technical assistance with in vivo studies, N. Paauw and E. Hui for in vitro cell line studies, T. Vendrig for IHC analyses and N. van Grieken and E. Bloemena for pathological advice. This study was financially supported by ZonMW translational research project (95110069) and Dutch Cancer Society grants (KWF VU-2010-4809 and VU2012-4555).
Conflicts of Interest
None.
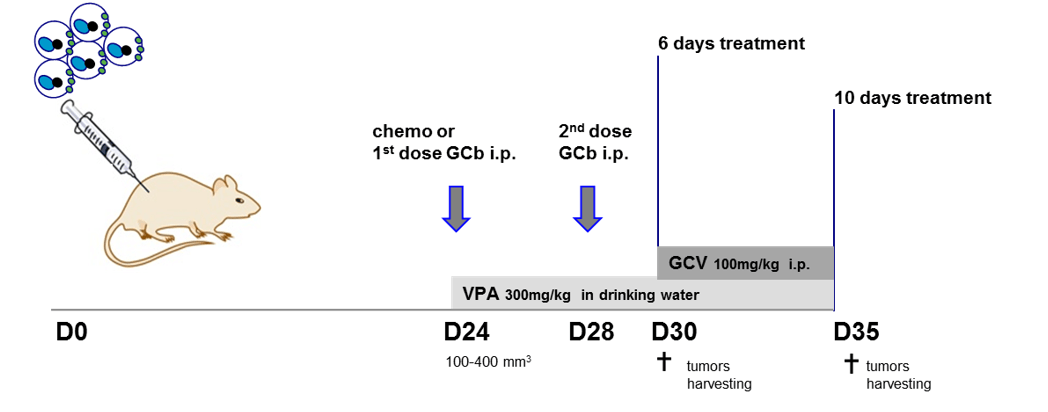
Supplementary Figure 1: Experimental design of animal studies.
Time schedule of drug(s) administration: ECC combination (Epirubicin, 5-FU and Cisplatin) or combination of Gemcitabine with Cisplatin (GCb/Cis) or GCb-alone treatment was started on D24 after tumor inoculation (D0) and 4 days later (D28) animals received 2nd dose of treatment of GCb as before (28). Valproic acid (VPA) was given to drug-treated animals from D24. Ganciclovir (GCV) was administered daily starting on D29 from tumor inoculation in ECC-treated, ECC/VPA-treated, GCb/Cis- treated, GCb/Cis/VPA-treated and GCb/VPA-treated animals. Each group selected for specific treatment regimen consisted of 5 animals.
Supplementary Figure 2: Multilobular mouse tumors with EBER-RISH positive tumor cells.
EBER in situ hybridization revealed large fields of EBER-positive SNU-719 tumor cells distributed in lobules, which is characteristic of these SNU-719 derived tumors. A) 20x mag, B) 40x mag. A DAB-based EBER-RISH staining procedure was used giving a red-brown colour in EBER-positive nuclei (compared the blue staining in Figure 8).
Article Info
Article Type
Research ArticlePublication history
Received: Fri 19, Jun 2020Accepted: Fri 03, Jul 2020
Published: Fri 10, Jul 2020
Copyright
© 2023 Jaap M. Middeldorp. This is an open-access article distributed under the terms of the Creative Commons Attribution License, which permits unrestricted use, distribution, and reproduction in any medium, provided the original author and source are credited. Hosting by Science Repository.DOI: 10.31487/j.COR.2020.07.08
Figures & Tables
A) & B) Strong EBV reactivation by ECC regimen in C666.1 cells as indicated by high levels of lytic proteins, and C) transcripts.
Western blot analysis shows virus reactivation in AGS-BX1 cells by different treatment combinations. The presence of VPA is indicated as +/-.
EBV RNA profiling revealed strong upregulation of lytic transcripts after 3 days of treatment. Transcripts were calculated as target molecules/cell and normalized to human cellular housekeeping U1A. The fold change was determined by normalization to the level in the untreated cells.
A) Western blot analysis, and B) quantification, shows virus reactivation in naturally infected SNU-719 cells by GCb/Cis treatment, but not by ECC treatment. The presence of VPA is indicated as +/-.
Tumor volumes of both left and right flanks together are represented as average (mean value) per group (n=5 or 7). Arrows indicate administration of GCb, i.e. 24 and 28 days after tumor inoculation; grey bar represents GCV administration and the 1st arrow corresponds to single administration of all other chemotherapeutic agents, A) the ECC or B) GCb/Cis combinations.
EBV DNA load in circulation is represented as average (mean value) per group (n=5 or 7). Arrows indicate administration of GCb, i.e. 24 and 28 days after tumor inoculation; grey bar represents GCV administration and the 1st arrow corresponds to single administration of other chemotherapeutic agents, A) the ECC or B) GCb/Cis combinations.
A) EBER in situ hybridization was performed on tumors taken from control tumor bearing mice, or B) from mice treated for 6 days with ECC/VPA, C) ECC/VPA/GCV, D) GCb/VPA/GCV, E) GCb/Cis/VPA or F) GCb/Cis/VPA/GCV. In untreated tumors large fields of EBER-positive (blue) tumor cells were detected (A), typically seen as compact lobular areas (detailed in Supplementary Figure 2). In particular the GCb and Cis-based treatments resulted in strong reduction the number of tumor cells (D-F), but also in appearance of necrotic tissue with fluid leakage, affecting the quality of tissue sections.
Lytic transcripts of EBV detected in tumors of 6 days treated mice (n=2, both left and right flank tumors analysed); the immediate early Zebra, Rta, early PK, TK, and late VCA-p18 transcripts were calculated as target molecules/cell and normalized to human cellular housekeeping U1A. Fold change was determined by normalization of the average level of each specific mRNA per treated group to the level of that mRNA in the untreated group.
A) IHC staining for IE lytic protein Zebra was performed on tumors from control, B) ECC/VPA and C) GCb/Cis/VPA treated mice for 6 days. In untreated tissues Zebra-positive tumor cells were occasionally detected (A). Treatment with ECC and GCb/Cis in combination with VPA resulted in slight increase in number of Zebra-positive tumor cells (B, C) as illustrated by arrowheads. 20x magnification.
Time schedule of drug(s) administration: ECC combination (Epirubicin, 5-FU and Cisplatin) or combination of Gemcitabine with Cisplatin (GCb/Cis) or GCb-alone treatment was started on D24 after tumor inoculation (D0) and 4 days later (D28) animals received 2nd dose of treatment of GCb as before (28). Valproic acid (VPA) was given to drug-treated animals from D24. Ganciclovir (GCV) was administered daily starting on D29 from tumor inoculation in ECC-treated, ECC/VPA-treated, GCb/Cis- treated, GCb/Cis/VPA-treated and GCb/VPA-treated animals. Each group selected for specific treatment regimen consisted of 5 animals.
EBER in situ hybridization revealed large fields of EBER-positive SNU-719 tumor cells distributed in lobules, which is characteristic of these SNU-719 derived tumors. A) 20x mag, B) 40x mag. A DAB-based EBER-RISH staining procedure was used giving a red-brown colour in EBER-positive nuclei (compared the blue staining in Figure 8).
References
- Eric Van Cutsem, Xavier Sagaert, Baki Topal, Karin Haustermans, Hans Prenen (2016) Gastric cancer. The Lancet 388: 2654-2664. [Crossref]
- A zur Hausen, A A Brink, M E Craanen, J M Middeldorp, C J Meijer et al. (2000) Unique transcription pattern of Epstein-Barr virus (EBV) in EBV-carrying gastric adenocarcinomas: expression of the transforming BARF1 gene. Cancer Res 60: 2745-2748. [Crossref]
- Xin-Zu Chen, Hongda Chen, Felipe A Castro, Jian Kun Hu, Hermann Brenner (2015) Epstein-Barr virus infection and gastric cancer: a systematic review. Medicine (Baltimore) 94: e792. [Crossref]
- Gulfaraz Khan, Muhammad Jawad Hashim (2014) Global burden of deaths from Epstein-Barr virus attributable malignancies 1990-2010. Infect Agent Cancer 9: 38. [Crossref]
- Ju Han Lee, Seo Hee Kim, Sun Hee Han, Jung-Suk An, Eung Seok Lee et al. (2009) Clinicopathological and molecular characteristics of Epstein-Barr virus-associated gastric carcinoma: a meta-analysis. J Gastroenterol Hepatol 24: 354-365. [Crossref]
- Josine van Beek, Axel zur Hausen, Elma Klein Kranenbarg, Cornelis J H van de Velde, Jaap M Middeldorp et al. (2004) EBV-positive gastric adenocarcinomas: a distinct clinicopathologic entity with a low frequency of lymph node involvement. J Clin Oncol 22: 664-670. [Crossref]
- Josine van Beek, Axel zur Hausen, Sander N Snel, Johannes Berkhof, Elma Klein Kranenbarg et al. (2006) Morphological evidence of an activated cytotoxic T-cell infiltrate in EBV-positive gastric carcinoma preventing lymph node metastases. Am J surg pathol 30: 59-65. [Crossref]
- Cancer Genome Atlas Research Network (2014) Comprehensive molecular characterization of gastric adenocarcinoma. Nature 513: 202-209. [Crossref]
- Gwen Murphy, Ruth Pfeiffer, M Constanza Camargo, Charles S Rabkin (2009) Meta-analysis shows that prevalence of Epstein-Barr virus-positive gastric cancer differs based on sex and anatomic location. Gastroenterology 137: 824-833. [Crossref]
- Francesco Fiorica, Marco Trovò, Alessandro Ottaiano, Guglielmo Nasti, Ilaria Carandina et al. (2017) Can the addition of radiotherapy postoperatively increase clinical outcome of patients with gastric cancer? A systematic review of the literature and meta-analysis. Oncotarget 9: 10734-10744. [Crossref]
- Annemieke Cats, Edwin P M Jansen, Nicole C T van Grieken, Karolina Sikorska, Pehr Lind et al. (2018) Chemotherapy versus chemoradiotherapy after surgery and preoperative chemotherapy for resectable gastric cancer (CRITICS): an international, open-label, randomised phase 3 trial. Lancet Oncol 19: 616-628. [Crossref]
- Johan L Dikken, Johanna W van Sandick, H A Maurits Swellengrebel, Pehr A Lind, Hein Putter et al. (2011) Neo-adjuvant chemotherapy followed by surgery and chemotherapy or by surgery and chemoradiotherapy for patients with resectable gastric cancer (CRITICS). BMC Cancer 11: 329. [Crossref]
- Cats A, Jansen EPM, van Grieken NCT, Sikorska K, Lind P et al. (2018) Chemotherapy Versus Chemoradiotherapy After Surgery and Preoperative Chemotherapy for Resectable Gastric Cancer (CRITICS): An International, Open-Label, Randomised Phase 3 Trial. Lancet Oncol 19: 616-628. [Crossref]
- David Cunningham, William H Allum, Sally P Stenning, Jeremy N Thompson, Cornelis J H Van de Velde et al. (2006) Perioperative chemotherapy versus surgery alone for resectable gastroesophageal cancer. N Engl J Med 355: 11-20. [Crossref]
- J Cassidy, L Saltz, C Twelves, E Van Cutsem, P Hoff et al. (2011) Efficacy of capecitabine versus 5-fluorouracil in colorectal and gastric cancers: a meta-analysis of individual data from 6171 patients. Ann Oncol 22: 2604-2609. [Crossref]
- S M De Lange, C J van Groeningen, J R Kroep, A Van Bochove, J F Snijders et al. (2004) Phase II trial of cisplatin and gemcitabine in patients with advanced gastric cancer. Ann Oncol 15: 484-488. [Crossref]
- Hong Jun Kim, Sang Cheul Oh (2018) Novel Systemic Therapies for Advanced Gastric Cancer. J Gastric Cancer 18: 1-19. [Crossref]
- Madiha Naseem, Afsaneh Barzi, Christine Brezden Masley, Alberto Puccini, Martin D Berger et al. (2018) Outlooks on Epstein-Barr virus associated gastric cancer. Cancer Treat Rev 66: 15-22. [Crossref]
- Weili Wang, Kuansong Wang, Zihua Chen, Ling Chen, Wei Guo et al. (2018) Immunoclassification characterized by CD8 and PD-L1 expression is associated with the clinical outcome of gastric cancer patients. Oncotarget 9: 12164-12173. [Crossref]
- M Constanza Camargo, Woo Ho Kim, Anna Maria Chiaravalli, Kyoung Mee Kim, Alejandro H Corvalan (2014) Improved survival of gastric cancer with tumour Epstein-Barr virus positivity: an international pooled analysis. Gut 63: 236-243. [Crossref]
- Camtu D Truong, Wei Feng, Wei Li, T Khoury, Q Li et al. (2009) Characteristics of Epstein-Barr virus-associated gastric cancer: a study of 235 cases at a comprehensive cancer center in U.S.A. J Exp Clin Cancer Res 28: 14. [Crossref]
- Dong Kang, Rebecca L Skalsky, Bryan R Cullen (2015) EBV BART MicroRNAs Target Multiple Pro-apoptotic Cellular Genes to Promote Epithelial Cell Survival. PLoS Pathog 11: e1004979. [Crossref]
- Aya Shinozaki Ushiku, Akiko Kunita, Masashi Fukayama (2015) Update on Epstein-Barr virus and gastric cancer (review). Int J Oncol 46: 1421-1434. [Crossref]
- Sang Taek Oh, Jung Seon Seo, Uk Yeol Moon, Kyeong Hee Kang, Dong Jik Shin et al. (2004) A naturally derived gastric cancer cell line shows latency I Epstein-Barr virus infection closely resembling EBV-associated gastric cancer. Virology 320: 330-336. [Crossref]
- A E Greijer, O Ramayanti, S A W M Verkuijlen, Z Novalić, H Juwana et al. (2017) Quantitative multi-target RNA profiling in Epstein-Barr virus infected tumor cells. J Virol Methods 241: 24-33. [Crossref]
- Stacy R Hagemeier, Elizabeth A Barlow, Qiao Meng, Shannon C Kenney (2012) The cellular ataxia telangiectasia-mutated kinase promotes epstein-barr virus lytic reactivation in response to multiple different types of lytic reactivation-inducing stimuli. J Virol 86: 13360-13370. [Crossref]
- Novalic Z, van Rossen T, Middeldorp J (2016) Agents and Approaches for Lytic Induction Therapy of Epstein-Barr Virus Associated Malignancies. Med Chem 6: 449-466.
- Novalic Z, Verkuijlen S, Verlaan M, Eersels JLH, de Greeuw I, Molthoff CFM, Middeldorp JM, Greijer AE. (2017) Cytolytic virus activation therapy and treatment monitoring for Epstein-Barr virus associated nasopharyngeal carcinoma in a mouse tumor model. J Med Virol 89: 2207-2216. [Crossref]
- Maarten A Wildeman, Zlata Novalic, Sandra A W M Verkuijlen, Hedy Juwana, Alwin D R Huitema et al. (2012) Cytolytic virus activation therapy for Epstein-Barr virus-driven tumors. Clin Cancer Res 18: 5061-5070. [Crossref]
- Wen hai Feng, Bruce Israel, Nancy Raab Traub, Pierre Busson, Shannon C Kenney (2002) Chemotherapy induces lytic EBV replication and confers ganciclovir susceptibility to EBV-positive epithelial cell tumors. Cancer Res 62: 1920-1926. [Crossref]
- Eun Ji Jung, You Mie Lee, Byung Lan Lee, Mee Soo Chang, Woo Ho Kim (2007) Ganciclovir augments the lytic induction and apoptosis induced by chemotherapeutic agents in an Epstein-Barr virus-infected gastric carcinoma cell line. Anticancer Drugs 18: 79-85. [Crossref]
- Sharon D Stoker, Zlata Novalić, Maarten A Wildeman, Alwin D R Huitema, Sandra A W M Verkuijlen et al. (2015) Epstein-Barr virus-targeted therapy in nasopharyngeal carcinoma. J Cancer Res Clin Oncol 141: 1845-1857. [Crossref]
- Wen-hai Feng, Gregory Hong, Henri Jacques Delecluse, Shannon C Kenney (2004) Lytic induction therapy for Epstein-Barr virus-positive B-cell lymphomas. J Virol 78: 1893-1902. [Crossref]
- Laszlo Markasz, György Stuber, Emilie Flaberg, Asa Gustafsson Jernberg, Staffan Eksborg et al. (2006) Cytotoxic drug sensitivity of Epstein-Barr virus transformed lymphoblastoid B-cells. BMC Cancer 6: 265. [Crossref]
- Octavia Ramayanti, Mitch Brinkkemper, Sandra A W M Verkuijlen, Leni Ritmaleni, Mei Lin Go et al. (2018) Curcuminoids as EBV Lytic Activators for Adjuvant Treatment in EBV-Positive Carcinomas. Cancers (Basel) 10: 89. [Crossref]
- Sang Taek Oh, Jung Ho Cha, Dong Jik Shin, Sungjoo Kim Yoon, Suk Kyeong Lee (2007) Establishment and characterization of an in vivo model for Epstein-Barr virus positive gastric carcinoma. J Med Virol 79: 1343-1348. [Crossref]
- J G Park, H K Yang, W H Kim, J K Chung, M S Kang et al. (1997) Establishment and characterization of human gastric carcinoma cell lines. Int J Cancer 70: 443-449. [Crossref]
- G J Peters, A M Bergman, V W Ruiz van Haperen, G Veerman, C M Kuiper et al. (1995) Interaction between cisplatin and gemcitabine in vitro and in vivo. Semin Oncol 22: 72-79. [Crossref]
- Amane Takahashi, Yoshiyuki Yamamoto, Masahiro Yasunaga, Yoshikatsu Koga, Jun ichiro Kuroda et al. (2013) NC-6300, an epirubicin-incorporating micelle, extends the antitumor effect and reduces the cardiotoxicity of epirubicin. Cancer Sci 104: 920-925. [Crossref]
- Servi J C Stevens, Sandra A W M Verkuijlen, Jaap M Middeldorp (2005) Quantitative detection of Epstein-Barr virus DNA in clinical specimens by rapid real-time PCR targeting a highly conserved region of EBNA-1. Methods Mol Biol 292: 15-26. [Crossref]
- A T Hesselink, A J C van den Brule, Z M A Groothuismink, M Molano, J Berkhof et al. (2005) Comparison of three different PCR methods for quantifying human papillomavirus type 16 DNA in cervical scrape specimens. J Clin Microbiol 43: 4868-4871. [Crossref]
- Hans Lassmann, Gerald Niedobitek, Francesca Aloisi, Jaap M Middeldorp (2011) Epstein-Barr virus in the multiple sclerosis brain: a controversial issue--report on a focused workshop held in the Centre for Brain Research of the Medical University of Vienna, Austria. Brain 134: 2772-2786. [Crossref]
- Christiaan Klijn, Steffen Durinck, Eric W Stawiski, Peter M Haverty, Zhaoshi Jiang et al. (2015) A comprehensive transcriptional portrait of human cancer cell lines. Nat Biotechnol 33: 306-312. [Crossref]