Journals
Combining A Second-Generation Multivariate Index Assay with Ovarian Imaging Improves the Preoperative Assessment of An Adnexal Mass
A B S T R A C T
Background: To understand the relationship between imaging and the next generation multivariate index assay (MIA2G) in the preoperative assessment of an adnexal mass. Methods: Serum samples and imaging data from two previously published studies are reanalyzed using the MIA2G test. We calculated the clinical performance of MIA2G and discrete imaging features associated with malignant risk. Results: 878 women were eligible for this analysis, 48.3% post-menopausal and 51.7% pre-menopausal. The prevalence of having a malignant pathology was 18%. Ultrasound was the most frequently used imaging modality. The combination of MIA2G “or” ultrasound resulted in higher sensitivity than either test alone, 93.5% compared to 87.6% for MIA2G and 74.2% for ultrasound. The negative predictive value was high: 94.6% for ultrasound, 98.1% for MIA2G “or” ultrasound. MIA2G “and” ultrasound had higher specificity but lower sensitivity than MIA2G or ultrasound alone. Similar results were seen for CT scan when evaluated with MIA2G. Conclusion: MIA2G and pelvic imaging are complementary tests and interpreting them together can provide important information about the malignant risk of an ovarian tumor. For physicians making decisions about a referral to a specialist, the combination of MIA2G “or” ultrasound has the highest sensitivity in predicting ovarian malignancy.
Keywords
MIA2G, multivariate index assay, ovarian cancer, adnexal mass, pelvic imaging, ovarian malignancy, transvaginal ultrasound, serum biomarker test
Introduction
Ovarian cancer is the second most common gynecologic cancer and the leading cause of gynecologic cancer death. In contrast to other malignancies, the overall five-year survival has improved only modestly over the last forty years [1]. There is a survival benefit when ovarian cancer surgery is performed by a gynecologic oncologist compared to a general gynecologist or a general surgeon [2-5]. The challenge is determining which ovarian tumors are at sufficient risk to warrant referral. In 2009, the FDA cleared the Multivariate Index Assay (MIA, known commercially as OVA1®) as the first blood test to help clinicians determine whether an ovarian tumor is at high-risk for malignancy and appropriate for referral to a gynecologic oncologist for surgery [6]. As of 2011, fewer than 37% of patients were receiving comprehensive surgical staging for ovarian cancer [7].
Ovarian imaging is widely available for the preoperative evaluation of an adnexal mass, but there is no standardized algorithm, so its application and usefulness vary dramatically [8-10]. As a consequence, women may ultimately receive multiple imaging studies before surgical intervention as the perceived expertise increases with each referral [8]. Previous publications reported on the success of combining MIA with the physician impression (patient history, physical examination, and imaging) [6, 11]. And more recently, it was reported that when both the imaging and MIA were low-risk, only 1.6% of ovarian tumors were malignant [12].
In 2016, a second generation test (MIA2G, commercially known as Overa) was FDA cleared for preoperative use. MIA2G employs additional biomarkers and updated algorithms to improve the clinical utility when evaluating the malignant risk for an ovarian tumor. In addition to higher cancer specificity, the MIA2G test includes follicle stimulating hormone (FSH) which eliminates the need to report a woman’s menopausal status, making it easier to interpret [13]. The aim of this study is to determine the effectiveness of pelvic imaging with MIA2G in the preoperative evaluation of an adnexal mass to guide appropriate patient referral.
Materials & Methods
The subjects for this study are from two previously published trials, OVA1 and OVA500 [6, 11]. Subjects were enrolled prospectively at 44 sites across the United States from primary care women’s health clinics, obstetrics and gynecology groups, gynecologic oncology practices, community and university hospitals, and health maintenance organizations. Both studies evaluated the first generation MIA test and used the same inclusion and exclusion criteria to determine the correlation between MIA results and the surgical pathology. Inclusion criteria were females 18 years of age and older, documented ovarian tumor with surgery planned within three months of imaging, consent to phlebotomy, and signed informed consent. Also, subjects were required to have sufficient blood samples to perform the testing. The exclusion criteria were females less than 18 years old, a previously diagnosed malignancy in the previous five years (except non-melanoma skin cancer), no planned surgical intervention, or lack of consent for a surgical procedure or phlebotomy. For both studies, menopause was defined as lack of menstruation for 12 consecutive months or age 50 or older if no recorded menstrual history. Each participating study site obtained institutional review board approval.
MIA2G Test: Blood collection and handling methods are previously published trials [6, 11, 13]. Serum biomarker concentrations were determined on the Roche cobas 6000® (Indianapolis, IN) clinical analyzer, utilizing the c501 and e601 modules. Biomarker assays were run according to the manufacturer’s packages insert instructions. All measurements were performed at the CLIA/CAP certified laboratory in the Division of Clinical Chemistry, Department of Pathology, Johns Hopkins Medical Institution. The MIA2G multivariate index utilizes the results of the biomarker concentrations from the cobas assays for apolipoprotein A-1 (APO A-1), cancer antigen 125 (CA 125-II), human epididymis protein 4 (HE4), follicle stimulating hormone (FSH) and transferrin (TRF). The MIA2G risk score was calculated using OvaCalc software version 4.0.0, which combines the five biomarker values via a proprietary algorithm (Vermillion, Inc) to return a dimensionless numerical score from 0.0 to 10.0. A value of less than 5.0 is interpreted as low-risk for ovarian malignancy while greater than or equal to 5.0 is interpreted as high-risk for ovarian malignancy, regardless of menopausal status.
Ovarian Imaging: Imaging tests for the OVA1 and OVA500 studies included computed tomography (CT), ultrasound, or magnetic resonance imaging (MRI). Physicians were allowed to choose the type and number of studies performed. Images were prospectively obtained before enrollment to identify and characterize the ovarian mass. Only nine patients received MRI-only, and they were omitted from analysis because of low numbers. The imaging variables previously identified from the OVA1 and OVA500 trials to be significantly predictive of ovarian malignancy (p< .001 for each) were solid or papillary components (odds ratio [OR] = 4.2; 95% confidence interval [CI] = 3.0-5.8), ascites (OR = 8.0; 95% CI = 5.3-12.1), and metastatic implants (OR = 28.3; 95% CI = 9.9-80.8). Similar to analyses done with previous publications, patients with ascites or metastatic implants were omitted from the high-risk category because the MIA2G test is not recommended for use when the clinical presentation is suggestive of advanced stage malignancy [12]. Patients with clinical findings of advanced ovarian cancer should are referred to a specialist without MIA2G testing. Ovarian tumors were deemed low-risk by imaging if they were unilocular or septate without high-risk features. If participants received multiple imaging modalities, they were considered independent events and analyzed separately.
Statistical Methods: Applied Clinical Intelligence (Bala Cynwyd, PA) performed the statistical analysis. Biomarker and imaging results were stratified based on the type of imaging, pathologic diagnosis, and stage of malignancy. The calculated clinical performance data include the following: sensitivity, specificity, positive predictive value (PPV), negative predictive value (NPV), percentage malignant, and odds ratios (OR’s). The combined MIA2G “or” imaging risk results was declared positive when the patient had either a high-risk MIA2G score “or” any high-risk imaging finding. Accordingly, the combination was considered low-risk when both MIA2G and imaging yielded low-risk results. The combined MIA2G “and” imaging risk results were declared positive when the patient had both a high-risk MIA2G score “and” any high-risk imaging finding. We constructed ninety-five percent confidence intervals (CI) where appropriate. Logistic regression was used to model the risk of malignancy as a function of the imaging result and the calculated MIA2G score rather than a low-risk versus high-risk classification. Logistic regression was performed using the R Programming Language [14]. Other statistical analyses were performed with SAS software (version 9.2; SAS Institute Inc., Cary, NC).
Results
The study cohort consisted of data combined from two previously performed and published prospective clinical trials (OVA1: Feb 2007-April 2008; OVA500: Aug 2010-December 2011). Of the 1,110 women enrolled in the two previous trials, 878 patients were evaluable based on the availability of imaging data and MIA2G result. The nine subjects (five premenopausal and four postmenopausal) who received an MRI only were included in the analysis of MIA2G performance, but not included for an individual MRI imaging analysis because of the small number.
Table 1: Summary of eligible subjects
|
|
All Subjects |
Ultrasound Only |
CT Scan Only |
Ultrasound and CT Scan |
||||||||
|
|
Pre-menopausal Subjects |
Post-menopausal Subjects |
All Evaluable Subjects |
Pre-menopausal Subjects |
Post-menopausal Subjects |
All Evaluable Subjects |
Pre-menopausal Subjects |
Post-menopausal Subjects |
All Evaluable Subjects |
Pre-menopausal Subjects |
Post-menopausal Subjects |
|
|
Age, Years |
||||||||||||
|
N |
878 |
454 |
424 |
565 |
325 |
240 |
160 |
58 |
102 |
144 |
66 |
78 |
|
Mean (SD) |
49.9 (14.1) |
40.0 (8.6) |
60.6 (10.7) |
47.7 (13.4) |
39.4 (8.7) |
58.8 (10.2) |
55.8 (14.5) |
41.9 (8.5) |
63.7 (10.7) |
52.1 (14.6) |
40.4 (7.9) |
62.0 (11.3) |
|
Median |
49 |
42 |
60 |
46 |
41 |
58 |
54 |
43.5 |
63.5 |
50 |
42 |
62 |
|
Range (min, max) |
18, 92 |
18, 60 |
33, 92 |
18, 84 |
18, 57 |
33, 84 |
18, 92 |
18, 60 |
37, 92 |
24, 90 |
24, 58 |
35, 90 |
|
Pathology Diagnosis, n (%) |
||||||||||||
|
Benign ovarian conditions |
717 (81.7) |
410 (90.3) |
307 (72.4) |
503 (89.0) |
306 (94.2) |
197 (82.1) |
86 (53.8) |
39 (67.2) |
47 (46.1) |
119 (82.6) |
60 (90.9) |
59 (75.6) |
|
Epithelial ovarian cancer |
95 (10.8) |
23 (5.1) |
72 (17.0) |
36 (6.4) |
9 (2.8) |
27 (11.3) |
41 (25.6) |
10 (17.2) |
31 (30.4) |
18 (12.5) |
4 (6.1) |
14 (17.9) |
|
Other primary ovarian conditions (non-EOC) |
8 (0.9) |
4 (0.9) |
4 (0.9) |
6 (1.1) |
3 (0.9) |
3 (1.3) |
2 (1.3) |
1 (1.7) |
1 (1.0) |
0 (0.0) |
0 (0.0) |
0 (0.0) |
|
Low malignant potential (Borderline) |
37 (4.2) |
9 (2.0) |
28 (6.6) |
12 (2.1) |
4 (1.2) |
8 (3.3) |
21 (13.1) |
4 (6.9) |
17 (16.7) |
4 (2.8) |
1 (1.5) |
3 (3.8) |
|
Non-primary ovarian malignancies with involvement of the ovaries |
10 (1.1) |
4 (0.9) |
6 (1.4) |
3 (0.5) |
2 (0.6) |
1 (0.4) |
5 (3.1) |
2 (3.4) |
3 (2.9) |
2 (1.4) |
0 (0.0) |
2 (2.6) |
|
Non-primary ovarian malignancies with no involvement of the ovaries |
11 (1.3) |
4 (0.9) |
7 (1.7) |
5 (0.9) |
1 (0.3) |
4 (1.7) |
5 (3.1) |
2 (3.4) |
3 (2.9) |
1 (0.7) |
1 (1.5) |
0 (0.0) |
|
Stage, n(%) (EOC and other primary) |
||||||||||||
|
Stage I |
46 (44.7) |
13 (48.1) |
33 (43.4) |
20 (47.6) |
6 (50.0) |
14 (46.7) |
16 (37.2) |
4 (36.4) |
12 (37.5) |
10 (55.6) |
3 (75.0) |
7 (50.0) |
|
Stage II |
18 (17.5) |
6 (22.2) |
12 (15.8) |
4 (9.5) |
2 (16.7) |
2 (6.7) |
10 (23.3) |
4 (36.4) |
6 (18.8) |
4 (22.2) |
0 (0.0) |
4 (28.6) |
|
Stage III |
36 (35.0) |
7 (25.9) |
29 (38.2) |
17 (40.5) |
4 (33.3) |
13 (43.3) |
15 (34.9) |
2 (18.2) |
13 (40.6) |
4 (22.2) |
1 (25.0) |
3 (21.4) |
|
Stage IV |
1 (1.0) |
0 (0.0) |
1 (1.3) |
0 (0.0) |
0 (0.0) |
0 (0.0) |
1 (2.3) |
0 (0.0) |
1 (3.1) |
0 (0.0) |
0 (0.0) |
0 (0.0) |
|
Not Given |
2 (1.9) |
1 (3.7) |
1 (1.3) |
1 (2.4) |
0 (0.0) |
1 (3.3) |
1 (2.3) |
1 (9.1) |
0 (0.0) |
0 (0.0) |
0 (0.0) |
0 (0.0) |
|
Imaging, n (%) |
||||||||||||
|
High risk |
460 (52.4) |
224 (49.3) |
236 (55.7) |
267 (47.3) |
150 (46.2) |
117 (48.8) |
109 (68.1) |
36 (62.1) |
73 (71.6) |
77 (53.5) |
33 (50.0) |
44 (56.4) |
|
Low risk |
418 (47.6) |
230 (50.7) |
188 (44.3) |
298 (52.7) |
175 (53.8) |
123 (51.3) |
51 (31.9) |
22 (37.9) |
29 (28.4) |
67 (46.5) |
33 (50.0) |
34 (43.6) |
|
MIA2G, n (%) |
||||||||||||
|
High risk |
375 (42.7) |
153 (33.7) |
222 (52.4) |
201 (35.6) |
98 (30.2) |
103 (42.9) |
106 (66.3) |
29 (50.0) |
77 (75.5) |
65 (45.1) |
26 (39.4) |
39 (50.0) |
|
Low risk |
503 (57.3) |
301 (66.3) |
206 (48.6) |
364 (64.4) |
227 (69.8) |
137 (57.1) |
54 (33.8) |
29 (50.0) |
25 (24.5) |
79 (54.1) |
40 (60.6) |
39 (50.0) |
*High Risk indicated by the presence of solid tumor or papillary morphology as seen on ultrasound, CT scan, or both. The 9 subjects who received MRI exclusively were excluded from imaging group analysis due to low numbers. Those with metastatic disease or ascites were excluded since MIA2G is not recommended for those with high clinical suspicion of malignancy.
MIA2G = second generation multivariate index assay. High-risk MIA2G value is ≥5.0 for all women.
Table 1 summarizes subject distribution based on their clinicopathological features. The subjects were similarly distributed based on menopausal status with 51.7% pre- and 48.3% post-menopausal. The pathology included 717 benign ovarian tumors, 124 malignancies, and 37 ovarian tumors of low malignant potential. Of the malignancies, 95 (76.6%) were epithelial ovarian cancer, 8 (6.5%) were non-epithelial ovarian malignancies, and 21 (16.9%) were non-primary ovarian malignancies with and without involvement of the ovaries. For epithelial and non-epithelial primary ovarian malignancies, the stage at detection was 46 (44.7%) stage I, 18 (17.5%) stage II, 36 (35%) stage III, and one (1%) stage IV. Stage was unknown for two women.
For any imaging modality, 460 (52.4%) women had high-risk imaging, and 418 (47.6%) had low-risk imaging characteristics. Fifty-six percent (236/424) of postmenopausal women had high-risk imaging compared to 49% (224/454) of premenopausal women. There were 230 (50.7%) premenopausal and 188 (44.3%) postmenopausal women with low-risk imaging. For MIA2G, 375 (42.7%) women had high-risk scores (≥5.0), and 503 (57.3%) had low-risk scores (<5.0). There were more high-risk MIA2G results in postmenopausal women (n=222, 52.4%) than premenopausal (n=153, 33.7%) and the majority of low-risk scores were in premenopausal women (n=301, 66.3%).
In the ultrasound cohort, 503 (89%) patients had benign tumors, 50 (8.8%) patients had malignant pathology (ovarian primary and non-ovarian primary), and 12 had borderline ovarian tumors (2.1%). Forty-seven percent of subjects had high-risk features such as solid or papillary components, ascites, or metastatic implants. Of the 503 ultrasound scans performed in subjects with benign pathology, 43.9% reported high-risk features. Conversely, high-risk features were demonstrated in 74.2% of the 62 ultrasound scans performed in subjects with malignant pathology.
In the CT scan cohort, there were 160 subjects, 53.8% with benign and 46.3% with malignant pathology. High-risk imaging (ascites, metastatic deposits, and solid or papillary components) was present in 68.1% of subjects. The high-risk imaging was more common in women with malignancy than benign disease (53.2% vs. 46.8%, respectively). MIA2G was high-risk in 66.3% of women who received a CT scan. Similar to the high-risk findings in the ultrasound group, high-risk MIA2G was more common in postmenopausal compared to premenopausal women (67% vs. 33%, respectively).
There were 144 women in the ultrasound and CT scan cohort, with 82.6% benign and 14.6% malignant. High-risk imaging was appreciated by either modality in 53.5% of patients, with 56.4% being in postmenopausal women. In this group, MIA2G was high-risk in 45.1% of women, and 60% were in postmenopausal women.
Table 2: Subjects stratified by pathology
|
All Evaluable Subjects |
Subjects with Benign Pathology |
Subjects with Malignant Pathology |
|
|
Ultrasound or CT Scan |
|||
|
N |
878 |
717 |
161 |
|
High risk |
460 (52.4) |
335 (46.7) |
125 (77.6) |
|
Low risk |
418 (47.6) |
382 (53.3) |
36 (22.4) |
|
Ultrasound only |
|||
|
N |
565 |
503 |
62 |
|
High risk |
267 (47.3) |
221 (43.9) |
46 (74.2) |
|
Low risk |
298 (52.7) |
282 (56.1) |
16 (25.8) |
|
CT Scan Only |
|||
|
N |
160 |
86 |
74 |
|
High risk |
109 (68.1) |
51 (59.3) |
58 (78.4) |
|
Low risk |
51 (31.9) |
35 (40.7) |
16 (21.6) |
|
Ultrasound and CT Scan |
|||
|
N |
144 |
119 |
25 |
|
High risk |
77 (75.5) |
56 (47.1) |
21 (84.0) |
|
Low risk |
25 (24.5) |
63 (52.9) |
4 (16.0) |
Note: A high-risk imaging result comes from either an ultrasound, a CT scan, or both. The nine subjects who received MRI exclusively were excluded from imaging group analysis due to low numbers
Table 2 summarizes the number of subjects in each imaging cohort as stratified by pathology.
Table 3: Clinical performance
|
MIA2G Alone, Overall (N=878) |
US Only Cohort, Imaging Alone (N=565) |
US Only Cohort, MIA2G Alone (N=565) |
CT Only Cohort, Imaging Alone (N=160) |
CT Only Cohort, MIA2G Alone (N=160) |
US AND CT Cohort, Imaging Alone (N = 144) |
US AND CT Cohort, MIA2G Alone (N = 144) |
|
|
Sensitivity |
|||||||
|
% |
87.6 |
74.2 |
85.5 |
78.4 |
91.9 |
84.0 |
80.0 |
|
n/N |
141/161 |
46/62 |
53/62 |
58/74 |
68/74 |
21/25 |
20/25 |
|
95% CI |
82.5 to 92.7 |
62.1 to 83.4 |
74.7 to 92.2 |
67.7 to 86.2 |
83.4 to 96.2 |
69.6 to 98.4 |
64.3 to 95.7 |
|
Specificity |
|||||||
|
% |
67.4 |
56.1 |
70.6 |
40.7 |
55.8 |
52.9 |
62.2 |
|
n/N |
483/717 |
282/503 |
355/503 |
35/86 |
48/86 |
63/119 |
74/119 |
|
95% CI |
63.9 to 71.0 |
51.7 to 60.3 |
66.5 to 74.4 |
30.9 to 51.2 |
45.3 to 65.8 |
44.0 to 61.9 |
53.5 to 70.9 |
|
Positive Predictive Value |
|||||||
|
% |
37.6 |
17.2 |
26.4 |
53.2 |
64.2 |
27.3 |
30.8 |
|
n/N |
141/375 |
46/267 |
53/201 |
58/109 |
68/106 |
21/77 |
20/65 |
|
95% CI |
33.0 to 42.5 |
12.7 to 21.8 |
20.3 to 32.5 |
43.8 to 62.6 |
55.0 to 73.3 |
17.3 to 37.2 |
19.5 to 42.0 |
|
Negative Predictive Value |
|||||||
|
% |
96.0 |
94.6 |
97.5 |
68.6 |
88.9 |
94.0 |
93.7 |
|
n/N |
483/503 |
282/298 |
355/364 |
35/51 |
48/54 |
63/67 |
74/79 |
|
95% CI |
94.3 to 97.7 |
92.1 to 97.2 |
95.9 to 99.1 |
55.9 to 81.4 |
80.5 to 97.3 |
88.4 to 99.7 |
88.3 to 99.0 |
Note: Performance based on high-risk imaging result and MIA2G ≥5.0. All patients include primary EOC, non-EOC primary ovarian malignancies, LMP, metastases to the ovaries, other non-primary ovarian malignancies with no ovary involvement, plus those with benign ovarian conditions
Table 3 lists the statistical performance for predicting malignancy for MIA2G compared to imaging. Overall, MIA2G correctly identified 141 of 161 malignancies, and 483 of 717 non-malignancies, with a calculated sensitivity of 87.6% and specificity of 67.4%. Ultrasound had a statistically lower sensitivity (74.2% vs. 85.5%; CI 62.1% to 83.4%) and lower specificity (56.1% vs. 70.6%; CI 51.7% to 60.3%) compared to MIA2G. Similarly, CT scan had lower sensitivity of (78.4% vs. 91.9%; CI 67.7% to 86.2%) and lower specificity (40.7% vs 55.8%; CI 30.9% to 51.2%) than MIA2G. For the ultrasound “and” CT scan cohort, test specificity was higher for MIA2G alone, while there was no statistical difference in sensitivity.
Table 4: Clinical performance of MIA2G in conjunction with imaging
|
|
MIA2G or Ultrasound (N=565) |
MIA2G and Ultrasound (N=565) |
MIA2G or CT Scan (N=160) |
MIA2G and CT Scan (N=160) |
MIA2G or Ultrasound + CT Scan (N=144) |
MIA2G and Ultrasound + CT Scan (N=144) |
|
Sensitivity |
||||||
|
% |
93.5 |
66.1 |
95.9 |
74.3 |
96.0 |
68.0 |
|
n/N |
58/62 |
41/62 |
71/74 |
55/74 |
24/25 |
17/25 |
|
95% CI |
84.6 to 97.5 |
53.7 to 76.7 |
88.7 to 98.6 |
63.3 to 82.9 |
88.3 to 100.0 |
49.7 to 86.3 |
|
Specificity |
||||||
|
% |
41.7 |
84.9 |
24.4 |
72.1 |
37.0 |
78.2 |
|
n/N |
210/503 |
427/503 |
21/86 |
62/86 |
44/119 |
93/119 |
|
95% CI |
37.5 to 46.1 |
81.5 to 87.8 |
16.6 to 34.5 |
61.8 to 80.5 |
28.3 to 45.6 |
70.7 to 85.6 |
|
Positive Predictive Value |
||||||
|
% |
16.5 |
35.0 |
52.2 |
69.6 |
24.2 |
39.5 |
|
n/N |
58/351 |
41/117 |
71/136 |
55/79 |
24/99 |
17/43 |
|
95% CI |
12.6 to 20.4 |
26.4 to 43.7 |
43.8 to 60.6 |
59.5 to 79.8 |
15.8 to 32.7 |
24.9 to 54.1 |
|
Negative Predictive Value |
||||||
|
% |
98.1 |
95.3 |
87.5 |
76.5 |
97.8 |
92.1 |
|
n/N |
210/214 |
427/448 |
21/24 |
62/81 |
44/45 |
93/101 |
|
95% CI |
96.3 to 99.9 |
92.9 to 96.9 |
74.3 to 100.0 |
67.3 to 85.8 |
93.5 to 100.0 |
86.8 to 97.3 |
Note: Performance based on high-risk imaging result and MIA2G ≥5.0. All patients include primary EOC, non-EOC primary ovarian malignancies, LMP, metastases to the ovaries, and other non-primary ovarian malignancies with no ovary involvement, plus those with benign ovarian conditions.
Table 4 summarizes the performance of MIA2G in parallel or sequential combination with imaging in predicting malignancy. MIA2G “or” ultrasound imaging (either test being high-risk) identified 58 of 62 malignancies and 210 of 503 nonmalignant tumors resulting in a sensitivity of 94% (CI 84.6% to 97.5%) and specificity of 42% (CI 37.5% to 46.1%). This combination also had the highest NPV (98%, CI 96.3% to 99.9%) of all combinations evaluated. MIA2G “and” ultrasound imaging (both tests being high-risk) correctly identified 41 of the 62 malignancies and 427 of 503 nonmalignant ovarian tumors with a calculated sensitivity of 66% (CI 53.7% to 76.7%) and specificity of 85% (CI 81.5% to 87.8%). In comparison, MIA2G “or” CT imaging had slightly higher sensitivity but significantly lower specificity than MIA2G “or” ultrasound imaging. MIA2G “and” CT imaging demonstrated modest test sensitivity, but high specificity and the best PPV of any combination (69.6%, CI 59.5% to 79.8%). For patients with both US and CT scan, MIA2G and imaging had a sensitivity of 96% (CI 88.3%-100%) and specificity of 37% (CI 28.3% to 45.6%). MIA2G and both imaging modalities demonstrated a sensitivity of 68% (CI 49.7% to 86.3%) and specificity of 78.2% (CI 70.7% to 85.6%).
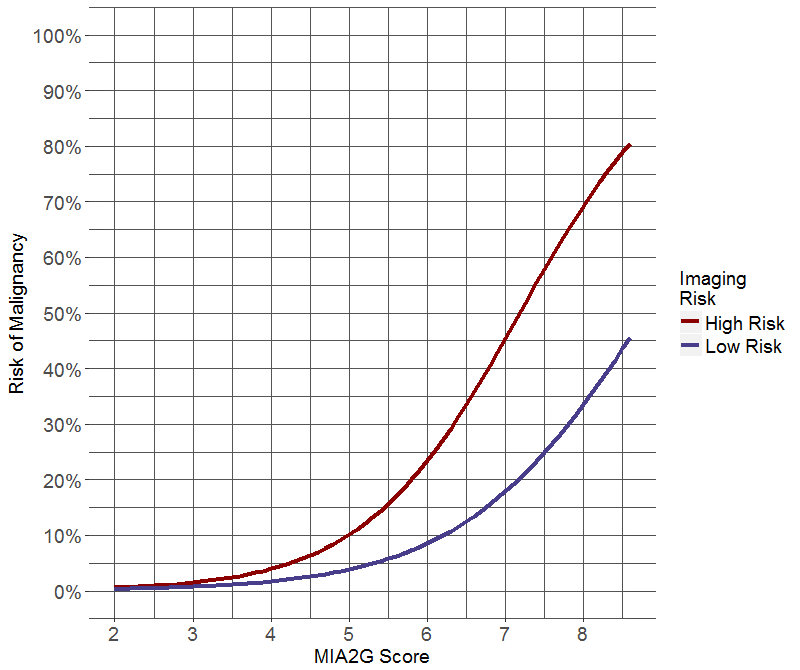
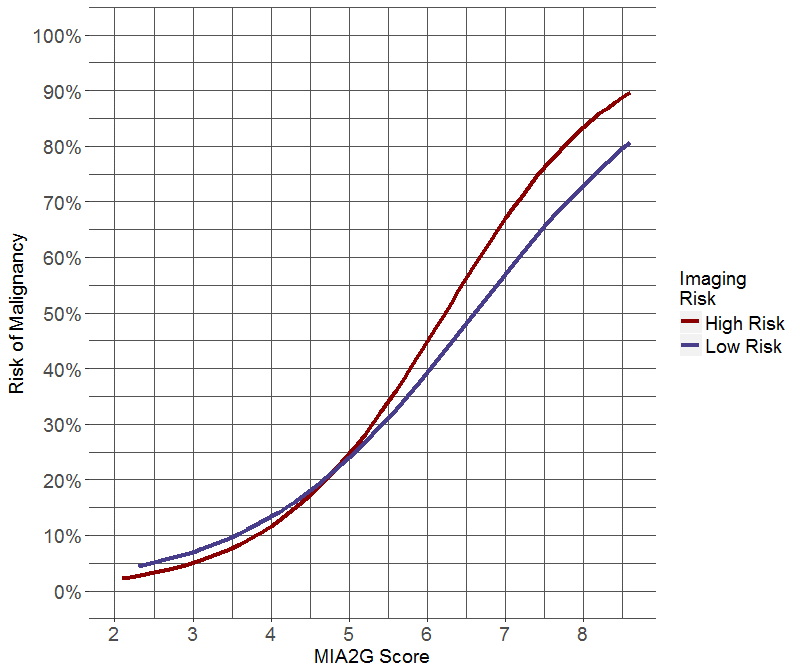
Figure 1: Logistic regression analysis estimating the risk of ovarian malignancy as a function of MIA2G risk score and imaging result (low or high-risk). (a) Predicted risk of ovarian malignancy for MIA2G with ultrasound. (b) Predicted risk of ovarian malignancy for MIA2G with CT scan.
MIA2G performed similarly in premenopausal and postmenopausal study populations. In the premenopausal population, MIA2G had a calculated sensitivity of 86.4%, specificity of 72.0%, PPV of 24.8%, and NPV of 98.0%. In the postmenopausal population the sensitivity, specificity, PPV and NPV was 88.0%, 61.2%, 46.4%, and 93.1%, respectively. Test sensitivity for MIA2G by stage at presentation was as follows: stage I 80.4% (37/46), stage II 100% (18/18), stage I and II 85.9% (55/64), and stage III and IV 100% (37/37). Using logistic regression, we modeled the risk of malignancy as a function of MIA2G score and imaging risk for ultrasound (Figure 1a) and CT scan (Figure 1b). These figures estimate the clinical probability of malignancy based on imaging and MIA2G results.
Discussion
Ovarian imaging is recommended in the preoperative evaluation of an adnexal mass by National Cancer Care Network (NCCN), and American College of Obstetrics and Gynecology (ACOG) published guidelines [5, 15]. Several serum biomarkers are also available for preoperative use in evaluating ovarian tumor risk. Since imaging and serum biomarkers are complementary tests, they can be combined to enhance our ability to estimate the malignant risk of an ovarian tumor [12]. The results of this investigation help clarify the clinical utility of combining ovarian imaging with MIA2G in predicting the malignant potential of an adnexal mass. The MIA2G biomarker algorithm uses clinical application-specific design principles similar to the first generation MIA test [16]. Clinical validation studies showed similar sensitivity and NPV, but higher specificity and PPV compared to the first generation MIA test [6, 11, 13, 14]. The improvement in test performance will likely enrich the cancer prevalence in patients referred to subspecialists, lessen patient anxiety related to unnecessary referral, and have a favorable cost impact.
How two diagnostic tests are combined influences their performance and clinical interpretation. As an independent test, MIA2G has high sensitivity (88%) at identifying malignancy and improved test specificity compared to the first generation MIA test (67% and 54%, respectively) [11]. As expected for tests combined in parallel, MIA2G “or” imaging has the highest sensitivity (94% with ultrasound and 96% with CT scan). Thus, a primary care provider utilizing these tests will miss the fewest cancers if an ovarian tumor is considered to be at increased malignant risk when either the MIA2G test or the imaging test is high-risk. The statistical consequence of combining tests in a parallel manner is a decrease in specificity (42% with ultrasound, 24% with CT scan, and 37% with CT “or” ultrasound). When combined in series, MIA2G “and” imaging has higher specificity (85% with ultrasound, 72% with CT scan, 78% with CT “and” ultrasound). Fewer false positive outcomes mean low-risk results will accurately portray a higher fraction of women without cancer. When combined in series, MIA2G and imaging may provide valuable information to assist with patient discussions, surgical counseling, decisions regarding the urgency of the operation, or the preferred surgical approach.
Physician assessment is a prediction about whether an ovarian tumor is malignant based on a complete preoperative evaluation, including physical examination, imaging, and laboratory results. The sensitivity for physician assessment has been previously reported to be 74% (68.8 to 79.5), which is similar to the sensitivity of ultrasound alone in this study [17]. In this investigation, MIA2G identified seven (7) cancers that were missed by ultrasound alone and ten malignancies that were missed by CT scan alone. Thus, preoperative imaging and physical examination without the use of serum biomarkers will misinterpret as benign a significant number of patients with ovarian malignancy, which is known to reduce patient survival.
While the clinical interpretation of imaging can be subjective, specific radiologic findings are generally well-accepted. This study confirms that metastatic implants are more likely to be identified on CT scan compared to ultrasound. A pelvic ultrasound readily identifies the presence of pelvic fluid but can overlook extra-pelvic fluid, making for a less accurate prediction of advanced ovarian malignancy. Specific high-risk ultrasound features of ovarian tumors have been well described in the literature and include solid components, papillary projections, metastatic implants, and ascites [18, 19]. Conversely, unilocular or septate ovarian cysts are at low risk for malignancy [20, 21]. More rigorous ultrasound algorithms have reported better performance in predicting ovarian malignancy than the algorithm used in this investigation [19, 22, 23]. The simplified algorithm was chosen to facilitate uniform utilization over a large number of study sites. It also highlights the improved cancer detection rates seen when combining serum biomarkers with standard imaging. The interpretation of imaging is subjective and varies widely depending on method and expertise. In this study, the addition of an objective biomarker test to imaging improves cancer detection compared to imaging alone, overcoming some of the challenges of physician assessment and subjectivity that lower sensitivity.
The use of biomarkers and imaging to predict the malignant risk of an ovarian tumor has been extensively studied [5, 6, 11, 13, 14, 18, 19, 21-28]. The type of test and the method used to combine them dramatically affects performance. While most publications show improved performance when imaging and biomarkers are combined, some studies have not reported a benefit with the addition of CA125 HE4 or ROMA (CA125 + HE4) compared to ultrasound alone [[27, 28]. We show that the Boolean combination of imaging “and” serum biomarker increases specificity, while the combination of imaging “or” biomarker increases sensitivity. Given that there is no accepted universal ultrasound strategy, and that expertise is subjective and widely variable, it is appealing to add a quantitative test like a multivariate index assay to the preoperative evaluation of an ovarian tumor. The logistic regression graphs (Figure 1) visually display the utility of combining MIA2G and imaging to estimate an ovarian tumor’s risk of malignancy. These graphs serve as a model to assist with clinical decisions about patient referral to a gynecologic oncologist and are not intended to imply an individual risk of ovarian malignancy.
Strengths of this study include its subject numbers, multicenter prospective data collection, standardized image review, and inclusion of all tumor types (both primary and metastatic to the ovary). The enrollment sites reflect the targeted provider demographic, and the study utilizes previously validated statistical parameters. The limitations of this investigation are similar to those described in the original OVA1 and OVA500 publications, including potential selection and observer bias, retrospective analysis of prospectively collected data, lack of direct conclusions about patient referral, and a simplified imaging algorithm. In this investigation, we report the performance of MIA2G in combination with imaging. The MIA2G test result incorporates menopausal status by including FSH in its algorithm, which simplifies the clinical interpretation. Serum biomarkers and imaging are complementary tests and since all ovarian tumors have imaging performed before surgery, knowing how to interpret these tests together is valuable to the patient, referring physician, and surgeon. By uniting tests that reflect ovarian tumor morphology (imaging) and physiology (biomarker), the clinician is better able to estimate the malignant risk before surgery.
Supplementary Materials
Table S1: MIA2G Performance stratified by menopausal status
|
MIA2G Clinical Performance |
Premenopausal (N=454) |
Postmenopausal (N=424) |
|
Sensitivity |
86.4 |
88.0 |
|
38/44 |
103/117 |
|
|
Specificity |
72.0 |
61.2 |
|
295/410 |
188/307 |
|
|
PPV |
24.8 |
46.4 |
|
38/153 |
103/222 |
|
|
NPV |
98.0 |
93.1 |
|
295/301 |
188/202 |
Table S2: MIA2G Performance stratified by stage (of primary ovarian malignancy)
|
Stage I |
Stage II |
Early Stage (I & II) |
Late Stage (III & IV) |
|
80.4 (37/46) |
100.0 (18/18) |
85.9 (55/64) |
100.0 (37/37) |
Author Contributions
Conceptualization: S.T.G., T.I.F., F.R.U.; Methodology, S.T.G., T.I.F., F.R.U., T.C.P.; Formal Analysis: A.S., R.G.B., V.B.; Writing—Original Draft Preparation: T.C.P., D.G.M.; Writing—Review and Editing: S.T.G, T.I.F., F.R.U., R.G.B.
Funding
Vermillion Inc. funded this trial, but did not provide funding for this manuscript.
Conflicts of Interest
T.I.F. has no conflicts of interest to report. While working on this manuscript, S.T.G. was employed by the Department of Obstetrics and Gynecology, Division of Gynecologic Oncology, Madigan Army Medical Center, Tacoma, WA and a member of the Vermillion Inc. speaker’s bureau but did not receive honoraria. The views expressed in this manuscript reflect the opinions of the authors only, not the Department of Defense or the United States Army. F.R.U. was the principal investigator for the OVA1 trial and previously received speaking honoraria as a member of Vermillion Inc. speaker’s bureau. A.S. was Vice-President, Biometrics at Applied Clinical Intelligence and was a consultant for Vermillion Inc. at the time the analyses were completed. R.G.B., V.B., D.G.M., and T.C.P were employees of Vermillion, Inc. at the time this manuscript was researched and written.
Article Info
Article Type
Research ArticlePublication history
Received: Wed 03, Jul 2019Accepted: Fri 26, Jul 2019
Published: Fri 30, Aug 2019
Copyright
© 2023 Rowan G. Bullock. This is an open-access article distributed under the terms of the Creative Commons Attribution License, which permits unrestricted use, distribution, and reproduction in any medium, provided the original author and source are credited. Hosting by Science Repository.DOI: 10.31487/j.JSO.2019.03.04
Author Info
Corresponding Author
Rowan G. BullockVermillion, Inc., Austin, TX
Figures & Tables
Table 1: Summary of eligible subjects
|
|
All Subjects |
Ultrasound Only |
CT Scan Only |
Ultrasound and CT Scan |
||||||||
|
|
Pre-menopausal Subjects |
Post-menopausal Subjects |
All Evaluable Subjects |
Pre-menopausal Subjects |
Post-menopausal Subjects |
All Evaluable Subjects |
Pre-menopausal Subjects |
Post-menopausal Subjects |
All Evaluable Subjects |
Pre-menopausal Subjects |
Post-menopausal Subjects |
|
|
Age, Years |
||||||||||||
|
N |
878 |
454 |
424 |
565 |
325 |
240 |
160 |
58 |
102 |
144 |
66 |
78 |
|
Mean (SD) |
49.9 (14.1) |
40.0 (8.6) |
60.6 (10.7) |
47.7 (13.4) |
39.4 (8.7) |
58.8 (10.2) |
55.8 (14.5) |
41.9 (8.5) |
63.7 (10.7) |
52.1 (14.6) |
40.4 (7.9) |
62.0 (11.3) |
|
Median |
49 |
42 |
60 |
46 |
41 |
58 |
54 |
43.5 |
63.5 |
50 |
42 |
62 |
|
Range (min, max) |
18, 92 |
18, 60 |
33, 92 |
18, 84 |
18, 57 |
33, 84 |
18, 92 |
18, 60 |
37, 92 |
24, 90 |
24, 58 |
35, 90 |
|
Pathology Diagnosis, n (%) |
||||||||||||
|
Benign ovarian conditions |
717 (81.7) |
410 (90.3) |
307 (72.4) |
503 (89.0) |
306 (94.2) |
197 (82.1) |
86 (53.8) |
39 (67.2) |
47 (46.1) |
119 (82.6) |
60 (90.9) |
59 (75.6) |
|
Epithelial ovarian cancer |
95 (10.8) |
23 (5.1) |
72 (17.0) |
36 (6.4) |
9 (2.8) |
27 (11.3) |
41 (25.6) |
10 (17.2) |
31 (30.4) |
18 (12.5) |
4 (6.1) |
14 (17.9) |
|
Other primary ovarian conditions (non-EOC) |
8 (0.9) |
4 (0.9) |
4 (0.9) |
6 (1.1) |
3 (0.9) |
3 (1.3) |
2 (1.3) |
1 (1.7) |
1 (1.0) |
0 (0.0) |
0 (0.0) |
0 (0.0) |
|
Low malignant potential (Borderline) |
37 (4.2) |
9 (2.0) |
28 (6.6) |
12 (2.1) |
4 (1.2) |
8 (3.3) |
21 (13.1) |
4 (6.9) |
17 (16.7) |
4 (2.8) |
1 (1.5) |
3 (3.8) |
|
Non-primary ovarian malignancies with involvement of the ovaries |
10 (1.1) |
4 (0.9) |
6 (1.4) |
3 (0.5) |
2 (0.6) |
1 (0.4) |
5 (3.1) |
2 (3.4) |
3 (2.9) |
2 (1.4) |
0 (0.0) |
2 (2.6) |
|
Non-primary ovarian malignancies with no involvement of the ovaries |
11 (1.3) |
4 (0.9) |
7 (1.7) |
5 (0.9) |
1 (0.3) |
4 (1.7) |
5 (3.1) |
2 (3.4) |
3 (2.9) |
1 (0.7) |
1 (1.5) |
0 (0.0) |
|
Stage, n(%) (EOC and other primary) |
||||||||||||
|
Stage I |
46 (44.7) |
13 (48.1) |
33 (43.4) |
20 (47.6) |
6 (50.0) |
14 (46.7) |
16 (37.2) |
4 (36.4) |
12 (37.5) |
10 (55.6) |
3 (75.0) |
7 (50.0) |
|
Stage II |
18 (17.5) |
6 (22.2) |
12 (15.8) |
4 (9.5) |
2 (16.7) |
2 (6.7) |
10 (23.3) |
4 (36.4) |
6 (18.8) |
4 (22.2) |
0 (0.0) |
4 (28.6) |
|
Stage III |
36 (35.0) |
7 (25.9) |
29 (38.2) |
17 (40.5) |
4 (33.3) |
13 (43.3) |
15 (34.9) |
2 (18.2) |
13 (40.6) |
4 (22.2) |
1 (25.0) |
3 (21.4) |
|
Stage IV |
1 (1.0) |
0 (0.0) |
1 (1.3) |
0 (0.0) |
0 (0.0) |
0 (0.0) |
1 (2.3) |
0 (0.0) |
1 (3.1) |
0 (0.0) |
0 (0.0) |
0 (0.0) |
|
Not Given |
2 (1.9) |
1 (3.7) |
1 (1.3) |
1 (2.4) |
0 (0.0) |
1 (3.3) |
1 (2.3) |
1 (9.1) |
0 (0.0) |
0 (0.0) |
0 (0.0) |
0 (0.0) |
|
Imaging, n (%) |
||||||||||||
|
High risk |
460 (52.4) |
224 (49.3) |
236 (55.7) |
267 (47.3) |
150 (46.2) |
117 (48.8) |
109 (68.1) |
36 (62.1) |
73 (71.6) |
77 (53.5) |
33 (50.0) |
44 (56.4) |
|
Low risk |
418 (47.6) |
230 (50.7) |
188 (44.3) |
298 (52.7) |
175 (53.8) |
123 (51.3) |
51 (31.9) |
22 (37.9) |
29 (28.4) |
67 (46.5) |
33 (50.0) |
34 (43.6) |
|
MIA2G, n (%) |
||||||||||||
|
High risk |
375 (42.7) |
153 (33.7) |
222 (52.4) |
201 (35.6) |
98 (30.2) |
103 (42.9) |
106 (66.3) |
29 (50.0) |
77 (75.5) |
65 (45.1) |
26 (39.4) |
39 (50.0) |
|
Low risk |
503 (57.3) |
301 (66.3) |
206 (48.6) |
364 (64.4) |
227 (69.8) |
137 (57.1) |
54 (33.8) |
29 (50.0) |
25 (24.5) |
79 (54.1) |
40 (60.6) |
39 (50.0) |
*High Risk indicated by the presence of solid tumor or papillary morphology as seen on ultrasound, CT scan, or both. The 9 subjects who received MRI exclusively were excluded from imaging group analysis due to low numbers. Those with metastatic disease or ascites were excluded since MIA2G is not recommended for those with high clinical suspicion of malignancy.
MIA2G = second generation multivariate index assay. High-risk MIA2G value is ≥5.0 for all women.
Table 2: Subjects stratified by pathology
|
All Evaluable Subjects |
Subjects with Benign Pathology |
Subjects with Malignant Pathology |
|
|
Ultrasound or CT Scan |
|||
|
N |
878 |
717 |
161 |
|
High risk |
460 (52.4) |
335 (46.7) |
125 (77.6) |
|
Low risk |
418 (47.6) |
382 (53.3) |
36 (22.4) |
|
Ultrasound only |
|||
|
N |
565 |
503 |
62 |
|
High risk |
267 (47.3) |
221 (43.9) |
46 (74.2) |
|
Low risk |
298 (52.7) |
282 (56.1) |
16 (25.8) |
|
CT Scan Only |
|||
|
N |
160 |
86 |
74 |
|
High risk |
109 (68.1) |
51 (59.3) |
58 (78.4) |
|
Low risk |
51 (31.9) |
35 (40.7) |
16 (21.6) |
|
Ultrasound and CT Scan |
|||
|
N |
144 |
119 |
25 |
|
High risk |
77 (75.5) |
56 (47.1) |
21 (84.0) |
|
Low risk |
25 (24.5) |
63 (52.9) |
4 (16.0) |
Note: A high-risk imaging result comes from either an ultrasound, a CT scan, or both. The nine subjects who received MRI exclusively were excluded from imaging group analysis due to low numbers
Table 2 summarizes the number of subjects in each imaging cohort as stratified by pathology.
Table 3: Clinical performance
|
MIA2G Alone, Overall (N=878) |
US Only Cohort, Imaging Alone (N=565) |
US Only Cohort, MIA2G Alone (N=565) |
CT Only Cohort, Imaging Alone (N=160) |
CT Only Cohort, MIA2G Alone (N=160) |
US AND CT Cohort, Imaging Alone (N = 144) |
US AND CT Cohort, MIA2G Alone (N = 144) |
|
|
Sensitivity |
|||||||
|
% |
87.6 |
74.2 |
85.5 |
78.4 |
91.9 |
84.0 |
80.0 |
|
n/N |
141/161 |
46/62 |
53/62 |
58/74 |
68/74 |
21/25 |
20/25 |
|
95% CI |
82.5 to 92.7 |
62.1 to 83.4 |
74.7 to 92.2 |
67.7 to 86.2 |
83.4 to 96.2 |
69.6 to 98.4 |
64.3 to 95.7 |
|
Specificity |
|||||||
|
% |
67.4 |
56.1 |
70.6 |
40.7 |
55.8 |
52.9 |
62.2 |
|
n/N |
483/717 |
282/503 |
355/503 |
35/86 |
48/86 |
63/119 |
74/119 |
|
95% CI |
63.9 to 71.0 |
51.7 to 60.3 |
66.5 to 74.4 |
30.9 to 51.2 |
45.3 to 65.8 |
44.0 to 61.9 |
53.5 to 70.9 |
|
Positive Predictive Value |
|||||||
|
% |
37.6 |
17.2 |
26.4 |
53.2 |
64.2 |
27.3 |
30.8 |
|
n/N |
141/375 |
46/267 |
53/201 |
58/109 |
68/106 |
21/77 |
20/65 |
|
95% CI |
33.0 to 42.5 |
12.7 to 21.8 |
20.3 to 32.5 |
43.8 to 62.6 |
55.0 to 73.3 |
17.3 to 37.2 |
19.5 to 42.0 |
|
Negative Predictive Value |
|||||||
|
% |
96.0 |
94.6 |
97.5 |
68.6 |
88.9 |
94.0 |
93.7 |
|
n/N |
483/503 |
282/298 |
355/364 |
35/51 |
48/54 |
63/67 |
74/79 |
|
95% CI |
94.3 to 97.7 |
92.1 to 97.2 |
95.9 to 99.1 |
55.9 to 81.4 |
80.5 to 97.3 |
88.4 to 99.7 |
88.3 to 99.0 |
Note: Performance based on high-risk imaging result and MIA2G ≥5.0. All patients include primary EOC, non-EOC primary ovarian malignancies, LMP, metastases to the ovaries, other non-primary ovarian malignancies with no ovary involvement, plus those with benign ovarian conditions
Table 4: Clinical performance of MIA2G in conjunction with imaging
|
|
MIA2G or Ultrasound (N=565) |
MIA2G and Ultrasound (N=565) |
MIA2G or CT Scan (N=160) |
MIA2G and CT Scan (N=160) |
MIA2G or Ultrasound + CT Scan (N=144) |
MIA2G and Ultrasound + CT Scan (N=144) |
|
Sensitivity |
||||||
|
% |
93.5 |
66.1 |
95.9 |
74.3 |
96.0 |
68.0 |
|
n/N |
58/62 |
41/62 |
71/74 |
55/74 |
24/25 |
17/25 |
|
95% CI |
84.6 to 97.5 |
53.7 to 76.7 |
88.7 to 98.6 |
63.3 to 82.9 |
88.3 to 100.0 |
49.7 to 86.3 |
|
Specificity |
||||||
|
% |
41.7 |
84.9 |
24.4 |
72.1 |
37.0 |
78.2 |
|
n/N |
210/503 |
427/503 |
21/86 |
62/86 |
44/119 |
93/119 |
|
95% CI |
37.5 to 46.1 |
81.5 to 87.8 |
16.6 to 34.5 |
61.8 to 80.5 |
28.3 to 45.6 |
70.7 to 85.6 |
|
Positive Predictive Value |
||||||
|
% |
16.5 |
35.0 |
52.2 |
69.6 |
24.2 |
39.5 |
|
n/N |
58/351 |
41/117 |
71/136 |
55/79 |
24/99 |
17/43 |
|
95% CI |
12.6 to 20.4 |
26.4 to 43.7 |
43.8 to 60.6 |
59.5 to 79.8 |
15.8 to 32.7 |
24.9 to 54.1 |
|
Negative Predictive Value |
||||||
|
% |
98.1 |
95.3 |
87.5 |
76.5 |
97.8 |
92.1 |
|
n/N |
210/214 |
427/448 |
21/24 |
62/81 |
44/45 |
93/101 |
|
95% CI |
96.3 to 99.9 |
92.9 to 96.9 |
74.3 to 100.0 |
67.3 to 85.8 |
93.5 to 100.0 |
86.8 to 97.3 |
Note: Performance based on high-risk imaging result and MIA2G ≥5.0. All patients include primary EOC, non-EOC primary ovarian malignancies, LMP, metastases to the ovaries, and other non-primary ovarian malignancies with no ovary involvement, plus those with benign ovarian conditions.
Table S1: MIA2G Performance stratified by menopausal status
|
MIA2G Clinical Performance |
Premenopausal (N=454) |
Postmenopausal (N=424) |
|
Sensitivity |
86.4 |
88.0 |
|
38/44 |
103/117 |
|
|
Specificity |
72.0 |
61.2 |
|
295/410 |
188/307 |
|
|
PPV |
24.8 |
46.4 |
|
38/153 |
103/222 |
|
|
NPV |
98.0 |
93.1 |
|
295/301 |
188/202 |
Table S2: MIA2G Performance stratified by stage (of primary ovarian malignancy)
|
Stage I |
Stage II |
Early Stage (I & II) |
Late Stage (III & IV) |
|
80.4 (37/46) |
100.0 (18/18) |
85.9 (55/64) |
100.0 (37/37) |
References
- Siegel RL, Miller KD, Jemal A (2015) Cancer statistics, 2015. CA Cancer J Clin 65: 5-29. [Crossref]
- Giede KC, Kieser K, Dodge J, Rosen B (2005) Who should operate on patients with ovarian cancer? An evidence-based review. Gynecol Oncol 99: 447-461. [Crossref]
- Engelen MJ, Kos HE, Willemse PH, Aalders JG, de Vries EG et al. (2006) Surgery by consultant gynecologic oncologists improves survival in patients with ovarian carcinoma. Cancer 106: 589-598. [Crossref]
- Earle CC, Schrag D, Neville BA, Yabroff KR, Topor M et al. (2006) Effect of surgeon specialty on processes of care and outcomes for ovarian cancer patients. J Natl Cancer Inst 98: 172-180. [Crossref]
- American College of Obstetricians and Gynecologists (2011) ACOG Committee Opinion: Number 280, The role of the generalist obstetrician gynecologist in the early detection of epithelial ovarian cancer. Obstet Gynecol 117: 742-746.
- Ueland FR, Desimone CP, Seamon LG, Miller RA, Goodrich S et al. (2011) Effectiveness of a multivariate index assay in the preoperative assessment of ovarian tumors. Obstet Gynecol 117: 1289-1297. [Crossref]
- Chang SJ, Hodeib M, Chang J, Bristow RE (2013) Survival impact of complete cytoreduction to no gross residual disease for advanced-stage ovarian cancer: a meta-analysis. Gynecol Oncol 130: 493-498. [Crossref]
- Kupets R, Fernandes K, Miroshnichenko G, Paszat L (2013) Are too many imaging tests being performed in women with an adnexal mass? J Obstet Gynaecol Can 35: 246-251. [Crossref]
- Kalish GM, Patel MD, Gunn ML, Dubinsky TJ (2007) Computed tomographic and magnetic resonance features of gynecologic abnormalities in women presenting with acute or chronic abdominal pain. Ultrasound Q 23: 167-175. [Crossref]
- Varras M (2004) Benefits and limitations of ultrasonographic evaluation of uterine adnexal lesions in early detection of ovarian cancer. Clin Exp Obstet Gynecol 31: 85-98. [Crossref]
- Bristow RE, Smith A, Zhang Z, Chan DW, Crutcher G et al. (2013) Ovarian malignancy risk stratification of the adnexal mass using a multivariate index assay. Gynecol Oncol 128: 252-259. [Crossref]
- Goodrich ST, Bristow RE, Santoso JT, Miller RW, Smith A et al. (2014) The effect of ovarian imaging on the clinical interpretation of a multivariate index assay. Am J Obstet Gynecol 211: 65.e1-65.e11. [Crossref]
- Coleman RL, Herzog TJ, Chan DW, Munroe DG, Pappas TC et al. (2016) Validation of a second-generation multivariate index assay for malignancy risk of adnexal masses. Am J Obstet Gynecol 215: 82.e1-82.e11. [Crossref]
- Team RDC (2008) R: A Language and Environment for Statistical Computing. Vienna, Austria.
- National Comprehensive Cancer Network (2016) Ovarian cancer: including fallopian tube cancer and primary peritoneal cancer Version 1.2016. Fort Washington.
- Pepe MS, Feng Z, Janes H, Bossuyt PM, Potter JD (2008) Pivotal evaluation of the accuracy of a biomarker used for classification or prediction: standards for study design. J Natl Cancer Inst 100: 1432-1438. [Crossref]
- Longoria TC, Ueland FR, Zhang Z, Chan DW, Smith A et al. (2014) Clinical performance of a multivariate index assay for detecting early-stage ovarian cancer. Am J Obstet Gynecol 210: 78.e1- 78.e9. [Crossref]
- van Nagell JR Jr, Ueland FR (1999) Ultrasound evaluation of pelvic masses: predictors of malignancy for the general gynecologist. Curr Opin Obstet Gynecol 11: 45-49. [Crossref]
- Ueland FR, DePriest PD, Pavlik EJ, Kryscio RJ, van Nagell JR Jr (2003) Preoperative differentiation of malignant from benign ovarian tumors: the efficacy of morphology indexing and Doppler flow sonography. Gynecol Oncol 91: 46-50. [Crossref]
- Modesitt SC, Pavlik EJ, Ueland FR, DePriest PD, Kryscio RJ et al. (2003) Risk of malignancy in unilocular ovarian cystic tumors less than 10 centimeters in diameter. Obstet Gynecol 102: 594-599. [Crossref]
- Saunders BA, Podzielinski I, Ware RA, Goodrich S, DeSimone CP et al. (2010) Risk of malignancy in sonographically confirmed septated cystic ovarian tumors. Gynecol Oncol 118: 278-282. [Crossref]
- Brown DL, Dudiak KM, Laing FC (2010) Adnexal masses: US characterization and reporting. Radiology 254 :342-354. [Crossref]
- Jacobs I, Oram D, Fairbanks J, Turner J, Frost C et al. (1990) A risk of malignancy index incorporating CA 125, ultrasound and menopausal status for the accurate preoperative diagnosis of ovarian cancer. Br J Obstet Gynaecol 97: 922-929. [Crossref]
- Menon U, Skates SJ, Lewis S, Rosenthal AN, Rufford B et al. (2005) Prospective study using the risk of ovarian cancer algorithm to screen for ovarian cancer. J Clin Oncol 23: 7919-7926. [Crossref]
- Nunes N, Ambler G, Hoo WL, Naftalin J, Foo X et al. (2013) A prospective validation of the IOTA logistic regression models (LR1 and LR2) in comparison to subjective pattern recognition for the diagnosis of ovarian cancer. Int J Gynecol Cancer 23: 1583-1589. [Crossref]
- Van Calster B, Van Hoorde K, Valentin L, Testa AC, Fischerova D et al. (2014) Evaluating the risk of ovarian cancer before surgery using the ADNEX model to differentiate between benign, borderline, early and advanced stage invasive, and secondary metastatic tumours: prospective multicentre diagnostic study. BMJ 349: g5920. [Crossref]
- Stiekema A, Lok CA, Kenter GG, Van Driel WJ, Vincent AD et al. (2014) A predictive model combining human epididymal protein 4 andradiologic features for the diagnosis of ovarian cancer. Gynecol Oncol 132: 537-577. [Crossref]
- Van Nagell JR Jr, Hoff JT (2013) Transvaginal ultrasonography in ovarian cancer screening: current perspectives. Int J Womens Health 6: 25-33. [Crossref]