Cell Surface Lipoprotein Lipase Enzyme as A Prognostic Indicator in B-Cell Chronic Lymphocytic Leukemia
A B S T R A C T
Lipoprotein lipase (LPL) has emerged as a distinct prognostic marker for chronic lymphocytic leukemia (CLL), a heterogeneous disease with a similar heterogeneity in life expectancy. While many prior studies have focused on tumor expression of LPL mRNA, LPL surface protein expression has been less robustly studied as a prognostic marker. A novel antibody developed at Geisel School of Medicine at Dartmouth has been previously utilized in immunohistochemistry assays of breast and prostate cancer. With this study we aimed to use this antibody as a flow cytometry marker of surface LPL expression correlated with overall survival and time to first treatment. Of the 19 patients studied, our data show that LPL surface protein expression as measured by flow cytometry trended toward a protective effect on overall survival and overall better prognosis.
Keywords
Chronic lymphocytic leukemia, lipoprotein lipase, flow cytometry, prognostic marker
Introduction
Cancer cells have long been known to take advantage of lipid metabolism, with increased uptake, storage, and production of fatty acids being linked to both disease progression and carcinogenesis [1, 2]. Rapidly growing cancer cells are often competing with both the surrounding cells in the tumor microenvironment and stromal cells for oxygen and nutrients, which tends to favour upregulation of lipid metabolism and synthesis pathways [3]. A robust understanding of these metabolic pathways and the knowledge of their upregulation in cancer cells specifically has led to multiple potential therapeutic targets currently under investigation [4]. One of the most well-studied molecular targets in this pathway is fatty acid synthase (FASN), a primary enzyme used by cancer cells in de novo fatty acid synthesis that is associated with an often more aggressive, lipogenic phenotype [5-6]. In addition to lipogenesis, some malignant cells utilize lipolysis through abundant surface expression of lipoprotein lipase (LPL) [7]. While targeting these pathways have shown varying degrees of success, cancers are so variable in metabolism, growth, behaviour, and vulnerability to therapy that further studies of these agents and their effects on the pathways are warranted [8].
However, an underappreciated aspect of this metabolism lies in utilization to prognosticate disease course. Measuring these products and by-products of lipid metabolism under oxidative stress as a window into prognosis has been utilized in a variety of solid malignancies including colorectal cancer, ovarian cancer, breast cancer, and liver cancer, to name a few [8-11]. While less utilized, lipid metabolism and markers of oxidative stress have also been used to prognosticate hematologic malignancies, namely acute myeloid leukemia and chronic lymphocytic leukemia (CLL) [12-13].
CLL is a mature B-cell hematologic malignancy whose hallmark is a progressive accumulation of monoclonal B lymphocytes. While often heterogeneous in nature, this disease is able to be subdivided into 3 immunohistochemical types via flow cytometry: Those that express B-cell associated antigens (CD19, CD20, CD23, usually low CD20), those that express CD5 (classically expressed in T-cells but can also be expressed in subsets of mature B-cells), and those that express overall low levels of surface membrane immunoglobulin [14]. Overall, those malignancies expressing B-cell antigens are by far the most prevalent.
CLL clinical staging systems largely determine overall prognosis, with two historically prevalent systems still in use: the Rai system (which focuses on lymphocytosis with higher stages associated with involvement of lymph nodes, liver/spleen, and then finally with accompanying pancytopenia) and the Binet system (which focuses on 5 potential sites of involvement, where higher stages are associated with increased sites of involvement) [15, 16]. While B-cell CLL is typically an indolent disease affecting the elderly, many early stage cases of CLL often progress quickly and require alternative prognostic factors outside of the traditional staging systems to determine overall prognosis. Lymphocyte doubling time is one such marker and is determined through observation of the length of time in which the absolute lymphocyte count doubles, where a shorter doubling time marks a more aggressive disease and a longer doubling time a more indolent course [17].
CLL therapeutics have progressed where the prognosis for each stage (regardless of classification system) has improved with the advent of new therapeutic regimens and now includes molecular markers rather than just gross organ involvement [18]. One such internationally recognized modern staging system is the CLL international prognostic index (CLL-IPI) developed through a meta-analysis of 13 randomized controlled trials which combined genetic, biochemical, and clinical parameters into a prognostic model with four distinct prognostic subgroups divided by risk and significantly different overall survival at 5 years. These prognostic factors included T53 status (no abnormalities vs 17p deletion or T53 mutation or both), immunoglobulin heavy chain gene (IGHV) mutational status (mutated vs unmutated), serum β2-microglobulin concentration (≤3·5 mg/L vs >3·5 mg/L), clinical stage (Binet A or Rai 0 vs Binet B-C or Rai I-IV), and age (≤65 years vs >65 years) [19].
Flow cytometry markers can also portend a poor prognosis, specifically with markers that are strongly associated with an unmutated IGHV (a poor prognostic marker) such as CD38 and ZAP70 [20-21]. Favourable prognostic indicators are just the opposite however, with a more indolent disease course associated with lack of CD38, lack of ZAP70, and a mutated IGHV among other protective abnormalities such as the absence of p53 mutations, a CD4/CD8 ratio >1, a lack of 17p or 19p deletions, and the occurrence of a 13q14 deletion [22]. Other flow cytometry markers indicating poor outcomes are CD54, CD44, CD52, CD69, CD25, CD95, CD39, CD11c, and CD36 while CD150 predicts a more favourable course [23].
Lipoprotein lipase (LPL), a key extracellular enzyme in lipid metabolism often found in muscle or adipose tissue, is emerging as a distinct prognostic maker for chronic lymphocytic CLL [24, 25]. LPL utilizes Apoliprotein C-II (ApoC-II) as a cofactor for uptake of circulating chylomicrons for conversion to free fatty acids and is anchored to the capillary endothelium by glycosylphosphatidylinositol HDL-binding protein 1 (GPIHBP1), an association that is notably unable to occur in the presence of heparin [26]. While most studies have focused on the levels of LPL mRNA expression, LPL surface protein expression levels have not yet shown a strong correlation with prognosis.
A novel antibody developed at the Geisel School of Medicine at Dartmouth has been developed and previously utilized in immunohistochemistry assays of breast and prostate cancer [27]. We aimed to use this antibody as a flow cytometry marker of LPL expression in CLL, and correlate with overall survival and time to first treatment. CD36, another important protein in the lipoprotein pathway was also measured, along with CD38 and ZAP70 which are well established biomarkers known to portend poorer prognosis in CLL.
Methods
Kuemmerle et al. fully details the initial development of the novel antibody as follows: mice were immunized with a peptide (Sigma) representing human LPL residues 21-36 coupled to keyhole limpet haemocyanin [27]. After fusion of splenocytes to mouse multiple myeloma cells, media from candidate clones were screened for reactivity to bacterially expressed LPL in an enzyme linked immunosorbant assay. Positive clones were further screened by western blot of skeletal muscle from transgenic mice expressing a human muscle-specific LPL transgene (MCK-LPL, kindly supplied by Ira Goldberg, Columbia School of Medicine, New York, NY) and against human breast milk. Mouse tissues were homogenized in RIPA buffer containing 10 μg/ml PMSF. Samples were centrifuged at 10,000 x g for 10 min x 2. Protein content was determined using the BCA assay (Pierce). Samples were boiled in 2X sample buffer and fractionated through 15% acrylamide. Following transfer to PVDF membranes (Immobilon-FL, Millipore), blocking was with SuperBlock (Pierce). Incubation with 1:200 dilution of the primary antibody in TBS-Tween was overnight at 4° C, followed by 2 TBS washes. Recombinant protein A/G conjugated with horseradish peroxidase (Pierce) was applied for detection at 1:5000 in TBSTween for 1 hour at RT. After four TBS washes, membranes were developed with NBTBCIP (Pierce).
For this study, after obtaining informed consent a single peripheral blood sample was collected from patients with CLL in an EDTA vacutainer. PBMC were isolated using Histopaque 1078 gradient centrifugation and cells cryopreserved. Ten color flow cytometry was performed using to following antibodies: CD23 FITC (BioLegend), ZAP-70 PE (BioLegend), CD38 PE-CF594 (BD), CD5 PerCP-Cy5.5 (BioLegend), FASN PE-Cy7 (BioSS), LPL AF647 (lab-conjugated with Lightning Link (Innova Biosciences)), CD20 AF700 (BioLegend), CD19 APC-Vio770 (Miltenyi), CD36 VioBlue (Miltenyi), and a Yellow Live/Dead viability dye (Invitrogen). Cells were acquired on a Beckman-Coulter Gallios flow cytometer. In analysis, viable singlet cells were identified and then B-CLL cells identified as CD19+CD20+CD5+CD23+. Gating for LPL, CD36, and ZAP-70 positivity was determined using fluorescence minus one controls for each marker. Liposarcoma cell lines served as positive controls. The percentage of cells expressing the LPL, CD36, CD38 and ZAP70 protein were measured. Patient outcomes were retrieved by chart review. In addition, the median of each marker separated the study population into “high” and “low”-protein expression groups. Kaplan-Meier and age/stage-adjusted Cox proportional hazards regression analysis was performed for each marker to examine differences between groups.
Results
Nineteen patients were studied retrospectively. A summary of the patient demographics is presented in (Table 1). There were found to be no significant differences between groups in terms of age, sex, and Rai stage at diagnosis. At the time of blood sample collection groups did not differ in time from diagnosis, median number of prior treatments, or white blood cell count. The LPL-high surface expression group shows improved overall survival (p=0.056) (Figure 1). As expected, the ZAP70-high surface expression group showed worse survival than the ZAP70-low surface expression group. High and low CD36 and CD38 expression did not show significant differences in overall survival, likely due to the small sample size. Next, we performed an analysis of survival, accounting for subject covariates including age, sex, and Rai stage. LPL retained a significant protective association. Specifically, high LPL expression was shown to have protective effect with a hazard ratio of 0.297 when compared with the low LPL expression group after adjusting for time from diagnosis to sample collection (95% CI = 0.006 to 15.294; p=0.056). High and low CD36 and CD38 expression did not show a difference in overall survival in the multivariate analysis. Although not reaching significance, patients with high ZAP70 were nearly 3 times as likely to encounter a death event compared to low ZAP70 expression. When the analyses were repeated on the time to first treatment, no significant differences were found between the high- and low expression groups.
Table 1: Subject demographics divided by high and low LPL
expression further divided by sex, age at diagnosis, age at sample collected,
time elapsed from diagnosis to sample collection, rai stage at time of
diagnosis, medium number of treatments prior to sampling, and WBC count at
sample collection time. This allows for direction comparison of different
features of the low LPL expression and high LPL expression group.
|
LPL Strata |
||
|
High |
Low |
|
|
N |
9 |
10 |
|
Sex (%) |
||
|
Female |
5 ( 55.6) |
3 ( 30.0) |
|
Male |
4 ( 44.4) |
7 ( 70.0) |
|
Age at diagnosis (mean (SD)) |
68 (10) |
64 (7) |
|
Age at sample collect (mean (SD)) |
76 (6) |
68 (10) |
|
Time from diagnosis to sample collect (mean (SD)) |
8.33 (11.03) |
4.05 (3.76) |
|
Rai Stage at time of diagnosis (%) |
||
|
0 |
3 ( 33.3) |
5 ( 50.0) |
|
1 |
4 ( 44.4) |
3 ( 30.0) |
|
2 |
1 ( 11.1) |
2 ( 20.0) |
|
4 |
1 ( 11.1) |
0 ( 0.0) |
|
Number of treatments prior to sample (median) |
0 |
0 |
|
WBC at sample collect x10^3 (mean (SD)) |
42.1 (21.9) |
46.6 (37.0) |
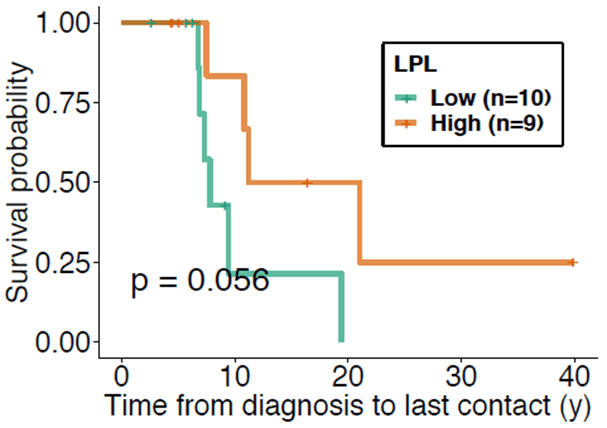
Figure 1: Kaplan-Meier curve comparing the survival probability from time of initial diagnosis to point of last contact between the high LPL (green) and low LPL (orange) expression groups. The high LPL expression group tended towards improved survivability when compared to that of the low LPL expression group and therefore a protective effect from time of initial diagnosis to point of last contact (p = 0.056).
Discussion
For more than a decade now elevated levels of LPL mRNA have been known to be associated with CLL disease courses with poorer outcomes. However, while increased levels of cytoplastic LPL mRNA would imply greater surface expression detectable by flow cytometry, this relationship is less clear [28]. Interestingly, this production of LPL mRNA appears to be restricted to CLL leukemic clones, as normal B-cells display no or very little expression of LPL mRNA [29]. Mansouri et al. found increased levels of LPL mRNA corresponding to increased surface LPL protein expression, but that this expressed LPL surface protein showed low levels of catalytic activity [30]. Rozovski et al. showed increased STAT3 transcription factor activity in CLL leading to increased activity of non-catalytic LPL and increased storage of lipids, encouraging the cell to preferentially use lipids as an energy source and therefore conferring a survival advantage [31]. To further complicate the picture, it appears that increased LPL mRNA levels are strongly correlated to those with unmutated IGHV (or Um-CLL; a poor prognostic marker) while increased surface expression is linked to a mutated IGHV (or Mut-CLL; a favourable prognostic marker) [25]. It would appear that IGHV is one of the most consequential mutations in CLL, and LPL mRNA expression has been shown in many instances to be one of the most reliable surrogate indicators of this mutational status, among others [32]. This mixed picture questions the mechanism by which surface-expressed LPL may play a role in a favourable prognosis as was found in this study.
Differences between LPL surface protein expression and LPL mRNA levels in different tumor populations may lie in the genetic expression of the LPL gene. Epigenetic analysis comparing methylation of prognostic genes in Um-CLL to Mut-CLL may also help to pinpoint their transcriptional status and expression. Abreu et al. found that cases of Um-CLL leukemic clones the LPL gene was found to be largely unmethylated and active [33]. This was later confirmed by Cahill et al. which utilized a high-resolution 450K array that revealed a hypermethylated, inactive state of LPL in both control B-cells and Mut-CLL leukemic clones, while again confirming a hypomethylated, active state was seen in Um-CLL leukemic clones [34]. Indeed LPL has been shown to be the most predictive gene when assessing IGHV mutational status as well as the most reliable prognostic marker able to be measured from the blood to date [35, 36]. However, measured serum LPL levels were found to be high regardless of IGHV mutational status [37]. CLL cases with fully methylated LPL promoter sites were shown to have a significant clinical benefit with a more indolent disease course and longer times to initial treatment [38]. Abnormal expression of LPL has also been found to be associated with other pathways such as NOTCH-1 and B-cell receptor stereotypy [39]. Ultimately, the evidence behind LPL’s genetic expression and the prognostic value of its cytoplasmic products is robust. This study would have been greatly supplemented by the measurement of LPL mRNA expression in our samples to see how LPL mRNA expression may or may not correlate with LPL surface protein expression.
As previously mentioned a less robust body of evidence is how the surface expression of the LPL protein measured by flow cytometry in CLL may impact the prognostic value of this marker. Preito et al. examined the subcellular locations of these proteins within both Um-CLL and Mut-CLL leukemic clones. This study found that Um-CLL had perinuclear LPL protein deposits, suggesting de novo production and that Mut-CLL had largely endosomal LPL protein and surface expression, suggesting uptake from an extracellular source [40]. It appears that both leukemic clones, however, were able to bind or internalize plasma LPL regardless of IGHV mutational status. It is possible our data may have undergone a sampling bias, where those CLL clones detected as having surface LPL may have also been the more indolent Mut-CLL clones. Further study may benefit from stratification by IVGH mutational status.
With consideration of catalytic activity of LPL surface protein a more complete picture would also involve investigation into the tumor expression of the essential co-factors of ApoC-II and GPIHBP1, which help to catalyze lipolysis and anchor the protein to the cell surface respectively. ApoC-II appears to have some evidence of a role in AML pathogenesis but does not appear to have been investigated in CLL [41]. Similarly, LPL protein surface protein expression may have to do with the expression of GPIHBP1 in CLL cells, the essential anchor that allows LPL to perform lipolysis [42]. While the role of this co-factor has been investigated in some solid malignancy literature it is less described in the malignant hematology literature [43]. Future investigations for this study could involve measurement of expression of either one of these cofactors to determine how functional these surface expressed LPL proteins potentially are.
CLL’s interaction with its microenvironment is largely dependent upon B-cell activation, which primarily occurs in the lymphatic tissue and leads to events such as B-cell selection, proliferation, differentiation, and production of antibodies [44]. CLL leukemic clones also secrete multiple cytokines upon activation that recruit cells from the surrounding parenchyma, that subsequently cross-talk with these recruited cells, the factors of which have been an avenue of research for future therapeutics [45]. This cross-talk ultimately favours disease progression and emergence of new heterogenous genetic alterations, leading to the diseases acquired drug resistance [46]. Interestingly, one of the known BCR associated downstream activated genes is LPL, and is largely associated with increased BCR activation in leukemic clones [47]. The LPL protein has also been shown to play a non-catalytic role in adhesion between cells, possibly also contributing to microenvironment communication [48]. Interestingly, the IGHV status of the disease is intimately tied to the B-cell receptor, as it composes the majority of the receptor’s structure. It may be the case that unmutated IGHV may interact more homogenously with the tumor microenvironment and may subsequent lead to clonal expansion, while those with a more heterogeneous mutated IGHV may not show the whole disease activation and progression displayed in the unmutated subtype and may display a more indolent course.
While much of the research surrounding CLL is concerned with identification of novel molecular targets for drug development, interestingly there is some evidence that the current main-line therapies work to inhibit fatty acid metabolism. Often this disease is observed rather than treated, and when treated has been shown to respond to a variety of agents, which are often selected after extensive risk stratification. Ibrutinib is one such agent, and monotherapy regimens have been found to be a superior in older previously untreated individuals when compared to other chemotherapies [49]. Ibrutinib is primarily a Bruton’s tyrosine kinase (BTK) inhibitor, but has also been shown to decrease fatty acid metabolism through downregulation of LPL in CLL cells [50].
This study was ultimately limited by its small sample size and statistical analysis that was close but did not quite reach a level of significance (p=0.056) to determine if there was a significant difference between the LPL surface expression groups and survivability. Further analysis of LPL mRNA expression may have further assisted in drawing correlation between cytoplasmic mRNA expression and resulting cell surface protein expression. Additionally analysis of co-factor expression of Apo-C-II and GPIHBP1 in malignant cells may also identify catalytic ability of these expressed LPL proteins. Future studies may consider broadening the sample size, measuring cytoplasmic mRNA levels, correlating this to the results of measurement of CD36, CD38, LPL, and ZAP70 surface expression, and further stratifying by survivability to get a more robust picture of surface protein expression and CLL prognosis.
Conclusion
Our data show that LPL protein surface expression as measured by flow cytometry using a novel antibody trended toward a protective effect on overall survival. LPL protein surface expression is not well characterized in the context of CLL patient outcomes and the function of LPL in CLL is not well understood. A growing body of evidence suggests LPL plays a key role in cancer cell metabolism by providing fatty acids as a critical energy source; and thus inhibition of LPL is under investigation as a targeted therapy. LPL protein surface expression regulation is a complex process that may be governed by processes other than de novo synthesis, and thus may not correlate with mRNA expression. Future work to understand the mechanism of synthesis, surface expression, and function of LPL is warranted in order to guide future development of targeted therapies in CLL.
Article Info
Article Type
Research ArticlePublication history
Received: Thu 23, Feb 2023Accepted: Thu 11, May 2023
Published: Wed 14, Jun 2023
Copyright
© 2023 Caleb J. Yelton. This is an open-access article distributed under the terms of the Creative Commons Attribution License, which permits unrestricted use, distribution, and reproduction in any medium, provided the original author and source are credited. Hosting by Science Repository.DOI: 10.31487/j.ACO.2023.01.02
Figures & Tables
Table 1: Subject demographics divided by high and low LPL
expression further divided by sex, age at diagnosis, age at sample collected,
time elapsed from diagnosis to sample collection, rai stage at time of
diagnosis, medium number of treatments prior to sampling, and WBC count at
sample collection time. This allows for direction comparison of different
features of the low LPL expression and high LPL expression group.
|
LPL Strata |
||
|
High |
Low |
|
|
N |
9 |
10 |
|
Sex (%) |
||
|
Female |
5 ( 55.6) |
3 ( 30.0) |
|
Male |
4 ( 44.4) |
7 ( 70.0) |
|
Age at diagnosis (mean (SD)) |
68 (10) |
64 (7) |
|
Age at sample collect (mean (SD)) |
76 (6) |
68 (10) |
|
Time from diagnosis to sample collect (mean (SD)) |
8.33 (11.03) |
4.05 (3.76) |
|
Rai Stage at time of diagnosis (%) |
||
|
0 |
3 ( 33.3) |
5 ( 50.0) |
|
1 |
4 ( 44.4) |
3 ( 30.0) |
|
2 |
1 ( 11.1) |
2 ( 20.0) |
|
4 |
1 ( 11.1) |
0 ( 0.0) |
|
Number of treatments prior to sample (median) |
0 |
0 |
|
WBC at sample collect x10^3 (mean (SD)) |
42.1 (21.9) |
46.6 (37.0) |
References
1. Röhrig F, Schulze A
(2016) The multifaceted roles of fatty acid synthesis in cancer. Nat Rev
Cancer 16: 732-749. [Crossref]
2. Long J, Zhang CJ,
Zhu N, Du K, Y YF et al. (2018) Lipid metabolism and carcinogenesis, cancer
development. Am J Cancer Res 8: 778-791. [Crossref]
3. Munir R, Lisec J,
Swinnen JV, Zaidi N (2019) Lipid metabolism in cancer cells under metabolic
stress. Br J Cancer 120: 1090-1098. [Crossref]
4. Cheng C, Geng F,
Cheng X, Guo D (2018) Lipid metabolism reprogramming and its potential targets
in cancer. Cancer Commun (Lond) 38: 27. [Crossref]
5. Kuhajda FP (2000)
Fatty-acid synthase and human cancer: New perspectives on its role in tumor
biology. Nutrition 16: 202-208. [Crossref]
6. Menendez JA, Lupu R
(2007) Fatty acid synthase and the lipogenic phenotype in cancer pathogenesis. Nat
Rev Cancer 7: 763-777. [Crossref]
7. Zaidi N, Lupien L,
Kuemmerle NB, Kinlaw WB, Swinnen JV et al. (2013) Lipogenesis and lipolysis:
The pathways exploited by the cancer cells to acquire fatty acids. Prog
Lipid Res 52: 585-589. [Crossref]
8. Cha JY, Lee HJ
(2016) Targeting Lipid Metabolic Reprogramming as Anticancer Therapeutics. J
Cancer Prev 21: 209-215. [Crossref]
9. Zhao G, Cardenas H,
Matei D (2019) Ovarian cancer-why lipids matter. Cancers (Basel) 11:
1870. [Crossref]
10. Lee JD, Cai Q, Shu
XO, Nechuta SJ (2017) The Role of Biomarkers of Oxidative Stress in Breast
Cancer Risk and Prognosis: A Systematic Review of the Epidemiologic Literature.
J Womens Health 26: 467-482. [Crossref]
11. Hu B, Lin JZ, Yang
XB, Sang XT (2020) Aberrant lipid metabolism in hepatocellular carcinoma cells
as well as immune microenvironment: A review. Cell Prolif 53: e12772. [Crossref]
12. Loew A, Köhnke T, Rehbeil
E, Pietzner A, Weylandt KH (2019) A Role for Lipid Mediators in Acute Myeloid
Leukemia. Int J Mol Sci 20: 2425. [Crossref]
13. Rozovski U, Hazan
Halevy I, Barzilai M, Keating MJ, Estrov Z (2016) Metabolism pathways in
chronic lymphocytic leukemia. Leuk Lymphoma 57: 758-765. [Crossref]
14. Hallek M, Cheson
BD, Catovsky D, Caligaris Cappio F, Dighiero G et al. (2018) iwCLL guidelines
for diagnosis, indications for treatment, response assessment, and supportive
management of CLL. Blood 131: 2745-2760. [Crossref]
15. Rai KR, Sawitsky A,
Cronkite EP, Chanana AD, Levy RN et al. (1975) Clinical staging of chronic
lymphocytic leukemia. Blood 46: 219-234. [Crossref]
16. Binet JL, Auquier
A, Dighiero G, Chastang C, Piguet H et al. (1981) A new prognostic
classification of chronic lymphocytic leukemia derived from a multivariate
survival analysis. Cancer 48: 198-206. [Crossref]
17. Molica S, Alberti A
(1987) Prognostic value of the lymphocyte doubling time in chronic lymphocytic
leukemia. Cancer. 60: 2712-2716. [Crossref]
18. Pflug N, Bahlo J,
Shanafelt TD, Eichhorst BF, Bergmann MA et al. (2014) Development of a comprehensive
prognostic index for patients with chronic lymphocytic leukemia. Blood
124: 49-62. [Crossref]
19. International
CLL-IPI working group (2016) An international prognostic index for patients
with chronic lymphocytic leukaemia (CLL-IPI): a meta-analysis of individual
patient data. Lancet Oncol 17: 779-790. [Crossref]
20. Ghia P, Guida G,
Stella S, Gottardi D, Geuna M et al. (2003) The pattern of CD38 expression
defines a distinct subset of chronic lymphocytic leukemia (CLL) patients at
risk of disease progression. Blood 101: 1262-1269. [Crossref]
21. Rassenti LZ, Jain
S, Keating MJ, Wierda WG, Grever MR et al. (2008) Relative value of ZAP-70,
CD38, and immunoglobulin mutation status in predicting aggressive disease in
chronic lymphocytic leukemia. Blood 112: 1923-1930. [Crossref]
22. Guarini A, Gaidano
G, Mauro FR, Capello D, Mancini F et al. (2003) Chronic lymphocytic leukemia
patients with highly stable and indolent disease show distinctive phenotypic
and genotypic features. Blood 102: 1035-1041. [Crossref]
23. Vosoughi T, Bagheri
M, Hosseinzadeh M, Ehsanpour A, Davari N et al. (2019) CD markers variations in
chronic lymphocytic leukemia: New insights into prognosis. J Cell Physiol
234: 19420-19439. [Crossref]
24. Rombout A,
Verhasselt B, Philippé J (2016) Lipoprotein lipase in chronic lymphocytic
leukemia: function and prognostic implications. Eur J Haematol 97:
409-415. [Crossref]
25. Prieto D, Oppezzo P
(2017) Lipoprotein lipase expression in chronic lymphocytic leukemia: New
insights into leukemic progression. Molecules 22: 1-9. [Crossref]
26. Beigneux AP, Gin P,
Davies BSJ, Weinstein MM, Bensadoun A et al. (2009) Highly conserved cysteines
within the Ly6 domain of GPIHBP1 are crucial for the binding of lipoprotein
lipase. Journal of Biological Chemistry 284: 30240-30247. [Crossref]
27. Kuemmerle NB,
Rysman E, Lombardo PS, Flanagan AJ, Lipe BC et al. (2011) Lipoprotein lipase
links dietary fat to solid tumor cell proliferation. Mol Cancer Ther 10:
427-436. [Crossref]
28. Heintel D, Kienle
D, Shehata M, Kröber A, Kroemer E et al. (2005) High expression of lipoprotein
lipase in poor risk B-cell chronic lymphocytic leukemia. Leukemia
19(7):1216-1223. [Crossref]
29. Oppezzo P,
Vasconcelos Y, Settegrana C, Jeannel D, Vuillier F et al. (2005) The LPL/ADAM29
expression ratio is a novel prognosis indicator in chronic lymphocytic
leukemia. Blood 106: 650-657. [Crossref]
30. Mansouri M, Sevov
M, Fahlgren E, Tobin G, Jondal M et al. (2010) Lipoprotein lipase is differentially
expressed in prognostic subsets of chronic lymphocytic leukemia but displays
invariably low catalytical activity. Leuk Res 34: 301-306. [Crossref]
31. Rozovski U,
Grgurevic S, Bueso Ramos C, Harris DM, Li P et al. (2015) Aberrant LPL
Expression, Driven by STAT3, Mediates Free Fatty Acid Metabolism in CLL Cells. Mol
Cancer Res 13: 944-953. [Crossref]
32. Plesingerova H,
Librova Z, Plevova K, Libra A, Tichy B et al. (2017) COBLL1, LPL and ZAP70
expression defines prognostic subgroups of chronic lymphocytic leukemia
patients with high accuracy and correlates with IGHV mutational status. Leuk
Lymphoma 58: 70-79. [Crossref]
33. Abreu C, Moreno P,
Palacios F, Borge M, Morande P et al. (2013) Methylation status regulates
lipoprotein lipase expression in chronic lymphocytic leukemia. Leuk Lymphoma
54: 1844-1848. [Crossref]
34. Cahill N, Bergh AC,
Kanduri M, Göransson Kultima H, Mansouri L et al. (2013) 450K-array analysis of
chronic lymphocytic leukemia cells reveals global DNA methylation to be
relatively stable over time and similar in resting and proliferative
compartments. Leukemia 27: 150-158. [Crossref]
35. Fernández Martínez
JL, deAndrés Galiana EJ, Sonis ST (2017) Genomic data integration in chronic
lymphocytic leukemia. Journal of Gene Medicine 19. [Crossref]
36. Rosenquist R,
Cortese D, Bhoi S, Mansouri L, Gunnarsson R (2013) Prognostic markers and their
clinical applicability in chronic lymphocytic leukemia: Where do we stand? Leuk
Lymphoma 54: 2351-2364. [Crossref]
37. Porpaczy E, Tauber
S, Bilban M, Kostner G, Gruber M et al. (2013) Lipoprotein lipase in chronic
lymphocytic leukaemia - Strong biomarker with lack of functional significance. Leuk
Res 37: 631-636. [Crossref]
38. Daugaard I,
Hussmann D, Kristensen L, Kristensen T. Kjeldsen TE et al. (2018) Chronic
lymphocytic leukemia patients with heterogeneously or fully methylated LPL
promotor display longer time to treatment. Epigenomics 10: 1155-1166. [Crossref]
39. Bilous N, Abramenko
I, Chumak A, Dyagil I, Martina Z (2019) Analysis of LPL gene expression in
patients with chronic lymphocytic leukemia. Exp Oncol 41: 39-45. [Crossref]
40. Prieto D, Seija N,
Uriepero A, Souto Padron T, Oliver C et al. (2018) LPL protein in Chronic
Lymphocytic Leukaemia have different origins in Mutated and Unmutated patients.
Advances for a new prognostic marker in CLL. Br J Haematol 182: 521-525.
[Crossref]
41. Zhang T, Yang J,
Vaikari VP, Beckford, Wu S et al. (2020) Apolipoprotein C2 - CD36 Promotes
Leukemia Growth and Presents a Targetable Axis in Acute Myeloid Leukemia. Blood
Cancer Discov 1: 198-213. [Crossref]
42. Young SG, Fong LG,
Beigneux AP, Allan CM, He C et al. (2019) GPIHBP1 and Lipoprotein Lipase,
Partners in Plasma Triglyceride Metabolism. Cell Metab 30: 51-65. [Crossref]
43. Hu X, Matsumoto K,
Jung RS, Weston TA, Heizer PJ et al. (2019) GPIHBP1 expression in gliomas
promotes utilization of lipoprotein-derived nutrients. ELife 8: e47178 [Crossref]
44. Rombout A, Lust S,
Offner F, Naessens E, Verhasselt B et al. (2016) Mimicking the tumour
microenvironment of chronic lymphocytic leukaemia in vitro critically depends
on the type of B-cell receptor stimulation. Br J Cancer 114: 704-712. [Crossref]
45. Burger JA, Gribben
JG (2014) The microenvironment in chronic lymphocytic leukemia (CLL) and other
B cell malignancies: insight into disease biology and new targeted therapies. Semin
Cancer Biol 24: 71-81. [Crossref]
46. Burger JA, Ghia P,
Rosenwald A, Caligaris Cappio F (2009) The microenvironment in mature B-cell
malignancies: A target for new treatment strategies. Blood 114:
3367-3375. [Crossref]
47. Herishanu Y, Pérez
Galán P, Liu D, Biancotto A, Pittaluga S et al. (2011) The lymph node
microenvironment promotes B-cell receptor signaling, NF-κB activation, and
tumor proliferation in chronic lymphocytic leukemia. Blood 117: 563-574.
[Crossref]
48. Mead JR, Irvine SA,
Ramji DP (2002) Lipoprotein lipase: Structure, function, regulation, and role
in disease. J Mol Med 80: 753-769. [Crossref]
49. Woyach JA, Ruppert AS, Heerema NA, Zhao W, Booth AM et al. (2018) Ibrutinib regimens versus chemoimmunotherapy in older patients with untreated CLL. N Engl J Med 379: 2517-2528. [Crossref]
50. Rozovski U, Harris DM, Li P, Liu Z, Jain P et al. (2018) Ibrutinib inhibits free fatty acid metabolism in chronic lymphocytic leukemia. Leuk Lymphoma 59: 2686-2691. [Crossref]