Assessment of Oral Function and Food Product Preference in Patients with Head and Neck Cancers
A B S T R A C T
Introduction: Taste and olfactory changes begin within days of initiating chemotherapy and radiation therapy for head and neck cancers (HNC) and may persist 12 months or longer post-treatment, affecting 50 to 75% of adults with HNC. In this study, we assess taste function and diet in addition to food product evaluation among patients with HNC.
Methods: Ten patients with HNC were evaluated during (n=6) and following radiation therapy with/without chemotherapy (n=8). Oral examination measures included oral hygiene and whole saliva. Patients also completed the Scale of Subjective Total Taste Acuity (STTA), National Cancer Institute Diet History Questionnaire II (DHQII) and Vanderbilt Head and Neck Symptom survey (VHNSS) and evaluated Hormel Vital CuisineTM Products.
Results: Taste changes were more pronounced in the acute treatment phase (60% moderate to severe loss) than in the post-treatment phase (50% no taste change and no severe taste loss). Half of the patients reported poor appetite during the study, although patients reported they were able to complete 75% of the Hormel Vital Cuisine meal during one sitting. More than 70% of these meals were rated favourably with no after-taste or burning sensation.
Conclusion: Considerations in meal preparation and food products during and following HNC therapy should recognize oral and taste changes from the acute treatment phase to survivorship. Differences are seen in oropharyngeal function and pain, saliva function and taste/flavor recognition.
Implications: This exploratory study provides insight for diet and food product development for patients with HNC during and following treatment. Further research with a larger sample is needed to develop guidelines for product development.
Keywords
Oral and pharyngeal function, taste, diet, nutrition, head and cancer therapy
Introduction
Oral and oropharyngeal toxicity of radiation and/or chemotherapy in adults with head and neck cancer (HNC) include mucositis, sensory changes (pain, taste, smell), and changes in saliva quantity and quality [1]. In patients with HNC, treatment-related effects including oral pain, taste and texture perception of foods and beverages may impact appetite and ability to eat and drink, which may, in turn, contribute to changes in diet [2-6]. Taste and olfactory changes begin within days of initiating cancer treatments and may persist 12 months or longer post-treatment, affecting 50 to 75% of adults receiving chemotherapy (CT) and radiation therapy (RT) for HNC [2-4]. Diet and nutrition are critical for recovery, health maintenance and tissue repair, and quality of life which support the need to study oral function and food preferences in oncology care in patients with HNC a continuing priority. Flavor, which is a combination of smell, taste, temperature, texture and food hedonics, is an important determinant of food acceptance and diet [7]. The eating experience is an interconnected and multidimensional activity that influences nutrition, identity, social interaction and quality of life [8-15]. Research exploring taste alterations and eating in patients with HNC has primarily been limited to patient report with limited attention to the oral condition and function and dietary adaptations in food and fluid consumption [2, 5, 12, 16-18]. Additionally, the impact of oral conditions on dietary product development for patients with HNC has not been evaluated. The aim of this study was to assess the acceptance of food products developed for patients and survivors of HNC in an effort to explore the relation of oral condition, taste and smell function, diet and product development for patients during and following HNC treatment.
Methods
Patients were enrolled during treatment (4-6 weeks after starting treatment) and after completing cancer treatment as previously described [19]. Adults with HNC, scheduled to receive or who had been treated with radiation therapy with/without platinum-based CT chemotherapy up to 24 months post treatment were eligible. Western Institutional Review Board (WIRB, Puyallup, WA; IRB # 20172768) approved consents were completed by all patients. As part of a broader study, all enrolled patients (n =10) received a standard oral examination at each visit that included mucositis score, plaque and gingivitis index, saliva (whole resting saliva [WRS] and whole stimulated saliva [WSS] collections), and taste and smell testing [19]. Patients self-completed the Scale of Subjective Total Taste Acuity (STTA), National Cancer Institute Diet History Questionnaire II (DHQII), which evaluates food consumption [1, 20]. The Vanderbilt Head and Neck Symptom survey (VHNSS) to assess taste changes during and after treatment [21].
Product Evaluation
Patients were provided Hormel Vital CuisineTM Meal and shake products for evaluation after each visit. These products are currently available in the marketplace and were developed to be convenient and provide nutritional support. The nutrient compositions of products are shown in (Table 1).
Table 1: Test product food nutrition facts: meals and shake product (Hormel Foods, Inc).
|
|
NUTRITION FACTS (% DAILY VALUE) BY PRODUCT |
|||
|
Beef & Mushroom* |
Chicken & Dumplings* |
Vegetarian Stew* |
Shake** |
|
|
Calories |
350 (18) |
300 (15) |
330 (17) |
520 (26) |
|
Total Fat, gm |
22 (34) |
16 (25) |
17 (22) |
21 (27) |
|
Saturated Fat, gm |
6 (30) |
2 (10) |
2 (10) |
(--) |
|
Trans fat, gm |
0 (0) |
0 (0) |
0 (0) |
0 (0) |
|
Polyunsaturated Fat, gm |
2 (--) |
2 (--) |
2 (--) |
0 (0) |
|
Monounsaturated Fat, gm |
14 (--) |
10 (--) |
11 (--) |
0 (0) |
|
Cholesterol, mg |
40 (13) |
75 (25) |
0 (0) |
30 (10) |
|
Sodium, mg |
500 (21) |
590 (25) |
670 (29) |
380 (17) |
|
Total Carbohydrate, gm |
21 (7) |
17 (6) |
32 (12) |
60 (2) |
|
Dietary Fiber, gm |
4 (16) |
2 (8) |
5 (18) |
0 (0) |
|
Protein, gm |
16 (30) |
23 (42) |
11 (20) |
22 (44) |
|
Total Sugars, gm |
2 (--) |
2 (--) |
3 (--) |
27 (--) |
|
Calcium, mg |
26 (2) |
26 (2) |
26 (2) |
650 (50) |
|
Potassium, mg |
440 (9) |
230 (5) |
470 (10) |
380 (8) |
|
Iron, mg |
1 (1) |
0.5 (4) |
1 (8) |
1 (4) |
|
Magnesium, mg |
42 (10) |
25 (6) |
63 (15) |
0 (0) |
|
Zinc, mg |
1.9 (19) |
0.5 (5) |
1.1 (10) |
0 (0) |
|
Copper, mg |
0.09 (10) |
0.04 (4) |
0.01 (1) |
0 (0) |
|
Phosphorus, mg |
263 (21) |
175 (14) |
188 (15) |
0 (0) |
|
Vitamin D, mcg |
0 (0) |
0 (0) |
0 (0) |
0 (0) |
|
Vitamin A, mcg |
0 (0) |
130 (15) |
270 (30) |
20 (2) |
|
Vitamin C, mg |
0 (0) |
0 (0) |
0 (0) |
0 (0) |
|
Vitamin K, mcg |
0 (0) |
0 (0) |
17 (14) |
0 (0) |
|
Vitamin B6, mg |
0.1 (7) |
0.09 (5) |
0.2 (11) |
(--) |
|
Vitamin B12, mcg |
0.5 (22) |
0.1 (4) |
1.0 (43) |
(--) |
% Daily Value based on FDA recommendations for a 2000 calorie per day, adult diet. Blank cells (--) represent data not available.
*Meal Package size: *213 gm; ** Shake size: 250 ml
Patients were provided a package of 4 meals (vegetarian, beef and/or chicken) eaten for one meal and 2 shake flavors (chocolate and vanilla) after each study visit for trial at home. After the use of each product, patients were asked to complete a paper product evaluation form assessing their experience and preference. Four patients participated in the product evaluation (three during post-treatment) and returned the reports of their experience.
Statistics
Descriptive statistics are presented as counts and percentages for dichotomous and categorical variables and as percentages of change for continuous variables (change from prior to the visit and at the visit).
Results
Ten patients completed the study and provided data in either the treatment phase, the post-treatment phase or during both phases. The data collected during treatment were defined as the acute treatment group (n = 6), and the data collected after treatment were defined as the post-treatment group (n = 8; four patients were evaluated during and after treatment, four patients were evaluated after treatment only and two patients were included during treatment). All patients received IMRT and 9 combined RT and platinum-based CT. All patients were dentate, and none had removable dental prostheses. Tobacco and supplement use are presented in (Table 2). Patient characteristics are shown in (Table 2) (n=10) and the subset of the patients in the study who completed the product evaluation (n=4; one during and three after treatment).
Table 2: Study patients characteristics.
|
|
All subjects (n = 10) |
All subjects Percentage |
Product Evaluation Subjects* (n= 4) |
Product Evaluation Percentage |
|
|
Gender |
Male |
7 |
70 |
3 |
75 |
|
|
Female |
3 |
30 |
1 |
25 |
|
Age (years) |
|
59.9 (mean) |
6.97 (SD) |
60 (mean) |
4.18 (SD) |
|
Ethnicity |
Caucasian |
8 |
80 |
3 |
75 |
|
|
Hispanic |
1 |
10 |
0 |
0 |
|
|
Asian |
1 |
10 |
1 |
25 |
|
Smoker |
Current or former |
3 |
30 |
1 |
25 |
|
Vitamin/ Mineral Use |
(yes) |
4 |
40 |
1 |
25 |
|
Cancer Location |
SCC Tonsil p16 positive |
6 |
60 |
3 |
75 |
|
|
Base of Tongue p16 positive |
3 |
30 |
1 |
25 |
|
|
Oral Tongue p16 positive |
1 |
10 |
0 |
0 |
Product Evaluation subjects are a subset of “all” subjects. Ten subjects completed the study (6 during treatment and 8 after treatment with four of these during and after treatment); 4 of these patients completed the product evaluation (one during and three after treatment).
All patients maintained good plaque control and presented low gingival inflammation during and after treatment (Table 3). In the acute group, the mucositis ulcer score and total mucositis score increased during treatment (x = 0.86±0.37 and 2.1±0.45, respectively); ulcerations were fully resolved in all patients by the post-treatment visits (x = 0.0±0.0). WRS increased after treatment (acute x = 1.54±1.76, post-treatment x = 5.27±11.32) while WSS decreased slightly (acute x = 3.19±3.56, post-treatment x = 2.64±2.13) (Table 3). Patients taking pain medications at the initial visit (n= 4) had higher mucositis ulcer scores than those who were not taking pain medications (x=0.84+0.19 and 0.31±0.60, respectively) as well as total mucositis scores (x = 2.07±0.60 and 0.94+1.07, respectively). WRS and WSS were higher for patients taking pain medication (x=1.80±2.40 and 4.48±4.30) than those who were not (x=0.76±0.73 and 1.26±1.13).
Table 3: Patients’ clinical oral condition and saliva production by treatment group and by those taking and not taking pain medication.
|
|
Acute Group (n = 6) |
Post-Treatment Group (n = 8) |
|
Taking Pain Medication (n =4) |
Not Taking Pain Medication (n =6) |
|
Plaque Index |
0.37±0.54 |
0.41±0.45 |
0.43±0.72 |
0.31±0.37 |
|
|
Gingival Index |
0.34±0.43 |
0.45±0.38 |
0.34±0.53 |
0.52±0.49 |
|
|
Mucositis Ulcer Score |
0.86±0.37 |
0.0±0.0 |
0.84+0.19 |
0.31±0.60 |
|
|
Total Mucositis score |
2.1±0.45 |
0.31±0.43 |
2.07±0.60 |
0.94+1.07 |
|
|
Saliva WRS |
1.54±1.76 |
5.27±11.32 |
1.80±2.40 |
0.76±0.73 |
|
|
Saliva WSS |
3.19±3.56 |
2.64±2.13 |
4.48±4.30 |
1.26±1.13 |
Ten subjects completed the study (six during treatment and eight after treatment with four of these during and after treatment).
Taste changes were more pronounced in the acute group than in the post-treatment group (Figure 1). All patients in the acute group experienced taste change: 50% reported altered taste, 20% moderate loss of taste, and 40% graded taste loss as severe. In contrast, 50% of the post treatment group reported no change, and there were no reports of severe taste loss in this group. Six of the patients also completed the DHQII about specific foods they had eaten, with one completed during and five completed after treatment. When reporting on eating habits within the last 12 months, half of these patients reported never eating high fat foods such as cheeseburgers/fast food, hot dogs or steak and never adding butter or cheese to vegetables. Most of the patients (83%) reported weekly consumption of fruits and vegetables. Commercial meal replacement use was reported by 67% of patients.
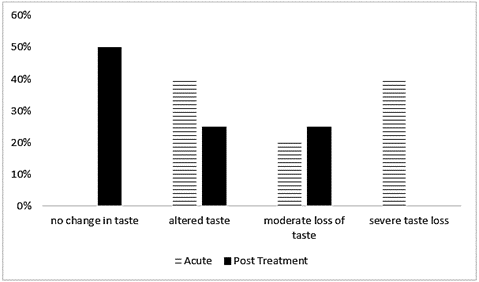
Figure 1: Reported taste changes (STTA) by treatment group. Percentage of patients from the total sample (n=10) who reported either no taste change or some level of taste change, as measured by the Scale of Subjective Total Taste Acuity (STTA), per treatment group.
Product Evaluation
Eleven meals were evaluated by four patients (one in the acute treatment phase and three in the post-treatment phase), with one meal product used at different meals (Table 4). Meals were combined for analysis due to the small sample size. Most of the meals (82%) were reported as an appropriate portion size, and 73% of the meals were at least half completed with 67% of meals mostly completed (≥ 75% of meal completed). At the time of rating the meals, 50% reported their current appetite as “good” 25% as “poor” and 25% as “very poor”, representing a decrease from their reported appetites prior to treatment (100% represented as “very good”). Also, at the time of rating the meals, one patient (25%) reported no taste change, and the other three (75%) reported mild taste change.
Table 4: Study patients’ product evaluation.
|
|
Favourable N (%) |
Not Favourable N (%) |
No response N (%) |
|
Portion Size |
9 (82%) |
2 (18%) |
0 (0%) |
|
Taste met expectations* |
8 (73%) |
2 (18%) |
0 (0%) |
|
Product Taste |
7 (64%) |
4 (36%) |
0 (0%) |
|
After-taste lingering in mouth** |
8 (73%) |
2 (18%) |
1 (9%) |
|
Salty Flavor of Meal |
10 (91%) |
1 (9%) |
0 (0%) |
|
Sweet Flavor of Meal |
11 (100%) |
0 (0%) |
0 (0%) |
|
Sour Flavor of Meal |
11 (100%) |
0 (0%) |
0 (0%) |
|
Bitter Flavor of Meal |
11 (100%) |
0 (0%) |
0 (0%) |
|
Burning Sensation** |
9 (82%) |
1 (9%) |
1 (9%) |
|
Meal fully heated per instructions |
8 (73%) |
2 (18%) |
1 (9%) |
|
Meal Temperature |
9 (82%) |
1 (9%) |
1 (9%) |
Four patients evaluated 11 products.
Table Note* One rating (9%) was neutral.
Table Note** An evaluation of ‘none’ is considered favourable for lingering after-taste and burning sensation.
Overall, meals were rated favourably, with 73% of the meals rated as close to or meeting expectations. Meal taste was reported as good or satisfactory for 64%, and no after-taste was reported for 73% of meals despite 75% of the tasters reporting taste changes on the STTA during and after treatment. The majority of ratings were favourable for salty flavor (91%), sweet flavor (100%), sour flavor (100%) and bitter flavor (100%). No burning sensation was reported for 82% of meals. Following product instructions resulted in a fully hot meal for 73% of the rated meals, with only one meal rated as too cold after heating per instructions (9%). Despite the favourable ratings for the specific aspects of the food, 46% of meals were rated as ‘would eat again’, and 46% were rated as ‘would not eat again’. However, 55% of meals were rated as ‘would recommend’, and there was agreement between eating again and recommending for 91% of the meals.
Discussion
This exploratory study assessed oral changes and their impact on diet and food product evaluation in adults with HNC during and following treatment. Subjects were provided with product samples per protocol and completed evaluations of meals and liquid shakes. Overall, the subject reports were positive in the product trial. Product evaluation was grouped into stew (vegetarian), meal (beef, chicken and vegetarian) and shake for the analysis. The portion size was generally reported as good, reflecting suggestions for frequent/small meals and potentially reduced appetite reported by patients. In addition, the convenience of preparation in the context of frequent meals and fatigue may be of importance, and convenience of use of the product was noted by participants. The overall taste was reported good/satisfactory for the meal, but variable for some with poor taste or too little taste described for stew. The taste qualities of the products tested, including sweet, salt, bitter and sour were reported to be satisfactory. Meal preparation required only microwave and were reported as convenient.
A 2018 study of 43 patients with breast cancer (BC) receiving multiple chemotherapy protocols assessed salt, sour, sweet, bitter taste and electrogustometry [22]. Mucositis was present in 16% of those on chemotherapy, of which approximately half correctly identified the tastes tested, although the intensity was not described. The findings in this study suggest that patient-reported outcome (PRO) alone is not sufficient to assess taste function in patients at risk with cancer. In the current study, while the products provided were high in sodium, the majority of participants reported no salty taste or adequate salt taste with only one report identifying salty taste as too salty. Sweet taste was acceptable, with no reports of excessive sweet taste. Sour and bitter were not reported excessive for any product tested. The texture of shake was reported as too thick by half of responders which was developed with the goal of increased energy and nutrient content. The texture of meals and stew was reported as good. After-taste was reported in one individual who noted this in the meal and stew tested.
Evaluation of consumption of the entrée was variable, with one subject reporting difficulty chewing and swallowing while others reported no difficulty. Overall, the burning sensation with eating was not present with trial products, although one subject did report burning with eating the stew at 11 months post-treatment. The temperature of the product when eaten was reported as good in subjects following cancer treatment. Overall assessment of the product as assessed by the willingness to use again was affirmed by the majority of those reporting consuming a meal but split for the stew product. Food sticking in the mouth and food sticking in the throat and choking were more commonly reported during HNC cancer therapy, likely due to hyposalivation and mucositis, and food sticking in the mouth of survivors should be considered in dietary advice and product development [23]. Food sticking in the mouth was more common following treatment, likely related to reduced saliva production post-treatment. Taste acuity such as saliva quantity and quality (texture) likely has a considerable impact on dietary choices and intake.
Even though more than half of all patients reported eating a whole meal or more to feel full, most patients noted a decrease in appetite during treatment and needed longer or a much longer time to consume a meal [23]. Additionally, most patients reported that eating was pleasurable prior to treatment but was unpleasant or very unpleasant due to no taste, pain or difficulty swallowing during and after treatment, with 67% reporting severe taste changes. Patients reported the spicy perception of capsaicin and bitter perception as particularly problematic when eating during and after treatment; however, umami (savory), sweet, metallic and fat tastes were only impacted during treatment. As noted in (Table 4), the bitter and spicy flavor perception of the products were favourable, as were salty, sweet and sour flavor perceptions. These findings from all subjects suggest taste recovery may occur following HNC therapy and that changes occur over time from treatment start to survivorship and may need to be considered in diet/product development.
Considerations in food product development for individuals to consume during and following cancer therapy should include recognizing potential acute toxicities and chronic toxicities in survivors that occur throughout the cancer trajectory as well as energy and nutrient needs. Texture and thickness of food are factors that affect consumption, swallowing and choking/aspiration also change across the cancer continuum. Oral mucositis and related mucosal pain are commonly thought of as acute complications, but mucosal pain and sensitivity continue in many patients and may be associated with sensitivity to spicy food in survivors. Our study shows that saliva volume and function is different during and following cancer treatment and should be considered in product development, potentially with different product choices for patients during and following cancer therapy. The adults with HNC in this study who participated in the product trial had relatively limited hyposalivation and maintained excellent oral hygiene-with a highly motivated and compliant patient pool which likely does not reflect the general HNC population, where oral hygiene, gingivitis, plaque levels, tobacco use, dental health may be compromised.
For prepared meals, considerations include ease of preparation, portion size, shelf life, cost and availability, in addition to the general considerations for oral status, energy and nutrient density for food and diet. These considerations were reported as good for products tested. Limitations of this report include the small sample size, lack of generalizability and limited subject compliance with product trial, as discussed below. The oral status of these patients, including plaque control, gingivitis, and saliva, were little changed throughout treatment and follow-up, although mucositis was present during treatment and resolved at follow-up. The excellent oral hygiene, as reflected in plaque and gingivitis scores in these subjects, may be due to good dental health at study entry plus the impact of the study protocol reinforcing oral hygiene that may not reflect that of the general HNC population, where the oral status and oral care may impact diet. The survey tools used in this study were extensive and required patient effort and time to complete. Subject compliance with report back on product trial was limited and provided guidance for future product evaluation. Patient fatigue and patient study survey fatigue are important considerations in the design of future trials. This exploratory study suggests considerations for diet and food product development across the cancer continuum in HNC and has implications for the care of oncology patients in general.
Acknowledgements
We gratefully acknowledge funding provided by the Cancer Nutrition Consortium, and Hormel Foods Inc.
Conflicts of Interest
None.
Article Info
Article Type
Research ArticlePublication history
Received: Mon 09, Nov 2020Accepted: Wed 25, Nov 2020
Published: Mon 07, Dec 2020
Copyright
© 2023 Joel B. Epstein . This is an open-access article distributed under the terms of the Creative Commons Attribution License, which permits unrestricted use, distribution, and reproduction in any medium, provided the original author and source are credited. Hosting by Science Repository.DOI: 10.31487/j.COR.2020.12.01
Figures & Tables
Table 1: Test product food nutrition facts: meals and shake product (Hormel Foods, Inc).
|
|
NUTRITION FACTS (% DAILY VALUE) BY PRODUCT |
|||
|
Beef & Mushroom* |
Chicken & Dumplings* |
Vegetarian Stew* |
Shake** |
|
|
Calories |
350 (18) |
300 (15) |
330 (17) |
520 (26) |
|
Total Fat, gm |
22 (34) |
16 (25) |
17 (22) |
21 (27) |
|
Saturated Fat, gm |
6 (30) |
2 (10) |
2 (10) |
(--) |
|
Trans fat, gm |
0 (0) |
0 (0) |
0 (0) |
0 (0) |
|
Polyunsaturated Fat, gm |
2 (--) |
2 (--) |
2 (--) |
0 (0) |
|
Monounsaturated Fat, gm |
14 (--) |
10 (--) |
11 (--) |
0 (0) |
|
Cholesterol, mg |
40 (13) |
75 (25) |
0 (0) |
30 (10) |
|
Sodium, mg |
500 (21) |
590 (25) |
670 (29) |
380 (17) |
|
Total Carbohydrate, gm |
21 (7) |
17 (6) |
32 (12) |
60 (2) |
|
Dietary Fiber, gm |
4 (16) |
2 (8) |
5 (18) |
0 (0) |
|
Protein, gm |
16 (30) |
23 (42) |
11 (20) |
22 (44) |
|
Total Sugars, gm |
2 (--) |
2 (--) |
3 (--) |
27 (--) |
|
Calcium, mg |
26 (2) |
26 (2) |
26 (2) |
650 (50) |
|
Potassium, mg |
440 (9) |
230 (5) |
470 (10) |
380 (8) |
|
Iron, mg |
1 (1) |
0.5 (4) |
1 (8) |
1 (4) |
|
Magnesium, mg |
42 (10) |
25 (6) |
63 (15) |
0 (0) |
|
Zinc, mg |
1.9 (19) |
0.5 (5) |
1.1 (10) |
0 (0) |
|
Copper, mg |
0.09 (10) |
0.04 (4) |
0.01 (1) |
0 (0) |
|
Phosphorus, mg |
263 (21) |
175 (14) |
188 (15) |
0 (0) |
|
Vitamin D, mcg |
0 (0) |
0 (0) |
0 (0) |
0 (0) |
|
Vitamin A, mcg |
0 (0) |
130 (15) |
270 (30) |
20 (2) |
|
Vitamin C, mg |
0 (0) |
0 (0) |
0 (0) |
0 (0) |
|
Vitamin K, mcg |
0 (0) |
0 (0) |
17 (14) |
0 (0) |
|
Vitamin B6, mg |
0.1 (7) |
0.09 (5) |
0.2 (11) |
(--) |
|
Vitamin B12, mcg |
0.5 (22) |
0.1 (4) |
1.0 (43) |
(--) |
% Daily Value based on FDA recommendations for a 2000 calorie per day, adult diet. Blank cells (--) represent data not available.
*Meal Package size: *213 gm; ** Shake size: 250 ml
Table 2: Study patients characteristics.
|
|
All subjects (n = 10) |
All subjects Percentage |
Product Evaluation Subjects* (n= 4) |
Product Evaluation Percentage |
|
|
Gender |
Male |
7 |
70 |
3 |
75 |
|
|
Female |
3 |
30 |
1 |
25 |
|
Age (years) |
|
59.9 (mean) |
6.97 (SD) |
60 (mean) |
4.18 (SD) |
|
Ethnicity |
Caucasian |
8 |
80 |
3 |
75 |
|
|
Hispanic |
1 |
10 |
0 |
0 |
|
|
Asian |
1 |
10 |
1 |
25 |
|
Smoker |
Current or former |
3 |
30 |
1 |
25 |
|
Vitamin/ Mineral Use |
(yes) |
4 |
40 |
1 |
25 |
|
Cancer Location |
SCC Tonsil p16 positive |
6 |
60 |
3 |
75 |
|
|
Base of Tongue p16 positive |
3 |
30 |
1 |
25 |
|
|
Oral Tongue p16 positive |
1 |
10 |
0 |
0 |
Product Evaluation subjects are a subset of “all” subjects. Ten subjects completed the study (6 during treatment and 8 after treatment with four of these during and after treatment); 4 of these patients completed the product evaluation (one during and three after treatment).
Table 3: Patients’ clinical oral condition and saliva production by treatment group and by those taking and not taking pain medication.
|
|
Acute Group (n = 6) |
Post-Treatment Group (n = 8) |
|
Taking Pain Medication (n =4) |
Not Taking Pain Medication (n =6) |
|
Plaque Index |
0.37±0.54 |
0.41±0.45 |
0.43±0.72 |
0.31±0.37 |
|
|
Gingival Index |
0.34±0.43 |
0.45±0.38 |
0.34±0.53 |
0.52±0.49 |
|
|
Mucositis Ulcer Score |
0.86±0.37 |
0.0±0.0 |
0.84+0.19 |
0.31±0.60 |
|
|
Total Mucositis score |
2.1±0.45 |
0.31±0.43 |
2.07±0.60 |
0.94+1.07 |
|
|
Saliva WRS |
1.54±1.76 |
5.27±11.32 |
1.80±2.40 |
0.76±0.73 |
|
|
Saliva WSS |
3.19±3.56 |
2.64±2.13 |
4.48±4.30 |
1.26±1.13 |
Ten subjects completed the study (six during treatment and eight after treatment with four of these during and after treatment).
Table 4: Study patients’ product evaluation.
|
|
Favourable N (%) |
Not Favourable N (%) |
No response N (%) |
|
Portion Size |
9 (82%) |
2 (18%) |
0 (0%) |
|
Taste met expectations* |
8 (73%) |
2 (18%) |
0 (0%) |
|
Product Taste |
7 (64%) |
4 (36%) |
0 (0%) |
|
After-taste lingering in mouth** |
8 (73%) |
2 (18%) |
1 (9%) |
|
Salty Flavor of Meal |
10 (91%) |
1 (9%) |
0 (0%) |
|
Sweet Flavor of Meal |
11 (100%) |
0 (0%) |
0 (0%) |
|
Sour Flavor of Meal |
11 (100%) |
0 (0%) |
0 (0%) |
|
Bitter Flavor of Meal |
11 (100%) |
0 (0%) |
0 (0%) |
|
Burning Sensation** |
9 (82%) |
1 (9%) |
1 (9%) |
|
Meal fully heated per instructions |
8 (73%) |
2 (18%) |
1 (9%) |
|
Meal Temperature |
9 (82%) |
1 (9%) |
1 (9%) |
Four patients evaluated 11 products.
Table Note* One rating (9%) was neutral.
Table Note** An evaluation of ‘none’ is considered favourable for lingering after-taste and burning sensation.
References
- Epstein JB, Barasch A (2010) Taste disorders in cancer patients: pathogenesis, and approach to assessment and management. Oral Oncol 46: 77-81. [Crossref]
- Ganzer H, Rothpletz Puglia P, Byham Gray L, Murphy BA, Touger Decker R (2015) The eating experience in long-term survivors of head and neck cancer: a mixed-methods study. Support Care Cancer 23: 3257-3268. [Crossref]
- Hovan AJ, Williams PM, Stevenson Moore P, Wahlin YB, Ohrn KEO et al. (2010) A systematic review of dysgeusia induced by cancer therapies. Support Care Cancer 18: 1081-1087. [Crossref]
- McLaughlin L, Mahon S (2014) A meta-analysis of the relationship among impaired taste and treatment, treatment type, and tumor site in head and neck cancer treatment survivors. Oncol Nurs Forum 41: E194-E202. [Crossref]
- Larsson M, Hedelin B, Athlin E (2003) Lived experiences of eating problems for patients with head and neck cancer during radiotherapy. J Clin Nurs 12: 562-570. [Crossref]
- Molassiotis A, Farrell C, Bourne K, Brealey SG, Pilling M (2012) An exploratory study to clarify the cluster of symptoms predictive of chemotherapy-related nausea using random forest modeling. J Pain Symptom Manage 44: 692-703. [Crossref]
- Prescott J (1999) Flavour as a psychological construct: implications for perceiving and measuring the sensory qualitites of foods. Food Qual Pref 10: 349-356.
- Bisogni CA, Connors M, Devine CM, Sobal J (2002) Who we are and how we eat: a qualitative study of identities in food choice. J Nutr Educ Behav 34: 128-139. [Crossref]
- Evans BC, Crogan NL, Shultz JA (2005) The meaning of mealtimes: connection to the social world of the nursing home. J Gerontol Nurs 31: 11-17. [Crossref]
- Hamburg ME, Finkenauer C, Schuengel C (2014) Food for love: the role of food offering in empathic emotion regulation. Front Psychol 5: 32. [Crossref]
- Hetherington MM (2002) The physiological-psychological dichotomy in the study of food intake. Proc Nutr Soc 61: 497-507. [Crossref]
- McQuestion M, Fitch M, Howell D (2011) The changed meaning of food: Physical, social and emotional loss for patients having received radiation treatment for head and neck cancer. Eur J Oncol Nurs 15: 145-151. [Crossref]
- Meiselman HL (2008) Dimensions of the meal. J Foodserv 19: 13-21.
- Plastow NA, Atwal A, Gilhooly M (2015) Food Activities and Identity Maintenance Among Community-Living Older Adults: A Grounded Theory Study. Am J Occup Ther 69: 6906260010. [Crossref]
- Winkler MF (2007) American Society of Parenteral and Enteral Nutrition Presidential Address: food for thought: it's more than nutrition. JPEN J Parenter Enteral Nutr 31: 334-340. [Crossref]
- McLaughlin L (2014) Taste dysfunction and eating behaviors in survivors of head and neck cancer treatment. Medsurg Nurs 23: 165-170. [Crossref]
- Ottosson S, Laurell G, Olsson C (2013) The experience of food, eating and meals following radiotherapy for head and neck cancer: a qualitative study. J Clin Nurs 22: 1034-1043. [Crossref]
- Pateman KA, Ford PJ, Batstone MD, Farah CS (2015) Coping with an altered mouth and perceived supportive care needs following head and neck cancer treatment. Support Care Cancer 23: 2365-2373. [Crossref]
- Epstein JB, Villines D, Epstein GL, Smutzer G (2020) Oral examination findings, taste and smell testing during and following head and neck cancer therapy. Support Care Cancer 28: 4305-4311. [Crossref]
- National Cancer Institute (2010) Diet History Questionnaire, Version 2.0. National Institutes of Health, Epidemiology and Genomics Research Program.
- Cooperstein E, Gilbert J, Epstein JB, Dietrich MS, Bond SM et al. (2012) Vanderbilt Head and Neck Symptom Survey version 2.0: report of the development and initial testing of a subscale for assessment of oral health. Head Neck 34: 797-804. [Crossref]
- Kuba S, Fujiyama R, Yamanouchi K, Morita M, Sakimura C et al. (2018) Awareness of dysgeusia and gustatory tests in patients undergoing chemotherapy for breast cancer. Support Care Cancer 26: 3883-3889. [Crossref]
- Epstein JB, Villines D, Epstein GL, Smutzer G (2020) Patient Reported Outcomes, Oral Health, Taste and Dietary Impact During and Following Head and Neck Cancer Therapy. J Cancer Biol Res 8: 1128.