Application of A Simple and Reliable Cell Proliferation and Viability Assay in Green Tea Extract-and Catechin-Induced Growth Inhibition of Cancer Cells
A B S T R A C T
Several colorimetric cell proliferation/viability assays have been widely used in basic research in recent years. Meanwhile, the limitations of these methods in some applications have been reported. We found a significant drawback when these common methods were used to evaluate the effect of green tea extract or catechins on cell proliferation and viability. To overcome this problem, a simple and reliable method was developed for measuring cell proliferation/viability in response to green tea extract or catechins. This method is based on the principle that the color intensity caused by green tea extract or catechins is proportionally correlated to the cell inhibition and cell death. This method is simple, reliable, and economic. By using this method, we demonstrated that the green tea extracts and catechins tested significantly inhibited both suspension leukemia and adherent epithelial cancer cells, which suggest that the green tea extract and its catechins are a potential cancer prevention and chemotherapy agent. It appears that multiple mechanisms are responsible for the green tea extract- and catechin-induced growth inhibition of the cells.
Keywords
Cancer, cell death, cell proliferation, catechins, assays, green tea
Introduction
Cell proliferation is the biological process of cells increasing in number over time through cell division. In hematopoietic cells, the cell proliferation is required for hematopoiesis and hemostasis. For example, in a healthy adult person, approximately 1011–1012 new blood cells are produced daily in order to maintain steady state levels in the peripheral circulation [1]. Aberrations of the cell proliferation can lead to hematological diseases, such as acute (AML) and chronic myelogenous leukemia (CML). The abnormal cell growth in other tissues/organs can also lead to different types of diseases including cancers. Thus, assessment of cell proliferation and viability is critical to many aspects of basic biological and medical research [2-4]. There are a variety of cell proliferation assay methods based on various cell functions such as enzyme activity, cell membrane permeability, cell adherence, ATP production, co-enzyme production, and nucleotide uptake activity [5]. The most common non-radioactive colorimetric methods are Trypan Blue exclusion, MTT (3-(4,5-Dimethylthiazol-2-yl)-2,5-diphenyltetrazolium bromide) and XTT (2,3-Bis-(2-Methoxy-4-Nitro-5-Sulfophenyl)-2H-Tetrazolium-5-Carboxanilide) assays, and Resazurin dye (7-hydroxy-3H-phenoxazin-3-one 10-oxide) staining. Trypan Blue exclusion assay is used to test cell membrane integrity by counting living and dead cells (blue color) in a hemocytometer. MTT is reduced by dehydrogenase enzymes in metabolically active cells. The resulting formazan is insoluble purple formazan that can be read and quantified by a spectrophotometer [6]. XTT is the second-generation tetrazolium dye and in the presence of an electro-coupling reagent, XTT is cleaved, producing a soluble brightly colored orange derivative in viable cells [7]. Resazurin is a blue dye that has been used as an oxidation-reduction indicator in cell viability assays, because the reduction of resazurin correlates with the numbers of living cells [8]. Mitochondrial enzymes, such as NADPH dehydrogenase, are probably responsible for the transference of electrons from NADPH + to resazurin, leading to the pink colored resorufin.
Green tea is one of the most popular and widely consumed beverages in the world. Green tea has been shown to have many health benefits including the prevention of several type cancers in vitro although some inconsistent data have also been reported. The health-promoting effects of green tea are mainly attributed to its antioxidant polyphenols. Catechins are the major polyphenols. The leaves of the tea plant produce more catechins than any other plant. The major catechins found in green tea are (-)-Epigallocatechin gallate (EGCG), (-)-epicatechin gallate (ECG), (-)-epigallate catechin (EGC), and (-)-epicatechin (EC) [9]. In these catechin studies, assessment of their effects on cell growth especially on cancer cells plays a critical role in understanding their biological activity, the health benefit, and possible application for cancer chemotherapy. Many of these studies involved in the application of MTT and XTT assays. However, the limitations of MTT and XTT for measurement of antiproliferative activity of green tea catechins have been reported in several papers [10, 11]. We also found the color induced by green tea extract or purified catechins in target cells interfered significantly with the colorimetric signals induced by MTT, Resazurin, and XTT reagents, generating either overestimated, underestimated or irregular absorbances, especially when a high concentration of green tea extract or catechin is applied to culture cells. To overcome this drawback, we have developed a simple cell proliferation assay without using any chemical color inducer to evaluate the anti-proliferation effect of green tea extracts or catechins in human myeloid leukemia and epithelial cancerous cells in culture. The absorbances measured by this method are proportionally to the color intensity caused by green tea extract and purified catechins but correlate inversely with numbers of viable cells and cell proliferation. This method is named as simple, direct reciprocal assay (SDR).
Materials and method
I Green tea extract (powder) and other reagents
The Bulk-green tea extract powder (B-GT) containing 80% catechins were purchased from Bulksupplents.com (Henderson, NY). The B-GT powder was dissolved in distilled water (ddH2O) at a concentration of 10% (gram/ml) as a stock solution (B-GTE). EGCG, ECG, EC, and Trypan Blue were obtained from Sigma-Aldrich (St. Louis, MO). XTT viability assay kit was purchased from Cell Signaling (Danvers, MA) and ATCC (Manassas, VA), respectively. MTT and Resazurin cell proliferation/cell viability assay kits were obtained from ATCC (Manassas, VA).
II Preparation of green tea extract from tea leaves and catechin solutions
Three type Chinese green tea (leaves), Xihu-Longjing (XH-GT), Yellow-Mountain (Y-GT), Xinyang-Maojian (XM-GT) were purchased and the tea leaves were soaked in hot ddH2O for 24 h at a concentration of 8% (gram/ml) followed by filtration, after which the filtrates (extracts) were named XH-GTE, Y-GTE and XM-GTE, respectively. These extracts were stored in a refrigerator for further applications. EGCG, ECG and EC were first dissolved in DMSO and then diluted in ddH2O before applied to culture cells.
III Maintenance of cell lines
Human MV4-11, TF-1a, MCF-7, and Help-G2 cell lines were purchased from ATCC (Rockville, MD). The MV4-11 and TF-1a cell lines were routinely maintained in Iscove’s Modified Dulbecco’s Medium (IMDM) supplemented with 10% fetal bovine serum. MCF-7 and Hep-G2 cell lines were maintained in Eagle's minimal essential medium (EMEM) with 15% fetal bovine serum. All the cells were cultured at 37°C in humidified air containing 5% CO2. The culture media and fetal bovine serum were purchased from GibcoBRL/ThermoFisher (Grand Island, NY).
IV Calibation of spectrophotometer
A 2-fold and 5-fold serial dilution of IMDM, EMEM and green tea extract (B-GTE) were prepared and an aliquot of the solutions were placed on a 96-well plate. The absorbance of the serial dilutions was read at a wavelength of 470nM in a spectrophotometer (Spectra-max, 384 plus, Molecular Devices, Sunnyvale, CA).
V Determination of cell death by trypan blue dye
One volume of trypan blue dye (0.4%) was added to one volume of cell suspension (5 x 10⁵/ml) and incubated for 2 min at room temperature. Thereafter, an aliquot of the cell-trypan blue mixture was loaded in a hemocytometer, and 200 cells were counted under a light microscope to determine the percentage of nonviable cells (blue color). Triplicate wells of viable cells for each treatment were counted. The experiment was repeated for three times.
VI XTT, MTT, and Resazurin cell proliferation/viability assays
Cells were grown in microtiter plates in a final volume of 100 µl of IMDM (MV4-11 and TF-1a) or EMEM (Hep-G2 and MCF-7) in the presence or absence of green tea extract or a purified catechin. For XTT assays, after 72 h incubation of the cells at 37°C in a humidified atmosphere air containing 5% CO2, the XTT labeling reagents (50 µl) were added to the cells, and the cells were continued for the incubation for 4 h. After solubilizing, the formazan dyes were quantitated using the microtiter plate reader at a wavelength of 470nM, as recommended by the manufacturers (ATCC and Cell signaling). For MTT assay, cells were incubated for 48–72 hours. Then, 10µl of the MTT labeling reagent were added to the cells and incubated for another 4 hours in a humidified air atmosphere containing 5% CO2. Subsequently, 100µl of detergent reagent were added and left the plate in the dark for 2 hours at room temperature. After solubilization, the formazan dye in the plate was quantitated by reading absorbance at 570nM. For Resazurin Assay, 10µl of resazurin blue dye was added to the cells, after which the cells were returned to the incubator for 2h. Then the plate was read at 570nM.
VII Our simple direct reciprocal assay (SDR Assay)
Exponentially growing cells were harvested by centrifugation and resuspended in IMDM (MV4-11 and TF-1a) or EMEM (HepG2 and MCF7) at a concentration of 2-5 x 10⁵, after which 100 µl of the cell suspension were transferred to the wells in a 96-well plate in the presence or absence of green tea extract or a catechin. After 48-72h incubation, the absorbance of the cells was read at 470nM without adding any chemical color inducer. The absorbance was then converted to its reciprocal.
Statistical analysis
The Microsoft excel program was used for all statistical analysis. Mean value and standard deviation were calculated by the program.
Results
I Calibration of the spectrophotometer
As described above the SDR assay is based on colorimetric signal. However, the signal in SDR assay is from the color induced by green tea extract or catechins in target cells, most likely, as a result of interactions between the green tea catechins and the extracellular or intracellular molecules of the cells. To evaluate SDR reliability and the correlations between the color and absorbance, we first measured the response of our spectrometer (Spectra-max, 384 plus) to the colors of three solutions that were serially diluted. Among these three solutions, two of which are culture media, IMDM and EMEM and one of which is green tea extract, B-GTE (light brown color). A 5-fold serial dilutions for B-GTE were 1:5, 1:25, 1:125; and 1:625; 2-fold serial dilutions for IMDM and EMEM were 1:2; 1:4; 1:8; and 1:16, respectively. The measured absorbance at 470nM are depicted in Figure 1. These dilutions produced linearly decrease in absorbance with the regression equations are 0.9197, 0.9495, and 0.9374 for B-GTE, IMDM, and EMEM, respectively. These data suggest that there is good correlation between the color changes of the solutions and amounts of absorbance. Therefore, the spectrophotometer is reliable for detecting quantitatively colorimetric signals in the cells treated with green tea extracts or catechins.
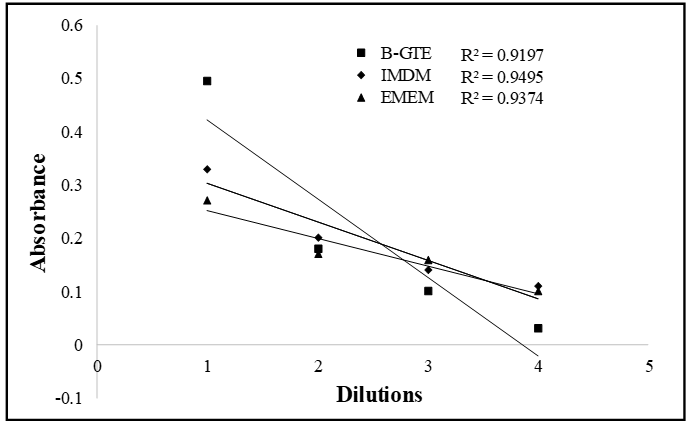
Figure 1: Solution color and absorbance. A 2-fold serial dilution for IMDM and EMEM and 5- fold serial dilution for B-GTE were prepared and placed on a 96-well plate. The absorbance of the serial dilutions was read at a wave length of 470nM in a spectrophotometer. The numbers under the x axis indicate dilutions. 1: stock solution (control) without any dilution; 2: B-GTE had 5-fold dilutions from 1 and IMDM/EMEM had 2-fold dilutions from 1; 3: B-GTE had 5-fold dilutions from 2 and IMDM/EMEM had 2-fold dilutions from 2; 4:B-GTE had 5-fold dilutions from 3 and IMDM/EMEM had 2-fold dilutions from 3.
II Green tea extract and catechins caused color development in the culture cells.
Normal cell suspension and the medium in adherent cell culture usually show slight pink color at the beginning of cell culture due to the presence of phenol in the media (IMDM and EMEM). After 2-3 days, the color of the cell suspension or medium turns to light yellow as a result of rapid growth of cells and decrease in pH. As shown in the Figure 2, the control MV4-11 cells (without green tea extract or catechins) show slight yellow color after three-day culture. However, the cells treated with the three green tea extracts (B-GTE, Y-GTE, XH-GTE) and catechins (EC, ECG, EGCG) significantly turned the color from the light yellow to brown and dark-brown color. The intensity of the color varied with the type of green tea extracts and the catechin used. The intensity of the color is also dose-dependent; the more green-tea extract or catechin, the darker colors being observed (Figure 2). The darkest color occurred when the highest concentration of B-GTE, Y-GTE, XH-GTE, EC, ECG, or EGCG was added to the cells. The color development by the green tea extract and catechin was not limited to MV4-11 cells and the similar dose-dependent color development were also observed in suspension TF-1a, adherent Hep-G2 and MCF-7 cells (data not shown). The color intensity was proportional to the decrease in the density of the cells and increase in the numbers of dead cells or cell debris observed under inverted microscope: the higher concentration of green tea extract or catechin, the less cell density and more dead cells (or cell debris) being observed (Figure 3 A, B). In adherent Hep-G2 cells, the significant disruption of cell monolayers was clearly observed in the cells treated with B-GTE and EGCG (Figure 3B). Similar disruption of MCF-7 cells was also significant (data not shown).
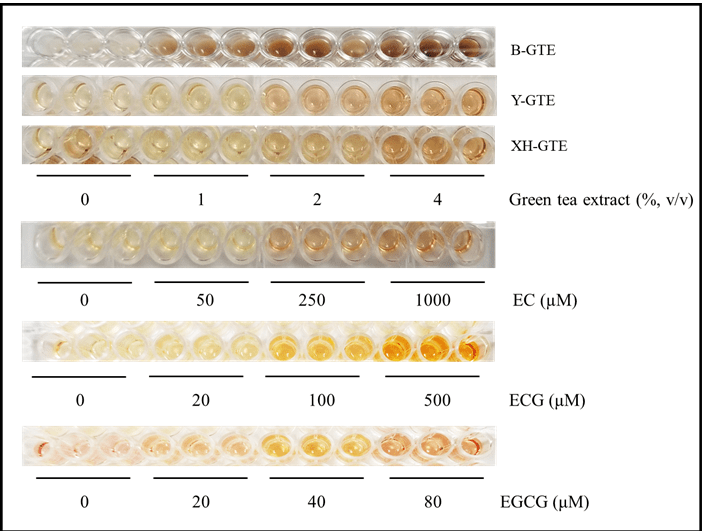
Figure 2: Green tea extract and catechins cause color development in human myeloid leukemia cells. MV4-11 cells in log phase were harvested and then incubated with the green tea extract or catechins in 96-well plate for three days, after which the plate was photographed.
III Cell proliferation/viability measured by SDR assay
Since the color development by green tea extract/catechin is proportional to the cell death/cell debris and inversely proportional to the viable cell density observed under inverted microscope, we next used SDR method to evaluate whether the color development in the target cells can directly and quantitatively reflect the cell proliferation/viability. Addition of B-GTE, EC, ECG, and EGCG variably, but significantly led to enhanced absorbances in all four type cell lines (MV4-11, TF-1a, Hep-G2 and MCF-7) tested. The increase in the absorbance is proportional to the color changes: the high color density, the bigger absorbance. The amount of absorbance is also dose-dependent: the more green-tea extract or catechin, the bigger absorbance being measured. As compared with the three catechins B-GTE induced the darkest brown color Figure 2, which could result from two factors: (1) B-GTE contains all four catechins with about 50% EGCG and (2) after added to the cells, the actual concentration of each catechin component in B-GTE could be much higher than the individual catechins added (percent vs. µM). Since the color is inversely proportional to the cell growth, the absorbance measured was converted to its reciprocal to reflect the levels of cell proliferation. As shown in Figure 4 EC at 250µM and ECG at 100µM inhibited 44% and 41% MV4-11 cells, respectively, as compared with the control cells (without EC or ECG). The low concentration of EC (50µM) or ECG (20µM) had little effect on the cell growth. When the concentration increased to 1000μM and 500µM, the EC- and ECG-induced growth inhibition of MV4-11 cells reached to 59% and 56%, respectively. According to the absorbances measured, the cells appeared more sensitive to EGCG activity, with as little as 40µM EGCG inhibiting MV4-11 cells by 15% and reaching to 55% at concentration of 80µM. Meanwhile, at 2% and 3% (v/v) B-GTE inhibited the cell growth by 45% and 63%, respectively. Similar inhibitory effect of B-GTE, EC, ECG, and EGCG on TF-1a (Figure 4), Hep-G2 and MCF-7 cells (data not shown) were also observed.
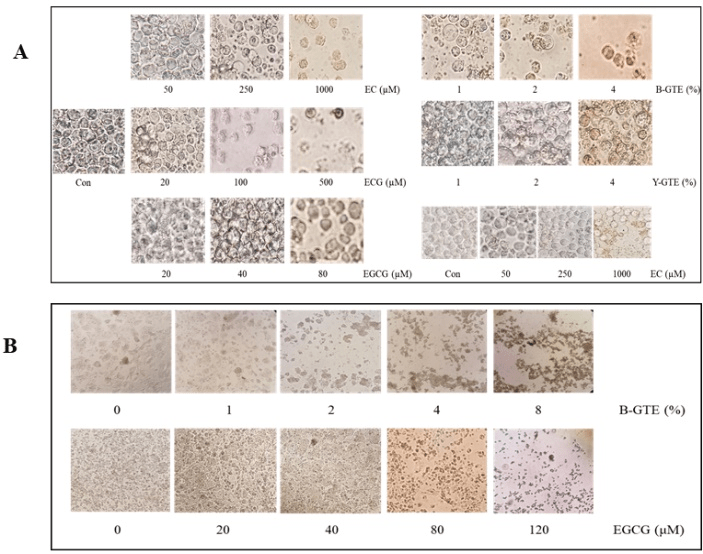
Figure 3: Green tea extract and catechins cause cell death and disrupt the formation of monolayer. TF-1a, MV4-11 (A) and Hep-G2 cells (B) in log-phase were harvested and treated with the green tea extracts or catechins for three days after which the cells were photographed under inverted microscope at 400X (A) or 100X (B). The control cells were treated with vehicle (ddH2O). All catechins were first dissolved in DMSO and then diluted in ddH2O. The panel on the right bottom in Fig. A is MV4-11 cells and the rest panels in A are TF-1a cells.
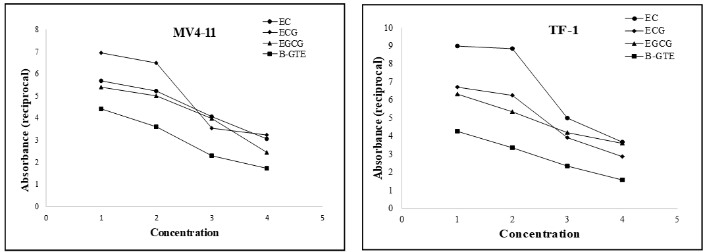
Figure 4: Green tea extract and catechins inhibit cell proliferation measured by SDR. MV4-11 and TF-1a cells in log-phase were harvested and treated with the green tea extracts or catechins for three days after which the cells were measured for absorbance with SDR assay. 1: control cells; 2: EC, ECG, EGCG, and B-GTE at concentrations of 50µM, 20µM, 40µM, and 1% (v/v), respectively; 3: EC, ECG, EGCG, and B-GTE at concentrations of 250µM, 100µM, 60µM, and 2% (v/v), respectively; 4: EC, ECG, EGCG, and B-GTE at concentrations of 1000µM, 500µM, 80µM, and 4%, respectively.

Figure 5: Comparison of the absorbances measured by XTT, MTT and SDR. TF-1a, MV4-11 and Hep-G2 cells in log-phase were harvested and treated with B-GTE for three days, after which the cells were measured for absorbance with XTT, MTT, or SDR assay. 1: culture medium; 2 control cells (without B-GTE); 3, 4, 5, and 6 are the cells treated with 1%, 2%, 3%, and 4% (v/v) B-GTE, respectively.
IV Comparison of absorbances measured by SDR and several other methods
To evaluate reliability of the absorbance measured by SDR, we compared the outcome from using SDR and several common cell proliferation/viability assay methods. First, we tried Trypan blue exclude dye and Resazurin reagent. Our preliminary study showed that the procedure for Trypan Blue dye assay is simple. However, the counting cell numbers by human eyes often led to inconsistent results (data not shown) and the counting time is very consumed. Next, we applied Resazurin dye to measure absorbance of the cells treated with or without green tea extract or catechin. We found that the color induced by Resazurin were often inconsistent in the cells treated with green tea extract or catechins, and the colorimetric signal (absorbance) measured did not have a close relationship with the numbers of viable and dead cells observed under inverted microscope (data not shown). We concluded that trypan blue and Resazurin assays are not a good choice for measuring cell proliferation and viability in response to green tea extract or catechins in the cells tested. Subsequently, we used commercial MTT and XTT assay kits to measure cell proliferation/cell viability in the absence or presence of B-GTE and compared their results with the absorbance measured by SDR. As show in Figure 5A, the groups with culture medium (only medium without cells) have the lowest absorbance and the controls (the cells without B-GTE) have the highest absorbances measured by MTT and SDR assays. Following addition of B-GTE to MV4-11 cells in a range of 1 to 6%, the absorbances (reciprocal) of the cells measured by SDR significant significantly decreased. The level of decrease is clearly does-dependent. Whereas, the absorbance measured by XTT generated a curve with decrease first followed by increase of absorbance, which does not parallel the cell inhibition observed under inverted microscope (Figure 3). The incorrect absorbance curve generated by using XTT is not limited to the leukemia cells and a similar pattern of the curve was also obtained from adherent Hep-G2 cells treated with B-GTE (Figure 5B). If MTT method was used to measure cell proliferation and viability in the presence of B-GTE, it produced about the same first decrease and then increase absorbance curve in MV4-11 cells (Figure 5C).
Discussion
Quantitative assessment of cell proliferation and the characterization of chemicals that either promote or inhibit cell proliferation are essential and important areas of basic and clinical research. Although the cell viability assay using Trypan blue dye is simple and inexpensive, the counting cell numbers by human eyes are very time consuming and the results are less accurate. In addition, the outcome from Trypan blue only reflect percentage of dead cells. In many cases, cell inhibition is a result of both cell cycle arrest and cell death. Clearly, this method is only suitable for small samples without requirement for a high accuracy. MTT and XTT assays are two common, non-radioactive colorimetric proliferation/viability assays, which have been widely used in numerous types of cells and in many applications. However, the limitations of these two methods have also been observed in several studies involved in Candida growth and green tea polyphenol-treated cells [10, 11]. We also found that green tea extract and colorless catechins cause color development in all the culture cells we tested, which remarkably interfered with the colors induced by MTT, XTT or Resazurin reagents, leading to an overestimated (underestimated growth inhibition) or irregular absorbance. To avoid this problem, we directly measured the absorbance of the color induced by green tea extract or a catechin, without addition of MTT, XTT, or Resazurin. Our data has clearly showed that the absorbance measure by this method (SDR) is inversely proportional to cell proliferation/viability. Our results demonstrated that this simple, economic, and time-saving method is more reliable than MTT, XTT, and Resazurin assays when evaluate the effect of green tea extract or catechins on cell growth. First, the color intensity induced by green tea extract or catechins in the culture cells is dose-dependent, the more green tea extract, the higher color intensity. Second, the color intensity is inversely correlated to the cell proliferation: the more intensity of the color, the less numbers of viable cells being observed under inverted microscope. The third, the color intensity is also correlated to the absorbance measured: the higher intensity of the color, the bigger absorbance amount being detected. In MTT, XTT, or Resazurin assay, the color intensity is proportional to the living cells, whereas the color intensity induced by green tea chemical components is proportional to the inhibition of cells. Therefore, the absorbance measured by SDR were converted to its reciprocal to reflect level of cell proliferation for the purpose of standardization as the way used by other cell proliferation assays.
In this study, we tested SDR method in two myeloid leukemia and two epithelia cancerous cell lines. All these cells showed similar color development following addition of green tea extract or a catechin to the cells, suggesting that the SDR method may have general application to other cells in response to green tea extracts and catechins. By testing different wavelengths, we found that the response of 470nM is particularly sensitive and reliable to the color changes. As shown in (Figure 1) the absorbances measured at 470nM obey Beers law and as such can be highly quantitative. Thus, changes in absorbance at this wavelength can be used to monitor cell proliferation/viability. In summary, SDR is a simple colorimetric and reliable cell proliferation/viability assay when study the cells treated with green tea or catechins. By presenting and using SDR method, we demonstrated that the green tea extract and catechins had profound inhibitory effect on both suspension leukemia and adherent epithelial cancer cells tested. Thus, they are a potential cancer prevention and chemotherapy agent. Although some biological activities of green tea catechins have been linked to the activation of EGCG receptor, our data showed a good linear correlation between the amounts of green tea (extract or catechin) and growth inhibition of the cells induced, suggesting that the green tea-induced growth inhibition is not a simple result from the activation of catechin receptors [12] and it may involve multiple mechanisms including possible apoptosis.
Finally, we want to point out that investigating anti-proliferation effect of green tea on cancer cells is a very active area and a single key-word search (tea polyphenol, tea extract, or tea catechin) in PubMed produced about 5000 research papers. Thus, SDR method may have broad applications in a variety of cells in the field of green tea. However, this study has no further analysis on whether SDR assay can be applied to the cell proliferation/viability assays in response to other reagents, such as growth factors and other chemicals including drugs.
Data availability
The data (image and absorbance) used to support the findings of this study are included within the article. Additional supporting images are available up request.
Conflicts of interest
None.
Acknowledgement
This work was supported by Barry University Faculty Stimulus Grant.
Article Info
Article Type
Research ArticlePublication history
Received: Tue 03, Sep 2019Accepted: Fri 20, Sep 2019
Published: Fri 27, Sep 2019
Copyright
© 2023 Xiaotang Hu. This is an open-access article distributed under the terms of the Creative Commons Attribution License, which permits unrestricted use, distribution, and reproduction in any medium, provided the original author and source are credited. Hosting by Science Repository.DOI: 10.31487/j.COR.2019.05.01
Figures & Tables
References
- Doulatov S, Notta F, Laurenti E, Dick JE (2012) Hematopoiesis: A Human Perspective. Cell Stem cell 10: 120-136. [Crossref]
- Hu X, Moscinski LC, Hill BJ, Chen Q, Wu J et al. (1998) Characterization of a unique factor-independent variant derived from human factor-dependent TF-1 cells: a transformed event. Leuk Res 22: 817-826. [Crossref]
- Hu X, Janssen WE, Moscinski LC, Bryington M, Dangsupa A et al. (2001) An IkappaBalpha inhibitor causes leukemia cell death through a p38 MAP kinase-dependent, NF-kappaB-independent mechanism. Cancer Res 61: 6290-6296. [Crossref]
- Hu X, Bryington M, Fisher AB, Liang X, Zhang X et al. (2002) Ubiquitin/proteasome-dependent degradation of D-type cyclins is linked to tumor necrosis factor-induced cell cycle arrest. J Biol Chem 277: 16528-16537. [Crossref]
- Adan A, Kiraz Y, Baran Y (2016) Cell Proliferation and Cytotoxicity Assays. Curr Pharm Biotechnol 17: 1213-1221. [Crossref]
- Stockert JC, Horobin RW, Colombo LL, Blázquez-Castro A (2018) Tetrazolium salts and formazan products in Cell Biology: Viability assessment, fluorescence imaging, and labeling perspectives. Acta Histochem 120: 159-167. [Crossref]
- Berridge MV, Herst PM, Tan AS (2005) Tetrazolium dyes as tools in cell biology: New insights into their cellular reduction. Biotechnol Annu Rev 11: 127-152. [Crossref]
- Anoopkumar-Dukie S, Carey JB, Conere T, O'Sullivan E, Van Pelt FN et al. (2005) Resazurin assay of radiation response in cultured cells. Br J Radiol 78: 945-947. [Crossref]
- Suzuki T, Pervin M, Goto S, Isemura M, Nakamura Y (2016) Beneficial effects of tea and the green tea catechin epigallocatechin-3-gallate on obesity. Molecules 21. [Crossref]
- Kuhn DM, Balkis M, Chandra J, Mukherjee PK, Ghannoum MA (2003) Uses and limitations of the XTT assay in studies of Candida growth and metabolism. J Clin Microbiol 41: 506-508. [Crossref]
- Wang P, Henning SM, Heber D (2010) Limitations of MTT and MTS-based assays for measurement of antiproliferative activity of green tea polyphenols. PLoS One 5: e10202. [Crossref]
- Tachibana H, Koga K, Fujimura Y, Yamada K (2004) A receptor for green tea polyphenol EGCG. Nat Struct Mol Biol 11: 380-381. [Crossref]